


What is The Flat Pattern with the Elliott Theory
FXOpen

The Elliott Wave theory stood the test of time as one of the most versatile trading theories ever invented. Ralph Elliott studied the way the market moves and put everything together in a sophisticated theory that reveals the market psychology.
While recovering from illness, Elliott found that the market moves in patterns. He documented them and combined the result following different market cycles.
Perhaps the most difficult part to understand with the Elliott Waves theory is how the cycles form. Back in the 1930s when the theory was developed, it was even more difficult.
Nowadays, the cycles are easy to identify because all trading platforms present the market data in different timeframes. Thus, a super-cycle as Elliott intended to explain, forms on the monthly timeframe, a grand cycle on the weekly, and so on.
The patterns form on each cycle, and Elliott discovered that the market moves in corrective and impulsive waves. To make things easy to understand, he used numbers to label impulsive waves and letters for corrective waves.
Corrective waves form more often, as the market spends a lot of time in consolidation. Therefore, Elliott further divided corrective waves into simple and complex corrections.
The simple ones are flats, zigzags, and triangles. Out of the three, the flat pattern further divides into ten different patterns, depending on what the market does.
Explaining the Flat Pattern – a, b, c Pattern
A flat is a corrective wave. Also called a three-wave structure, is labeled with letters: a-b-c. Of a lower degree, waves a and b are corrective, while the c-wave is the only one showing impulsive activity.
The key to the flat pattern is the all-important golden ratio (61.8%). The b-wave MUST retrace more than 61.8% into wave a’s territory.
Without this condition, the market move doesn’t fit into the flat pattern.
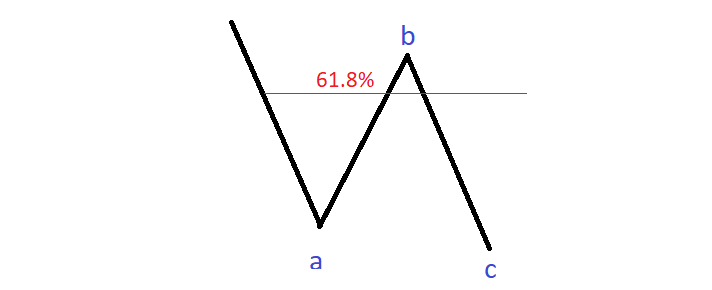
In other words, the a-wave is a corrective wave. It can be a zigzag, a flat of its own, or a complex correction (e.g., double combination, triple combination, etc.).
The b-wave that follows is corrective as well. And, it must end beyond 61.8% of the previous wave a. That is the minimum retracement for the b-wave.
The c-wave that follows is impulsive. As price action unfolds, the market forms a five-wave structure of a lower degree.
Types of Flat Patterns
Now that you know the basics of a flat’s formation, it is time to have a look at the type of flats. As mentioned earlier, no less than ten different types exist, based on the b-wave and the c-wave’s lengths.
If the b-wave retraces between 61.8% and 80%, it is said that the flat is one with a weak b-wave. The length of the c-wave gives the types of flats:
- Double failure (c-wave < b-wave)
- B-failure (c-wave between 100% and 123.6% of wave a)
- Elongated flat (c-wave >161.8% of wave a)
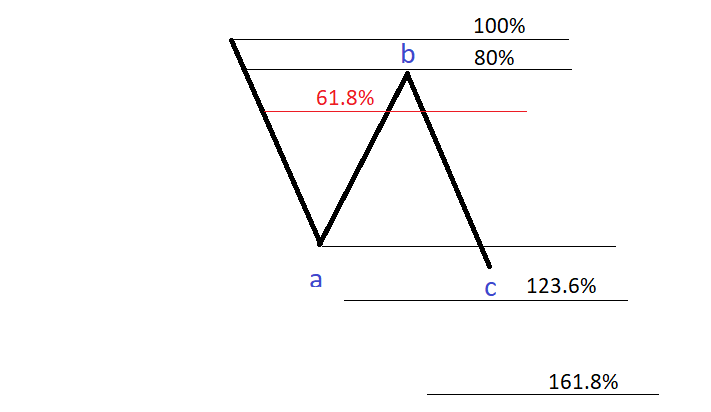
When the b-wave retraces between 80% and 100%, it is said that the market forms a normal b-wave. The three flats here are:
- C-failure (c-wave < b-wave)
- Common flat (c-wave ends between 100% and 123.6% of wave a)
- Elongated flat (c-wave > 161.8% of wave a)
Flats with a strong b-wave have them ending beyond 100% of wave a. In this category, we have:
- Irregular failure (c-wave < b-wave)
- Irregular flat (c-wave ends between 100% and 123.6% of wave a)
- Elongated flat (c-wave > 161.8% of wave a)
Finally, the market forms a running flat, when the b-wave ends beyond 161.8% of wave a.
Conclusion
This is one of the most common patterns that form. Regardless of the market (stocks, indices, currencies, etc.), they appear on all timeframes.
Understanding flat patterns is key to understanding the Elliott Wave Theory. All patterns put together are part of one of the most powerful trading theories ever created.
This article represents the opinion of the Companies operating under the FXOpen brand only. It is not to be construed as an offer, solicitation, or recommendation with respect to products and services provided by the Companies operating under the FXOpen brand, nor is it to be considered financial advice.
Stay ahead of the market!
Subscribe now to our mailing list and receive the latest market news and insights delivered directly to your inbox.

Latest articles

Amazon: Record Earnings Are Priced In as the Trend Loses Momentum
Fundamental backdrop
In the first quarter of 2026, Amazon (AMZN on FXOpen) reported a 17% increase in net sales to $181.5 billion. AWS revenue grew by 28% — its fastest pace in 15 quarters — while operating margin reached a record

Brent: The Downtrend Begins to Crack
Fundamental backdrop
In April 2026, the closure of the Strait of Hormuz pushed Brent prices to their highest levels per barrel since 2022. However, diplomatic developments reversed the market’s direction: by the end of May, prices had fallen by

Euro and Sterling Weaken as the Dollar Strengthens Ahead of Key US Data
The US dollar continues to hold firm against its major counterparts, supported by strong US macroeconomic data and expectations surrounding the release of further labour market indicators. Additional support for the greenback comes from persistent inflationary risks and the Federal