


Introduction to Chart Pattern Efficiency
FXOpen

Technical analysis has been used for a long time to identify trading opportunities on price action charts. To expand on their trading arsenal, market participants have identified chart patterns that repeat themselves over time and produce similar price movements. This article will discuss the technical analysis of chart patterns and describe how to read chart patterns in stocks, forex, and other financial instruments. Once you understand the subject well, you may open an FXOpen account to apply the concepts to live markets.
Understanding Chart Patterns and Their Significance
Chart patterns are visual representations of price movements in financial markets and are commonly used in technical analysis. They are formed by the fluctuation of prices over time and can provide valuable insights into future price movements. The purpose of analysing them is to identify potential trading opportunities and make informed investment decisions.
Here are some points that highlight their significance:
- Prediction of Price Movements: Market participants may make predictions about future price movements by recognising specific patterns on a price chart.
- Entry and Exit Points: They may provide traders with entry and exit points. For example, a bullish chart setup may signal a potential buying opportunity, while a bearish one may indicate a suitable time to sell or short an asset.
- Risk Management: Analysing chart formations may assist in setting stop-loss orders and managing risk. As chart patterns have precise trading rules, traders can determine the price levels at which the signal will be invalid and exit a trade if the market moves against them.
- Confirmation of Fundamental Analysis: Chart patterns can complement fundamental analysis by providing confirmation or signalling potential deviations. When they align with fundamental factors, it may strengthen the conviction behind a trading decision.
- Confirmation of Technical Analysis Signals: Patterns can confirm other technical analysis tools and indicators. The combination of different analysis techniques can enhance the accuracy of predictions.
- Psychological Insights: Chart patterns reflect the psychology and sentiment of market participants. Their analysis can provide insights into the collective mindset of traders and investors. Understanding market sentiment can help traders make better-informed trading decisions.
- Time Efficiency: By using pattern analysis, traders can quickly assess the market situation and recognise potential opportunities.
Major Types of Chart Patterns
Chart patterns can be categorised into reversal, continuation, and consolidation.
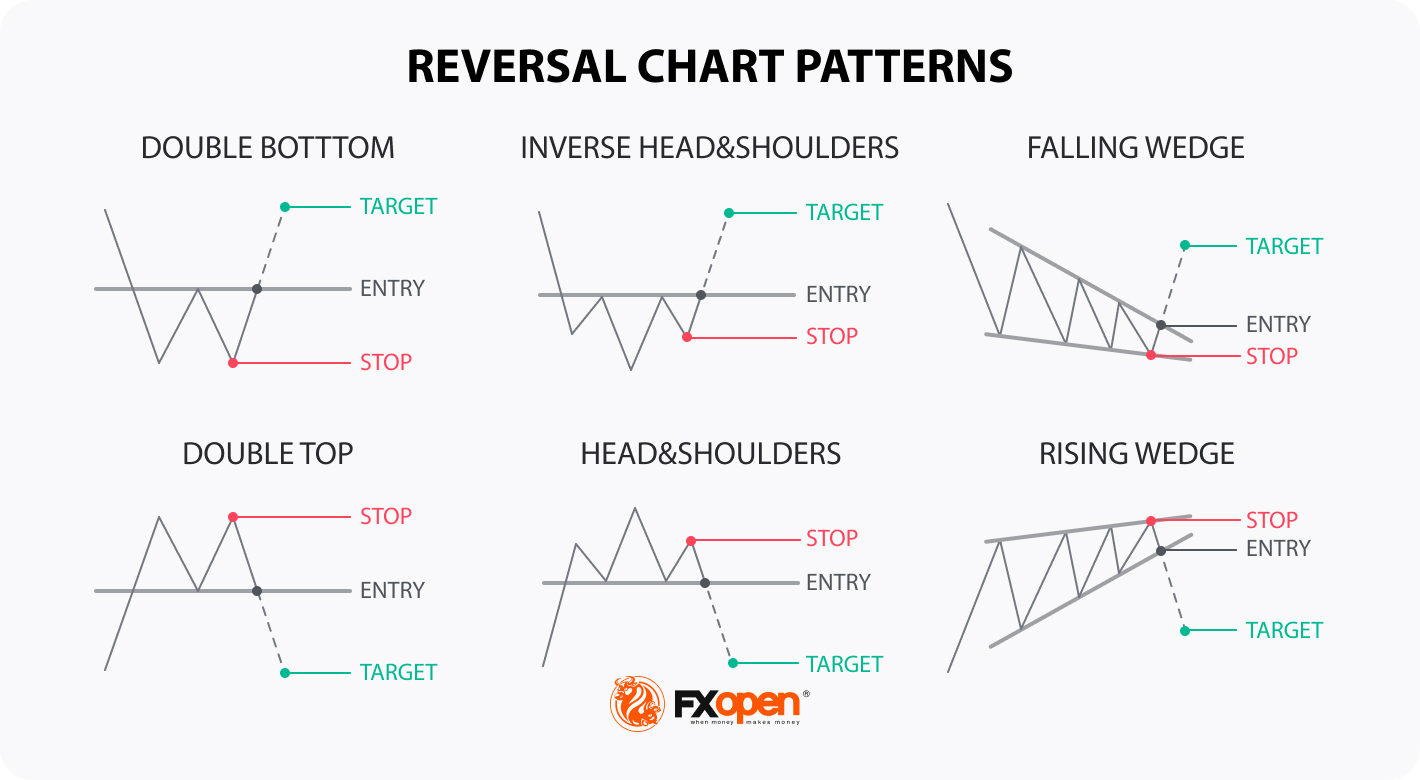
- Reversal: They indicate that a trend is losing strength and suggest a potential change. Traders often look for these patterns to identify potential opportunities for entering or exiting trades. Some common reversal setups include the head and shoulders and inverse head and shoulders, double top and double bottom, and rising and falling wedges.
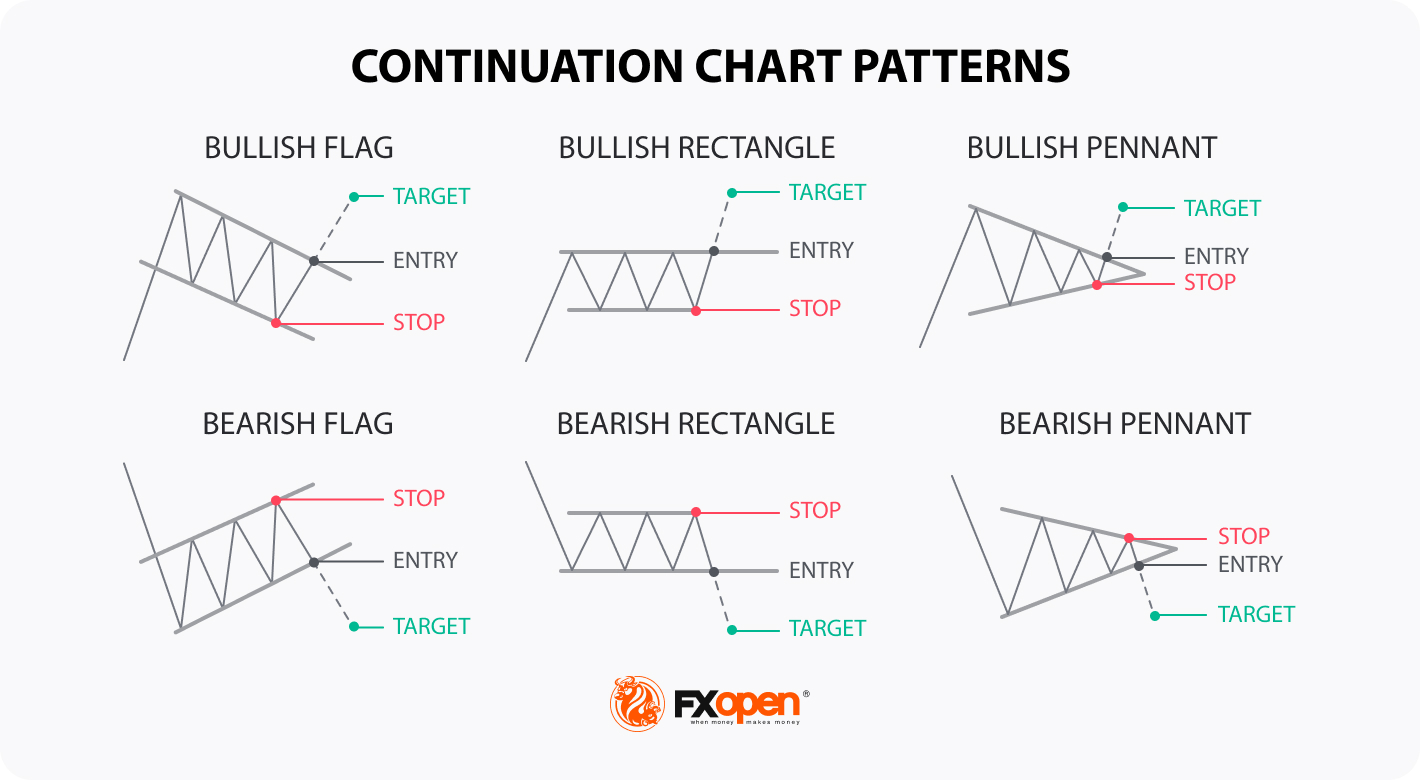
- Continuation: They highlight a slight break in the prevailing trend before it continues. Traders look for these setups to identify potential opportunities to join an ongoing trend. Some common continuation examples include flags, pennants, and rectangles.
Identifying and Interpreting Chart Patterns
Identifying and interpreting chart patterns involves a systematic approach that combines observation, analysis, and understanding of market dynamics on intraday chart patterns or weekly or monthly charts. Here are a few steps you may want to implement into your strategy:
- Study Price Charts: Start by studying price charts of the assets you are interested in, whether they’re stocks, commodities, or currencies. Use a charting platform or software that allows you to view different timeframes (e.g., daily, weekly, monthly) to gain a broader perspective.
- Learn Common Chart Patterns: Familiarise yourself with common formations such as triangles, rectangles, head and shoulders, double tops/bottoms, and flags. There are numerous resources available, including books, online tutorials, and educational websites that provide detailed information.
- Follow Requirements: Each pattern has specific requirements and characteristics. Understand the criteria that need to be met for correct signals. This may include the number of price touches on trendlines, the duration of the formation, or the relationship between the highs and lows.
- Analyse Volume: Pay attention to volume during the formation of the setup. In some cases, volume can provide confirmation or divergence signals. Generally, volume tends to be higher during a breakout, indicating increased market participation.
- Consider Timeframes: Chart patterns can appear on different timeframes. Evaluate them in the context of longer-term charts to determine their reliability. A pattern that forms on a weekly chart may carry more weight than one on a daily chart.
- Confirming Indicators: Utilise other technical indicators or oscillators to confirm the signals provided by chart patterns because patterns are not foolproof and can provide incorrect alerts. For example, if a pattern suggests a potential bullish reversal, check if the relative strength index (RSI) or moving average convergence divergence (MACD) is also showing bullish divergence or positive momentum.
- Measure Targets and Stop Loss: Once a pattern is identified and confirmed, measure the potential price target based on the formation's structure. This can be done by measuring the distance between key levels and projecting it from the breakout point. Determine an appropriate stop-loss level to manage risk.
- Practise and Refine: Chart pattern recognition requires practice and experience. Continuously analyse charts, compare your observations with historical movements, and evaluate the outcomes. Over time, you will improve your ability to identify and interpret patterns accurately.
Conclusion
It's important to note that chart setups are not infallible and should be used with other forms of analysis and risk management techniques to maximise their effectiveness. To practise, traders can leverage the TickTrader platform by FXOpen. The platform offers features and tools that allow traders to define chart patterns and confirm them with various indicators. By using a reliable and comprehensive platform, traders can better understand market dynamics and make more accurate price predictions.
This article represents the opinion of the Companies operating under the FXOpen brand only. It is not to be construed as an offer, solicitation, or recommendation with respect to products and services provided by the Companies operating under the FXOpen brand, nor is it to be considered financial advice.
Stay ahead of the market!
Subscribe now to our mailing list and receive the latest market news and insights delivered directly to your inbox.


Latest articles

Amazon: Record Earnings Are Priced In as the Trend Loses Momentum
Fundamental backdrop
In the first quarter of 2026, Amazon (AMZN on FXOpen) reported a 17% increase in net sales to $181.5 billion. AWS revenue grew by 28% — its fastest pace in 15 quarters — while operating margin reached a record

Brent: The Downtrend Begins to Crack
Fundamental backdrop
In April 2026, the closure of the Strait of Hormuz pushed Brent prices to their highest levels per barrel since 2022. However, diplomatic developments reversed the market’s direction: by the end of May, prices had fallen by

Euro and Sterling Weaken as the Dollar Strengthens Ahead of Key US Data
The US dollar continues to hold firm against its major counterparts, supported by strong US macroeconomic data and expectations surrounding the release of further labour market indicators. Additional support for the greenback comes from persistent inflationary risks and the Federal