


FXOpen

As the EUR/USD chart today shows, yesterday the rate dropped by 0.46% – the most significant strengthening of the US dollar against the euro in one day this month. Moreover, the rate fell below the psychological mark of 1.08 euros per dollar (in the first half of May, it served as resistance).
Yesterday's movement was influenced by:
→ news of rising inflation in Germany. As reported by Think.ING, inflation reached 2.4% year-on-year, up from 2.2% in April – highlighting uncertainty and the resilience of inflation;
→ the rise of the US dollar, driven by falling Treasury bonds, which increased the appeal of the American currency due to both higher yields in the US and demand for safe-haven assets.
Analysing the chart on 23 May in the article "EUR/USD Price Forms Bullish Reversal," we:
→ drew an ascending channel (shown in blue);
→ highlighted the importance of resistance at the 1.0875 level.
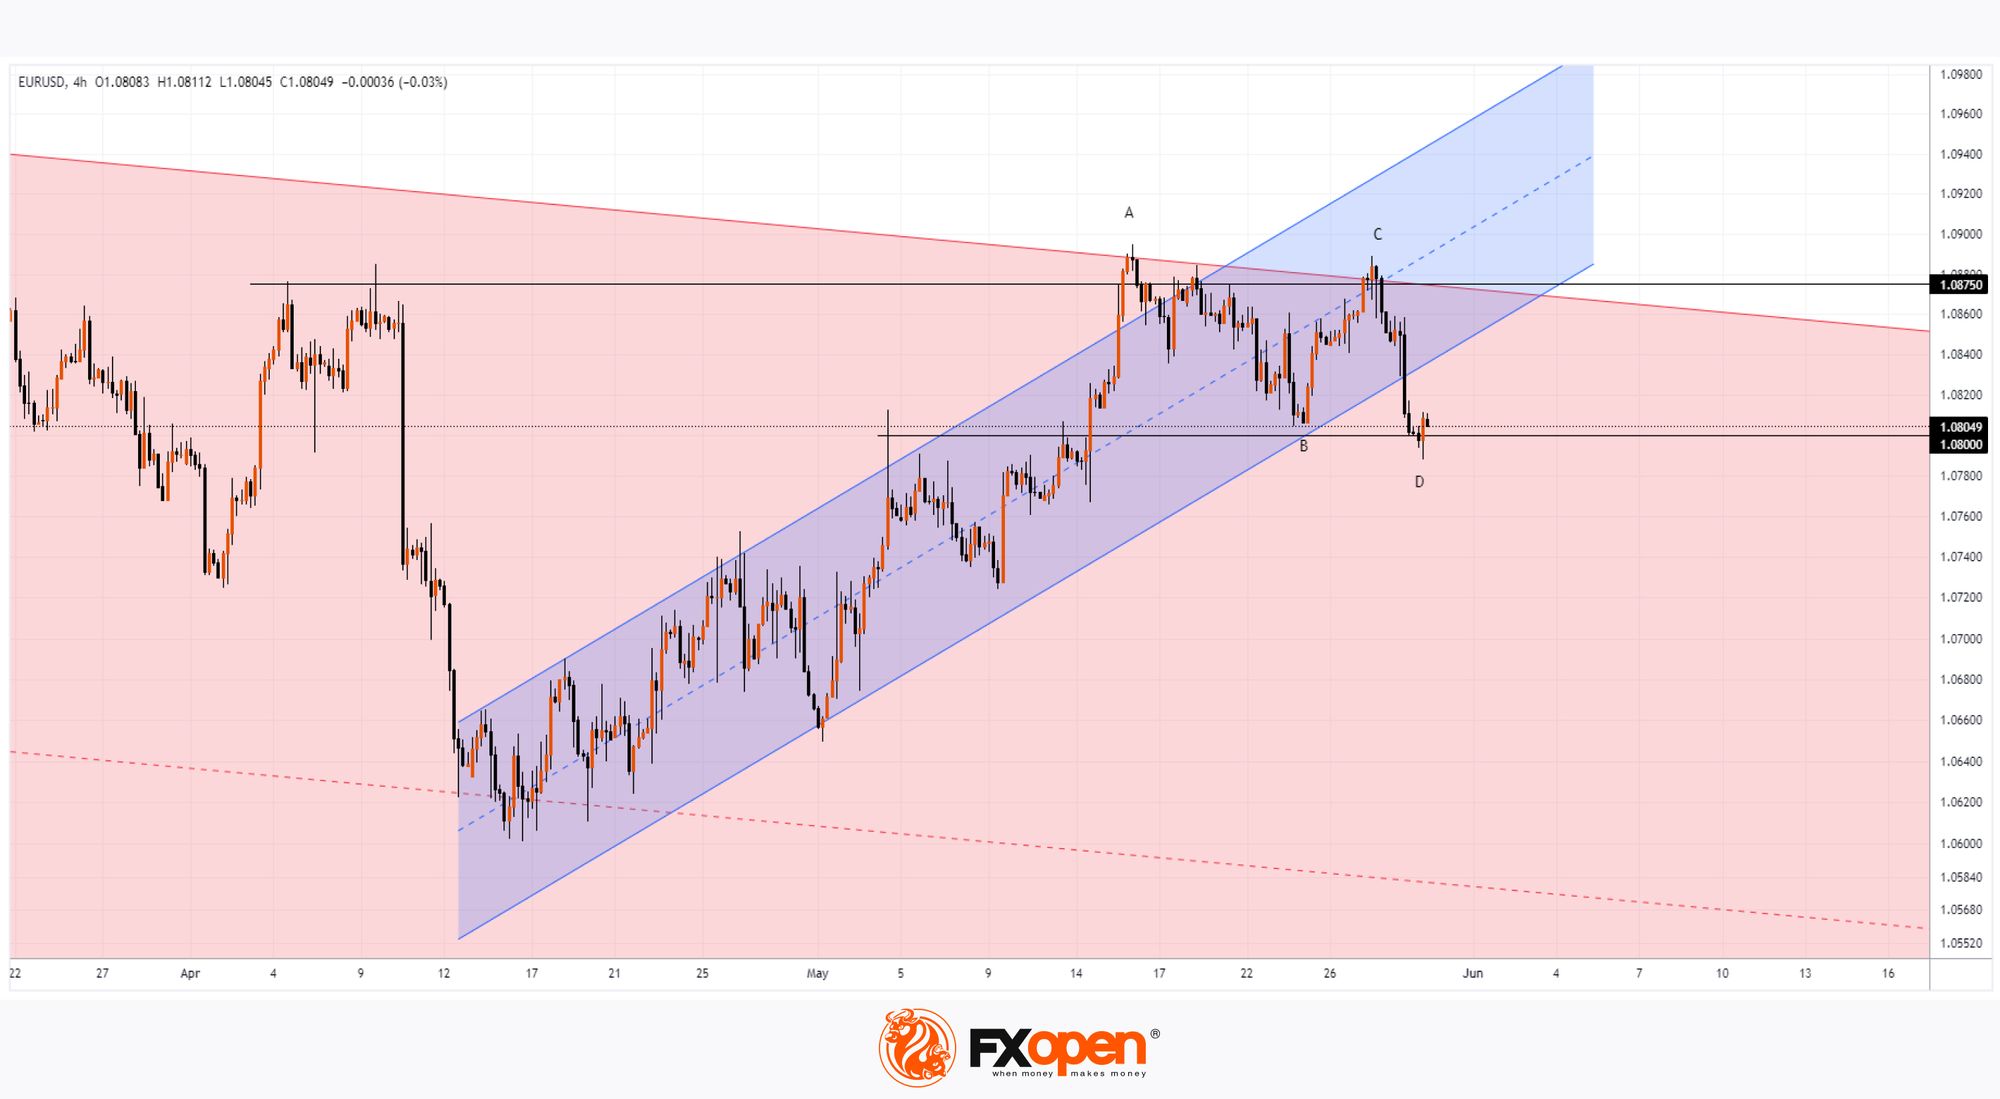
Since then, the price has risen from 1.08393, bouncing off the lower boundary to the aforementioned resistance at 1.0875, but it failed to break through. This was followed by yesterday's decline.
In addition:
→ the EUR/USD price broke below the lower boundary of the blue channel, putting its relevance into serious doubt;
→ the price formed an A-B-C-D structure (with the D low possibly yet to be rewritten) of two lower lows and highs, indicating a potential shift in the May trend from bullish to bearish.
For now, the market is holding above the 1.08 level, but it is possible that upcoming news (notably the release of the US PCE index tomorrow at 15:30 GMT+3) could disrupt the balance. If a new batch of fundamental drivers leads to another bearish impulse, we could assume that a broader downtrend (indicated by the red channel, originating from the July 2023 peak) is resuming.
Trade over 50 forex markets 24 hours a day with FXOpen. Take advantage of low commissions, deep liquidity, and spreads from 0.0 pips (additional fees may apply). Open your FXOpen account now or learn more about trading forex with FXOpen.
This article represents the opinion of the Companies operating under the FXOpen brand only. It is not to be construed as an offer, solicitation, or recommendation with respect to products and services provided by the Companies operating under the FXOpen brand, nor is it to be considered financial advice.
Stay ahead of the market!
Subscribe now to our mailing list and receive the latest market news and insights delivered directly to your inbox.


Latest articles

Consolidation Ahead of NFP: Commodity Currencies Search for Direction
Commodity-linked currencies have entered a consolidation phase following recent directional moves, as market participants adopt a wait-and-see approach ahead of key US labour market data. Current price action reflects a balance between ongoing demand for the US dollar and attempts

The Real Driver Behind the Dollar Rally: Market Insights with Gary Thomson
The US dollar has been firm, but the drivers behind the move may be more complex than they first appear.
While geopolitical tension and shifts in risk sentiment play a role, current price behaviour seems increasingly influenced by inflation expectations

EUR/USD and USD/CHF Pull Back: Market Reacts to Fundamentals
European currencies have shown a recovery in recent trading sessions after their recent decline, displaying early signs of a reversal. The US dollar is weakening amid expectations surrounding upcoming US macroeconomic data, while market participants are reassessing their short-term positions