


Trading Divergences With Wedges in Forex
FXOpen

Divergence trading in forex is a powerful technique for analysing market movements, as is observing rising and falling wedges. This article explores the synergy between divergence trading and wedges in forex, offering insights into how traders can leverage these signals. From the basics to advanced strategies, learn how you could utilise this approach effectively, potentially enhancing your trading skills in the dynamic forex market.
Understanding Divergences
In forex trading, the concept of divergence plays a pivotal role in identifying potential market shifts. A divergence in forex, meaning a situation where price action and a technical indicator like the Relative Strength Index (RSI) or Moving Average Convergence Divergence (MACD) move in opposite directions, often signals a weakening trend. This discrepancy is a valuable tool in divergence chart trading, as it may indicate a possible reversal or continuation of the current trend.
There are two primary types of divergence in forex—regular and hidden. Regular divergence occurs when the price makes higher highs or lower lows while the indicator does the opposite, often signalling a reversal. Hidden divergence, on the other hand, happens when the price makes lower highs or higher lows while the indicator shows higher highs or lower lows, typically suggesting a continuation of the current trend.
Trading Rising and Falling Wedges
Rising and falling wedges are significant patterns in forex trading, often signalling potential trend reversals. A rising wedge, formed by converging upward trendlines, often indicates a bearish reversal if it appears in an uptrend. Conversely, a falling wedge, characterised by converging downward trendlines, typically reflects a bullish reversal if it occurs in a downtrend.
Traders often look for a breakout from these patterns as a signal to enter trades. For rising wedges, a downward breakout can be seen as a sell signal, while an upward breakout from a falling wedge is often interpreted as a buy signal. When combined with divergences, this chart pattern can add confirmation and precede strong movements.
Best Practices for Trading Divergences
Trading divergence patterns in forex requires a keen eye for detail and a disciplined, holistic approach. Here are key practices for effective trading:
- Comprehensive Analysis: Before trading on divergence and wedges, be sure to analyse overall market conditions.
- Selecting the Right Indicator: Choose a forex divergence indicator that suits your trading style. Common choices include RSI, MACD, and Stochastic, available on FXOpen’s free TickTrader platform.
- Confirmation Is Key: It’s best to watch for additional confirmation from price action or other technical tools before entering a trade.
- Risk Management: Traders always set stop-loss orders to manage risk effectively. Divergence trading isn't foolproof; protecting your capital is crucial.
- Patience in Entry and Exit: Be patient as the divergence develops and confirm with your chosen indicators before entering or exiting a trade.
Strategy 1: RSI and Wedge Divergence
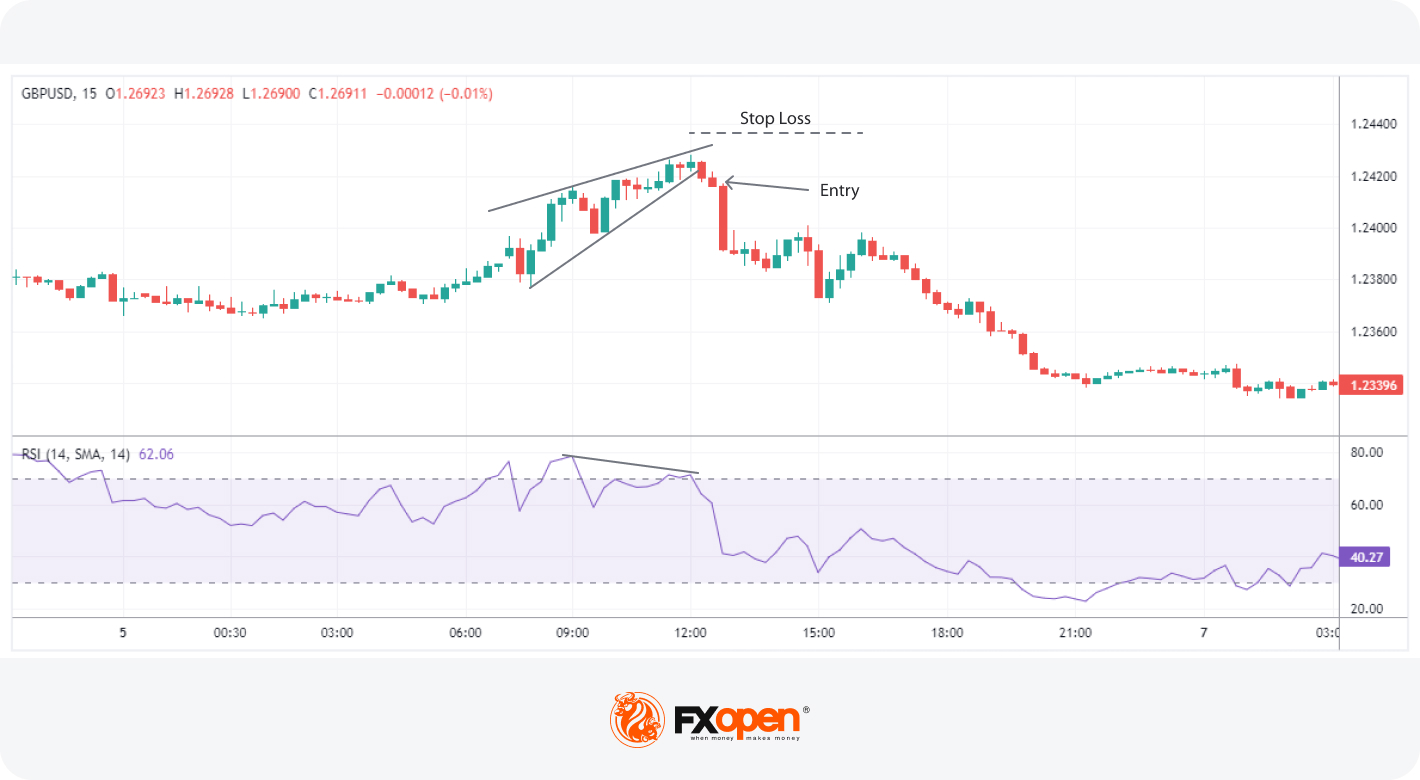
Traders focus on regular divergence patterns when the RSI is above 70 (overbought) or below 30 (oversold), combined with a rising or falling wedge pattern. The strategy hinges on identifying highs or lows within these RSI extremes. It's not crucial if the RSI remains consistently overbought or oversold, or if it fluctuates in and out of these zones.
Entry
- Traders may observe a regular divergence where both the price highs/lows and RSI readings are above 70 or below 30.
- After the formation of a lower high (in an overbought zone) or a higher low (in an oversold zone) in the RSI, traders typically watch as the RSI crosses back below 70 or above 30. This is accompanied by a breakout from a rising or falling wedge, acting as a potential signal to enter.
Stop Loss
- Stop losses might be set just beyond the high or low of the wedge.
Take Profit
- Profit targets may be established at suitable support/resistance levels.
- Another potential approach is to exit when the RSI crosses back into the opposite overbought/oversold territory.
Strategy 2: MACD and Wedge Divergence
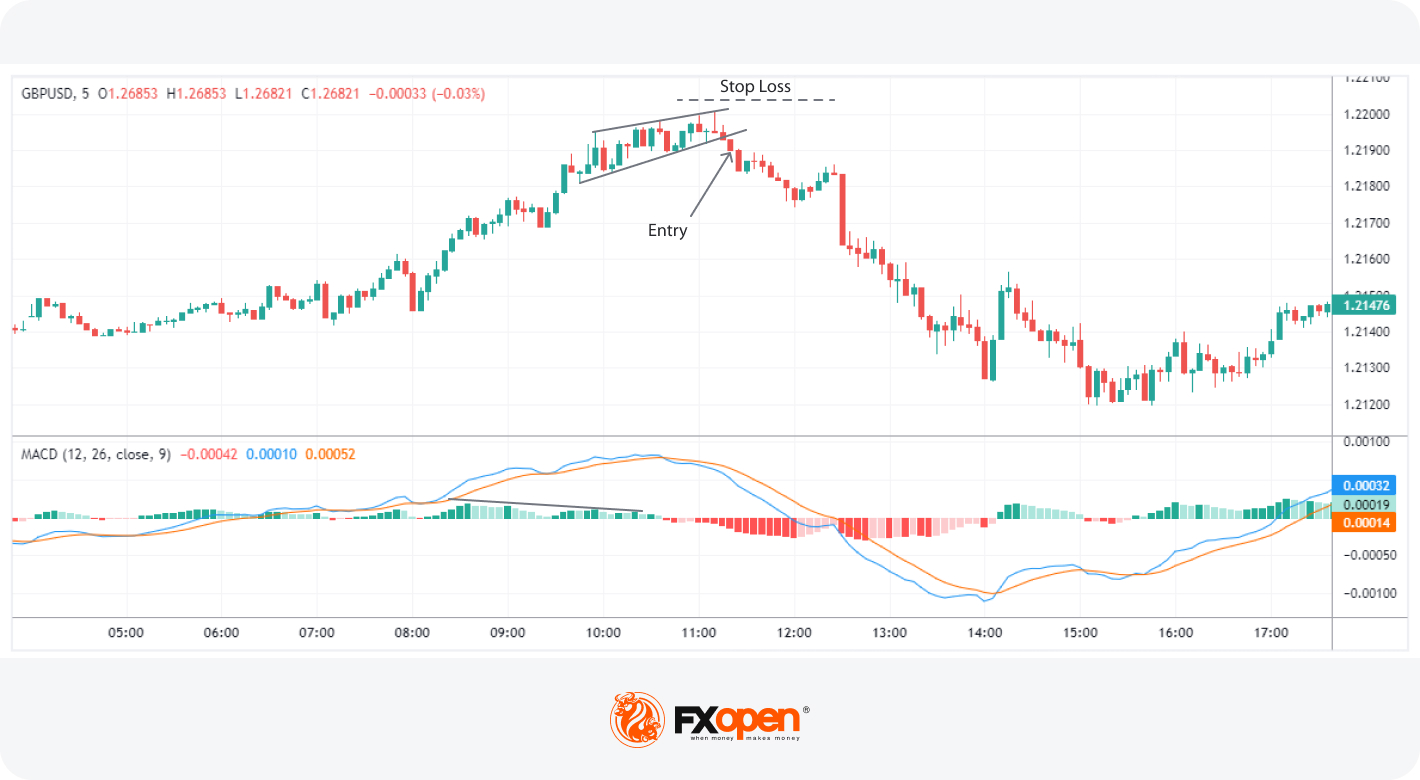
Regarded as one of the best divergence trading strategies, MACD divergence focuses on the discrepancy between price action and the MACD histogram. The strategy is particularly potent when combined with a rising or falling wedge pattern in price.
Entry
- Traders typically observe for the MACD histogram to diverge from the price. This divergence manifests as the price reaching new highs or lows while the MACD histogram fails to do the same.
- The strategy involves waiting for the MACD signal line to cross over the MACD line in the direction of the anticipated reversal. This crossover should coincide with a breakout from the rising or falling wedge.
- After these conditions are met, traders may consider entering a trade in anticipation of a trend reversal.
Stop Loss
- Stop losses may be set beyond the high or low of the wedge, which may help traders manage risk by identifying a clear exit point if the anticipated reversal does not materialise.
Take Profit
- Profit targets might be established at nearby support or resistance levels, allowing traders to capitalise on the expected move while managing potential downside.
Strategy 3: Stochastic and Wedge Divergence
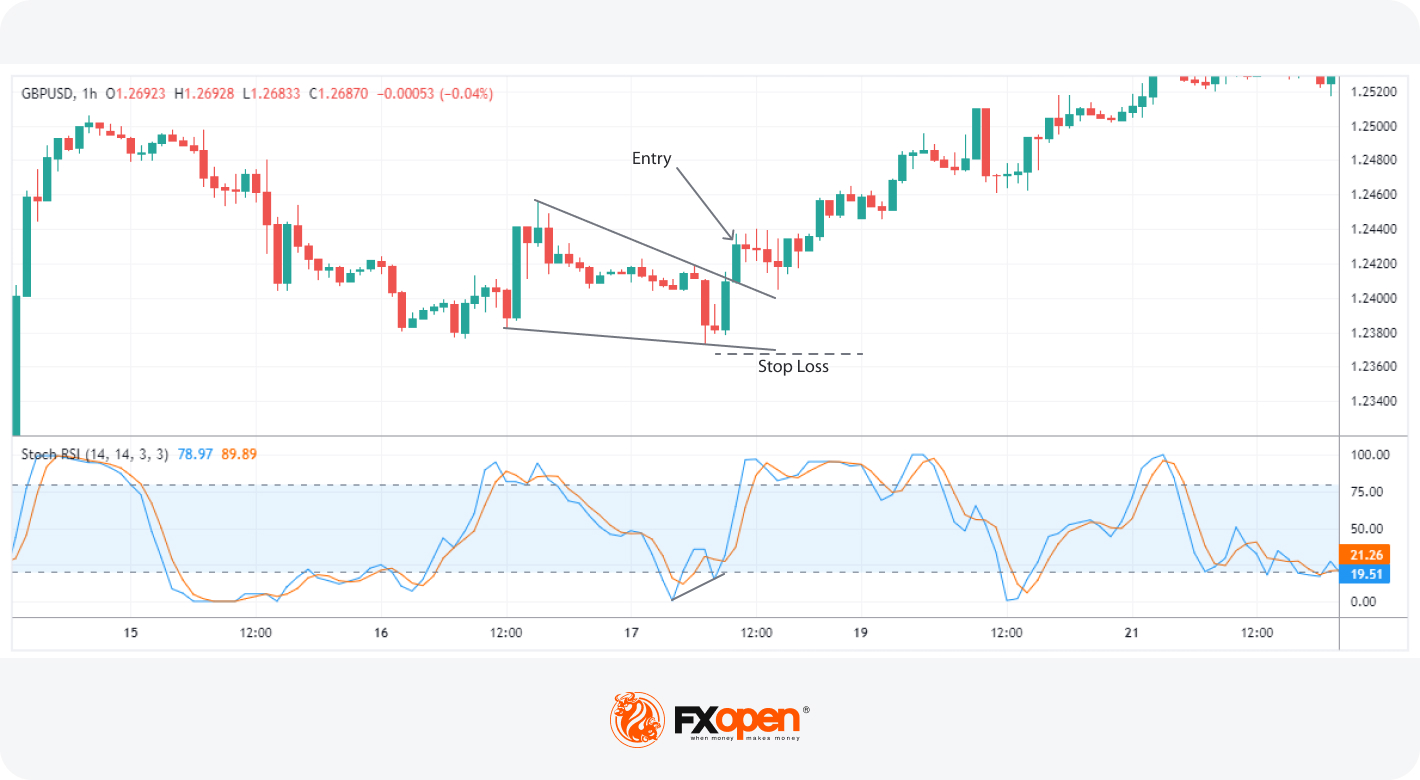
Stochastic divergence is a key technique for divergence day trading in forex, especially useful for identifying potential trend reversals. This strategy typically employs the Stochastic Oscillator with settings of 14, 3, 3.
Entry
- Traders may look for divergence scenarios where the Stochastic readings are above 80 or below 20, mirroring the RSI approach.
- This divergence is observed in conjunction with price action, forming a rising or falling wedge.
- Entry may be considered following a breakout from the wedge, which signals a potential shift in market direction.
Stop Loss
- Setting stop losses just beyond the high or low of the wedge might be an effective approach.
Take Profit
- Profit targets may be set at key support/resistance levels.
The Bottom Line
Divergence trading, coupled with the analysis of rising and falling wedges, offers a comprehensive approach to navigating the forex market. By integrating the discussed strategies with sound risk management and market analysis, traders may potentially enhance their ability to make informed decisions in the dynamic world of forex. To practically implement these strategies and explore the dynamics of forex markets, consider opening an FXOpen account, a gateway to applying these insights in real-world trading scenarios.
This article represents the opinion of the Companies operating under the FXOpen brand only. It is not to be construed as an offer, solicitation, or recommendation with respect to products and services provided by the Companies operating under the FXOpen brand, nor is it to be considered financial advice.
Stay ahead of the market!
Subscribe now to our mailing list and receive the latest market news and insights delivered directly to your inbox.


Latest articles

AUD/CAD: Months of Indecision — Is a Breakout Finally Coming?
The Australian dollar has clawed back most of its end-of-June losses, when it touched three-month lows against the greenback amid escalating Middle East tensions. Since then, sentiment has improved: the RBA's Assistant Governor Sarah Hunter signalled the board stands ready

USD/JPY: Battling at the Top of the Triangle
On 3 July, Japan's Finance Minister, Satsuki Katayama, stated that the Ministry of Finance remains in close contact with US authorities regarding developments in USD/JPY as the yen traded near its weakest level in almost 40 years. Similar verbal

Dow Jones (DJIA): Consolidation Beyond the Trend
Federal Reserve Chair Kevin Warsh testified before Congress on 14–15 July, reaffirming the Fed's commitment to bringing inflation back to target while providing no clear guidance on the future path of interest rates. Meanwhile, June inflation data came in