


What Are Falling Knives in Trading?
FXOpen
You’ve probably heard the saying “never catch a falling knife” — but what does it really mean in trading? A falling knife typically reflects panic in the markets, driven by negative news, poor earnings, or broader economic uncertainty. The phrase warns against buying an asset that’s plummeting in price, as trying to determine the exact bottom can be both risky and costly. Let’s explore what drives these moves, the risks they carry, and how to approach them with caution.
Understanding the Falling Knife Pattern
A falling knife pattern reflects a significant rapid drop in an asset’s price, including stocks, commodities, forex pairs, indices, cryptocurrencies*, and more. This situation is often driven by negative news, poor earnings reports, or broader market sell-offs.
To identify a falling knife, traders consider several characteristics. Firstly, the decline is steep and sudden, typically marked by large bearish candlesticks that may appear as a large engulfing candle on a higher timeframe. Secondly, the volume often increases as the price falls, indicating panic selling. Thirdly, technical indicators such as the Relative Strength Index (RSI) might show oversold conditions, suggesting the asset is undervalued in the short term.
Common tools used to identify falling knives include:
- Moving Averages: When short-term moving averages cross below long-term moving averages, it signals bearish market sentiment.
- Bollinger Bands: Prices breaking below the lower band can indicate a falling knife.
- Volume Analysis: Spikes in trading volume often accompany these sharp declines, confirming the intensity of the sell-off.
Recognising these patterns is crucial for traders. Misinterpreting a falling knife can lead to significant losses, as attempting to catch a falling knife—buying during the steep decline—without proper analysis can be risky. Instead, many traders wait for signs of reversal before considering an entry point.
Causes of Falling Knives
A falling knife generally occurs due to several specific catalysts, each capable of triggering a rapid and substantial decline in an asset's price. The most common reasons of falling knives are:
- economic events and news releases,
- earnings reports and company-specific issues,
- broader market conditions and trends,
- geopolitical events,
- technical factors.
Understanding these causes, including technical factors, may be helpful for traders aiming to navigate such volatile situations.
Economic Events and News Releases
One primary cause of falling knives is significant economic news. For instance, announcements of interest rate hikes by central banks can lead to widespread stock market sell-offs. Similarly, unexpected changes in economic indicators like unemployment rates, inflation, or GDP growth can trigger sharp declines. Traders react swiftly to such news, often leading to panic selling and steep price drops.
Earnings Reports and Company-Specific Issues
A falling knife stock pattern can be triggered by poor earnings reports or disappointing financial results from a company. When a company misses earnings expectations or issues negative guidance, investors may lose confidence, resulting in a rapidly falling stock. Additionally, company-specific problems such as legal issues, management scandals, or product recalls can lead to rapid price declines as investors reassess the company's prospects.
Broader Market Conditions and Trends
Broader market trends and conditions play a significant role in causing a falling knife in stocks and other assets. During periods of market volatility or bear markets, negative sentiment can spread quickly, leading to sharp declines in asset prices. For example, during the financial crisis of 2008, widespread fear and uncertainty led to massive sell-offs across various sectors. Similarly, market corrections or crashes can create environments where falling knife patterns are more likely to occur.
Geopolitical Events
Geopolitical events such as wars, political instability, or trade tensions can cause abrupt market reactions. For instance, escalating trade disputes between major economies can lead to uncertainty and fear, causing investors and traders to exit positions rapidly.
Technical Factors
Technical analysis also plays a crucial role in falling knife patterns. The technical factors include:
- Breaking Support Levels: When an asset's price falls below critical support levels, it can trigger further selling as traders consider it as a sell signal.
- Overbought/Oversold Conditions: Oscillators like the Relative Strength Index (RSI) showing overbought conditions can precede a falling knife as prices correct sharply. At the same time, the RSI may enter the oversold area during the falling knife pattern.
- Bearish Chart Patterns: Patterns such as head and shoulders, double tops, or descending triangles can signal potential sharp declines, leading to falling knife scenarios.
Risks Associated with the Falling Knife
Trading falling knives carries significant risks, primarily due to the rapid nature of the price declines. Understanding these risks is crucial for traders aiming to navigate such volatile situations.
Potential for Significant Losses
The most apparent risk is the potential for substantial financial losses. When an asset's price plummets, catching the falling knife can result in buying at prices that continue to drop, leading to immediate and severe losses.
False Bottoms and Dead Cat Bounces
Traders may mistakenly interpret temporary slowing fall or minor recoveries as the end of the decline, only to face further drops. These false bottoms and dead cat bounces can trap traders in losing positions.
Increased Volatility
Falling knives are often accompanied by heightened market volatility, making it challenging to analyse short-term price movements. This volatility can result in rapid and unexpected changes in asset prices, complicating risk management.
Psychological Challenges
The psychological impact of trading falling knives should not be underestimated. The stress and emotional strain of dealing with sharp losses can lead to irrational decision-making, such as holding onto losing positions for too long or making impulsive trades.
Technical Analysis Limitations
While technical indicators may help identify potential entry points, they are not foolproof. The rapid and severe nature of falling knives can render technical analysis less reliable, as price movements may not follow traditional patterns.
Liquidity Issues
During sharp declines, liquidity can dry up, leading to wider spreads and slippage. This makes it harder to execute trades at desired prices, potentially exacerbating losses.
Examples of Falling Knife Events
Now, let’s take a look at a couple of falling knife examples. To start identifying your own falling knives, you may head over to FXOpen’s TickTrader platform to explore real-time charts across different asset classes.
Onset of the Coronavirus Pandemic and the Nasdaq 100
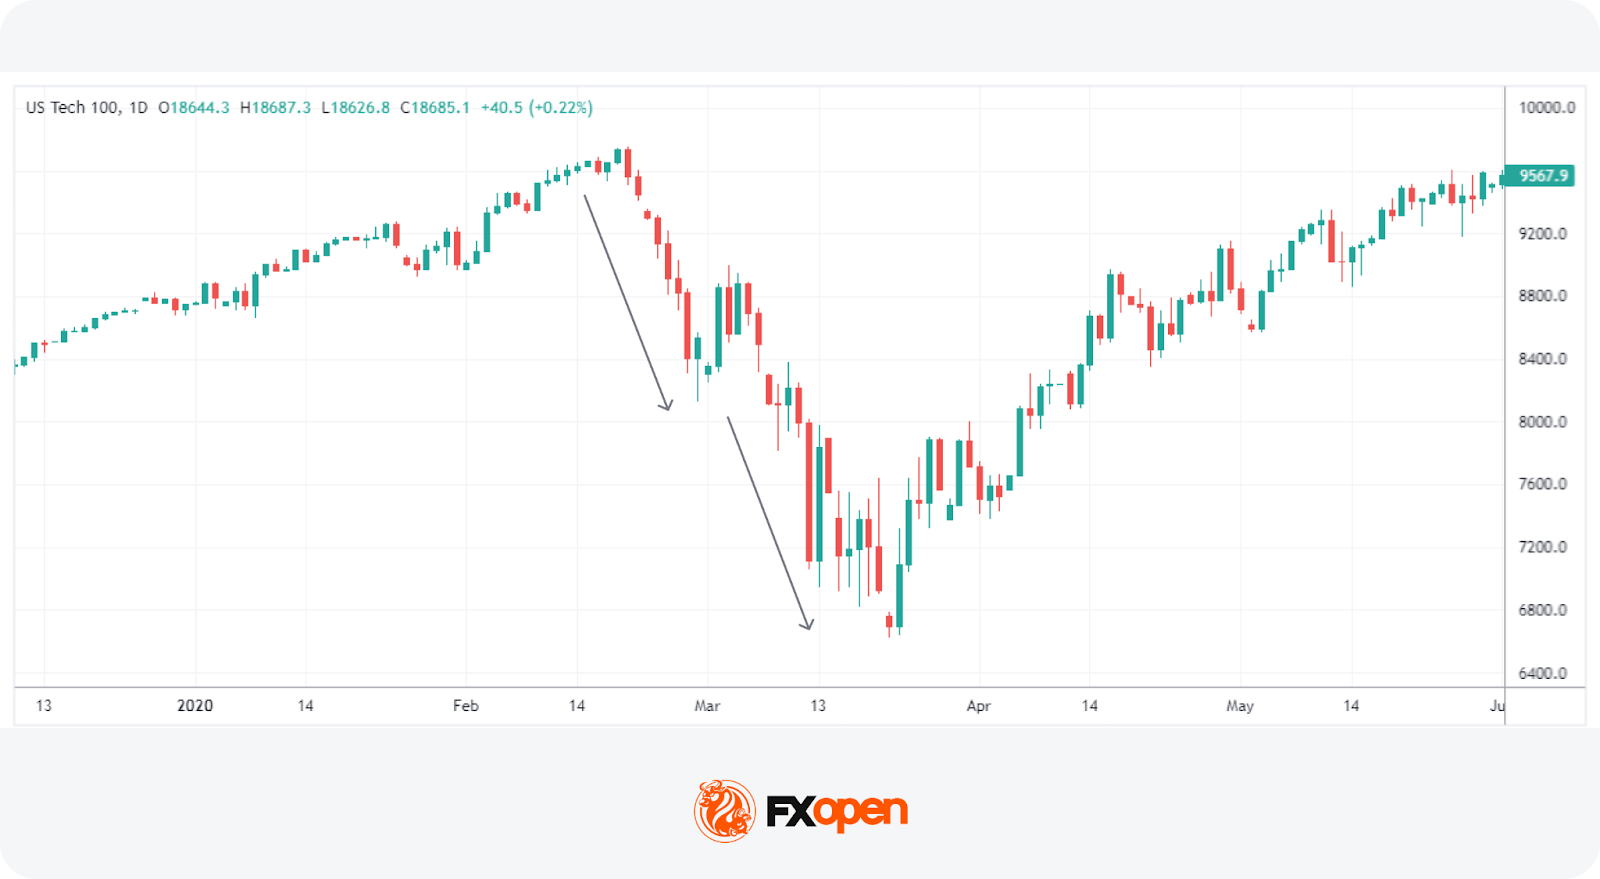
In early 2020, the onset of the coronavirus pandemic triggered a dramatic fall in global financial markets. The Nasdaq 100, heavily weighted with speculative tech stocks, experienced a sharp decline as investors reacted to the uncertainty and potential economic impact of the pandemic.
From mid-February to late March 2020, the Nasdaq 100 dropped by over 30%. This steep decline represented a classic falling knife pattern, characterised by rapid sell-offs and increased market volatility over the course of several weeks. Traders who attempted to buy into the market too early faced significant losses as the market continued to fall before eventually recovering later in the year.
EUR/USD After Strong US Inflation Data
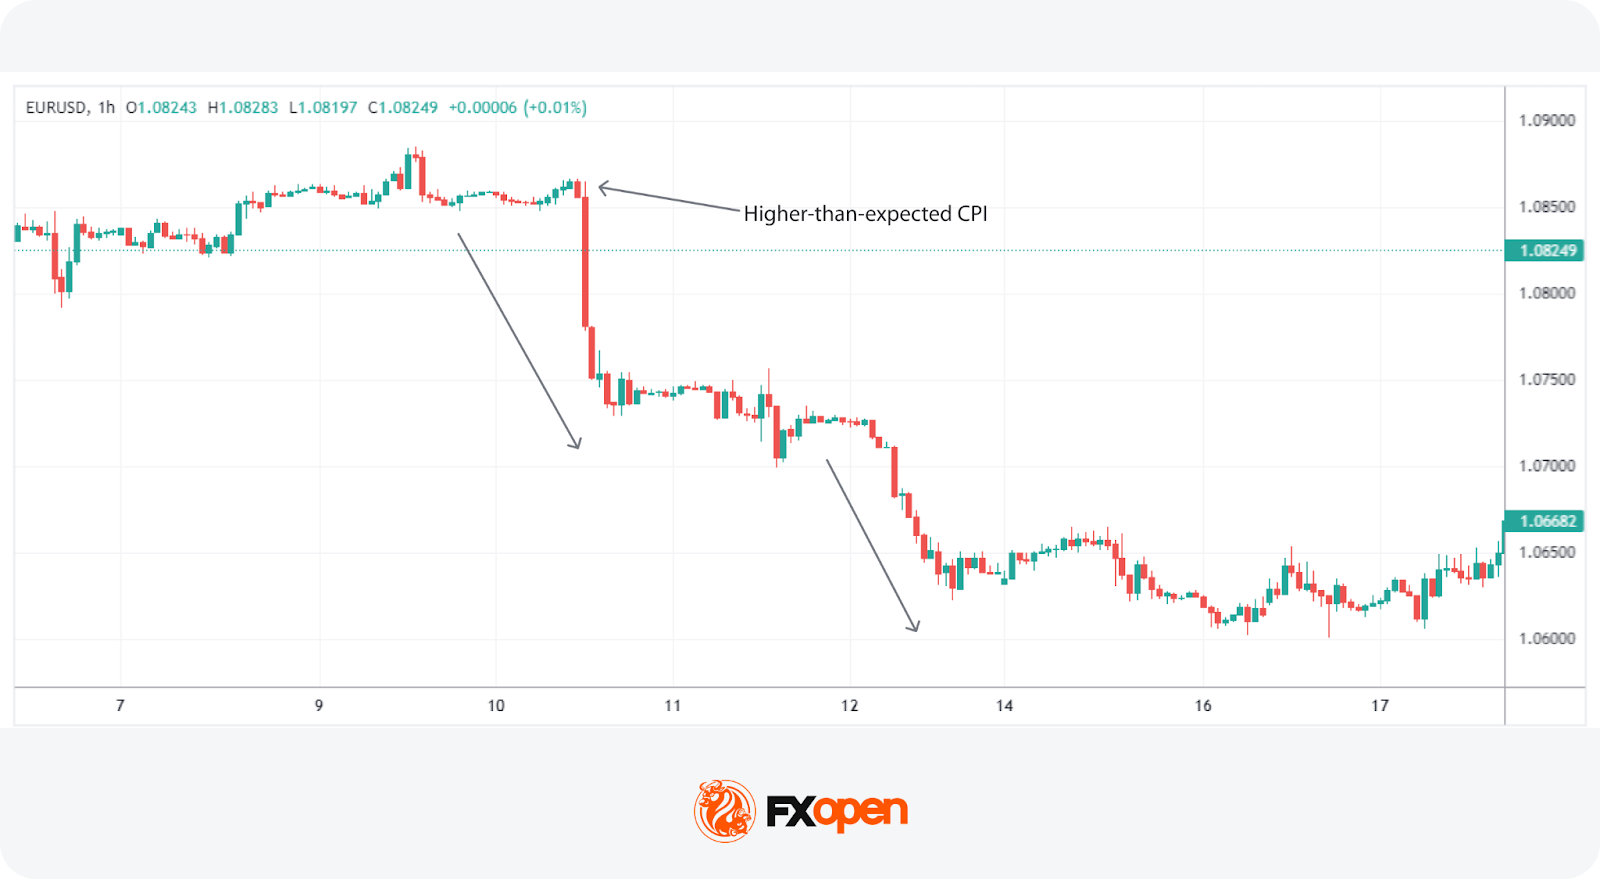
On April 10, 2024, the release of March US inflation data led to a falling knife event in the EUR/USD currency pair. Traders had been closely monitoring the Consumer Price Index (CPI) report, anticipating that a lower-than-forecast reading would prompt the Federal Reserve to lower interest rates later in the year.
The forecast was set at 3.4%, with a lower or at-forecast figure expected to weaken the dollar. Instead, the headline CPI YoY reading came in exactly at 3.5%, defying expectations. This unexpected data triggered a rally in the dollar and a sharp sell-off in EUR/USD. The pair plummeted rapidly, and the decline persisted until the end of the trading week, illustrating how sudden economic data releases can lead to sharp and sustained price drops.
Strategies for Trading Falling Knives
Understanding the catalyst behind a falling knife is crucial for determining whether it’s likely to rebound soon or persist as a trend. Events that cause fundamental repricing, such as poor earnings data, significant or unexpected news/economic releases, or unique risk events like currency intervention or financial crises, often lead to prolonged falling knives.
In contrast, temporary sharp corrections might be due to overreactions to already priced-in news or transient market fears. Recognising these catalysts may help traders decide whether to take a position or wait for volatility to subside.
Additionally, the timeframe of the falling knife provides valuable context. A falling knife on a 5-minute chart could indicate a sharp intraday decline, potentially recovering before the trading day ends. Conversely, on a 4-hour or daily chart, a sharp decline may suggest a continued downtrend over several days or weeks. Traders can use this information to look for short trades on lower timeframes or prepare for longer-term moves.
Common Strategies Traders Use
The insights gained from analysing market conditions may help traders decide whether to short the falling knife or stay out of the market and wait for a bottom.
Shorting the Falling Knife
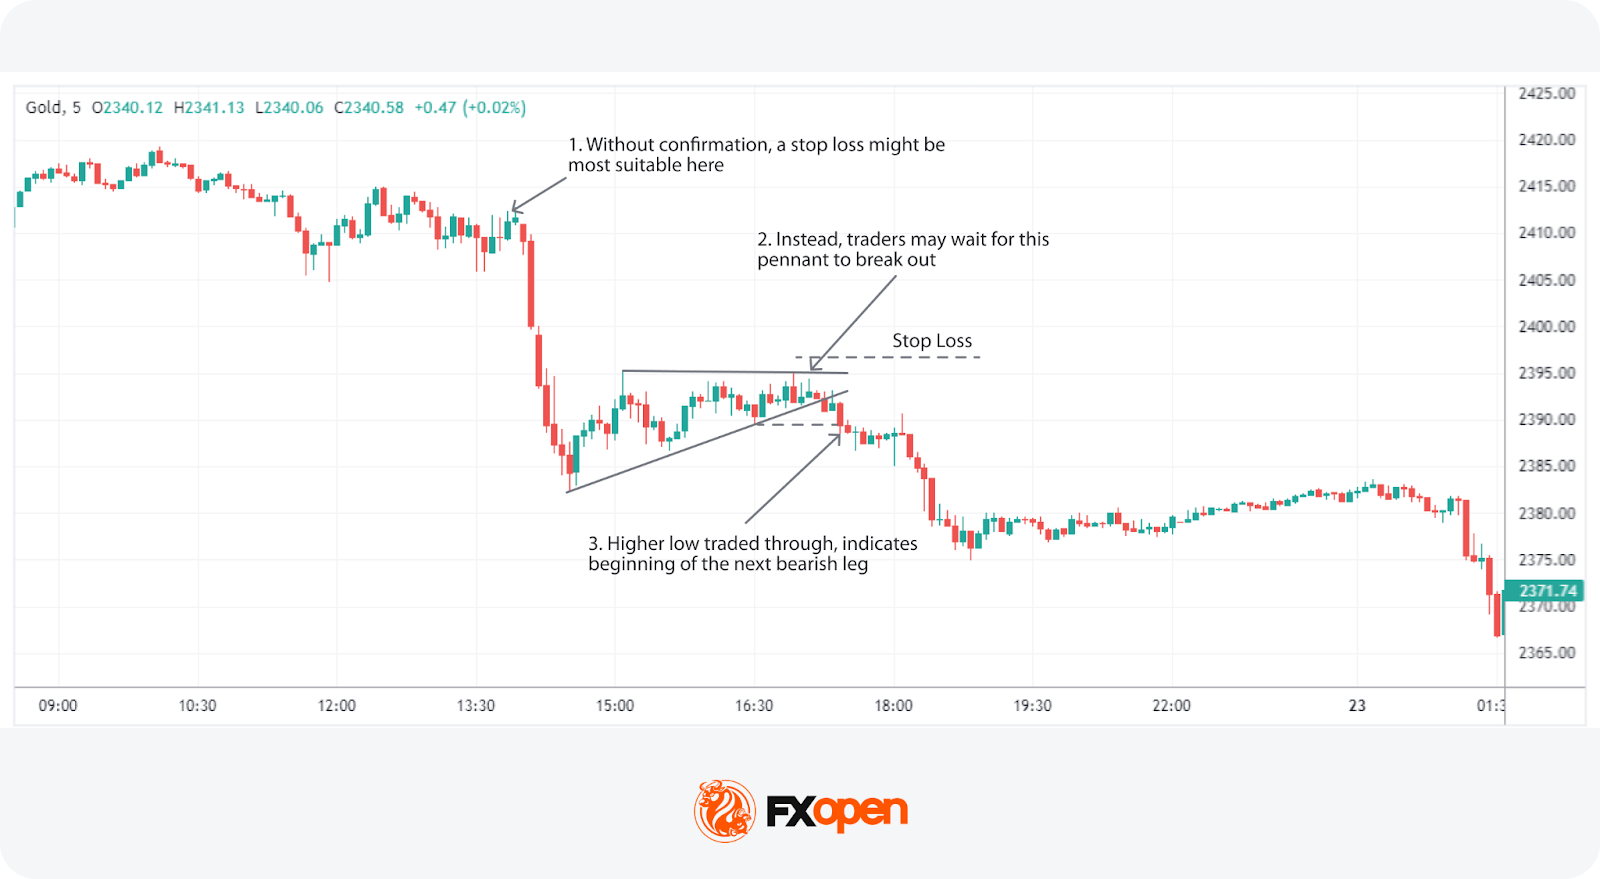
Traders looking to short a falling knife exercise caution. Increased volatility during sharp declines can make it difficult to set appropriate stop-loss levels without a sub-par risk/reward ratio.
The entry can be found during a pullback. As some traders think the price is bottoming out, their stop losses being triggered as the price continues to decline can fuel another leg lower. Traders can look for breakouts from bearish chart patterns like rising wedges, bear flags, or bear pennants.
Alternatively, waiting for the bullish structure of the pullback (higher highs and higher lows) to break down into a lower low and lower high can indicate the next leg lower is underway. This approach offers traders confirmation that the knife is continuing to fall and an appropriate place to set a stop loss above the pullback’s high.
Buying After a Falling Knife
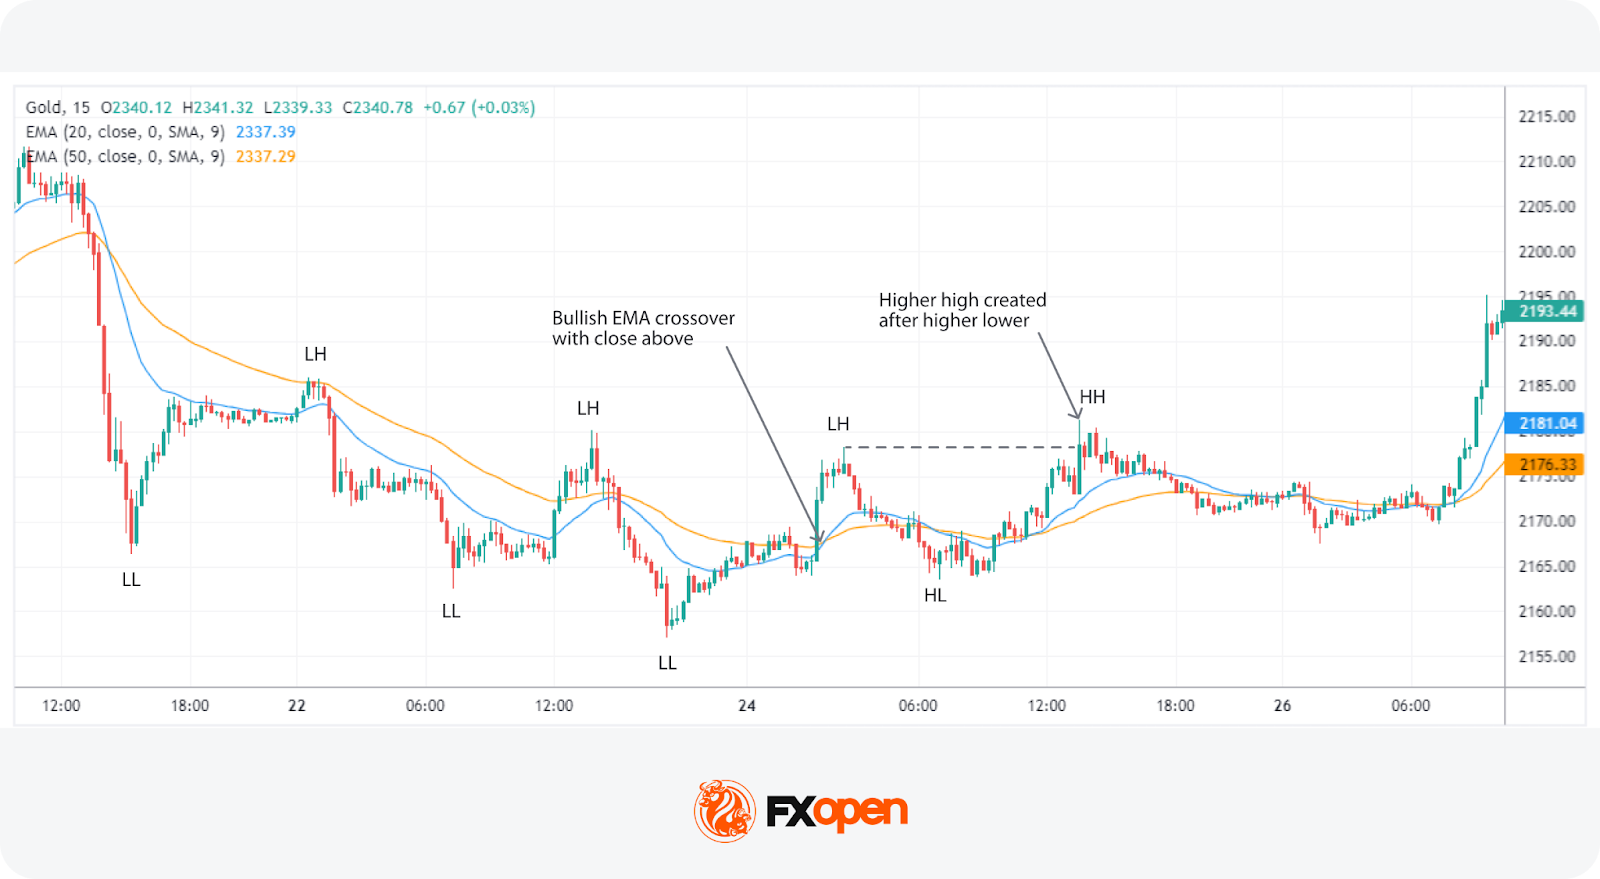
For those looking to catch the bottom, confirmation is important. Using a pair of moving averages, such as 20-period and 50-period EMAs, might help. When the 20-period EMA crosses above the 50-period EMA, and the price closes above both, it suggests the downtrend might be over. However, momentum indicators like RSI and MACD can falsely signal market turns during steep declines, but they may have some value on higher timeframes.
Generally speaking, one of the strategies for catching a falling knife is to wait for the price to break above the previous lower high of the downtrend. This would demonstrate that the market has been able to break above a point at which it previously found resistance, allowing traders to potentially switch their bias to bullish and seek entry points.
The Role of Patience and Discipline in Trading Falling Knives
Patience and discipline are paramount when trading falling knives. Impulsive trades driven by the fear of missing out can lead to significant losses. Traders are required to wait for clear signs of trend reversal or continuation before entering a trade. This involves adhering to predefined strategies and not deviating due to emotional reactions to volatile market movements.
Likewise, maintaining discipline in setting and following stop-loss levels, adhering to risk management principles, and avoiding premature entries can support traders when entering a market.
The Bottom Line
Falling knives are an inevitable part of financial markets, often signalling uncertainty, panic, or correction. Trying to catch one is rarely worth the risk. Navigating such moves takes careful analysis, discipline, and strong risk management.
If you want to explore over 700 markets, you may consider opening an FXOpen account to trade with tight spreads and low commissions
FAQ
What Is a Falling Knife in Trading?
A falling knife in trading refers to a rapid and significant decline in an asset's price, often triggered by negative news, poor earnings reports, or broader market sell-offs. This sharp drop can be volatile and difficult to analyse, making it challenging for traders to time their entries and exits.
Can Traders Try to Catch a Falling Knife?
Catching a falling knife bears high risk. The theory states traders shouldn’t try to enter a market in such a situation. The rapid decline in price can continue further than anticipated, leading to significant losses. Therefore, traders wait for signs of market reversal before considering an entry.
How May Traders Catch a Falling Knife?
Catching a falling knife involves identifying potential reversal points through technical analysis. Traders often wait for confirmation, such as a break above previous resistance levels or a moving average crossover. Patience and strict risk management, including setting tight stop-loss orders, may support traders when attempting this strategy.
What Is a Falling Knife in Crypto*?
In the crypto* market, a falling knife refers to a sudden and steep decline in the price of a cryptocurrency*. This can be triggered by regulatory news, security breaches, or market sentiment shifts. Due to cryptocurrencies'* high volatility, falling knives can be particularly severe and difficult to analyse.
*Important: At FXOpen UK, Cryptocurrency trading via CFDs is only available to our Professional clients. They are not available for trading by Retail clients. To find out more information about how this may affect you, please get in touch with our team.
This article represents the opinion of the Companies operating under the FXOpen brand only. It is not to be construed as an offer, solicitation, or recommendation with respect to products and services provided by the Companies operating under the FXOpen brand, nor is it to be considered financial advice.
Stay ahead of the market!
Subscribe now to our mailing list and receive the latest market news and insights delivered directly to your inbox.


Latest articles

Amazon Analysis: Strong Earnings Coincide with a Breakout from the Correction
On 30 July, Amazon.com reported its financial results for the second quarter of 2026, significantly exceeding market expectations. Revenue rose 20% year-on-year to $200.6 billion, compared with the consensus forecast of around $196.5 billion. The main growth

GBP/USD and EUR/GBP Await Key Bank of England Decision
The pound strengthened following the outcome of the US Federal Reserve meeting, where the central bank, as expected, kept interest rates unchanged. However, the Fed did not provide the market with clear signals of an imminent shift towards rate cuts,

Microsoft Analysis: Earnings Beat Expectations
On 29 July 2026, Microsoft reported its results for the fourth quarter of fiscal year 2026. Revenue reached $90 billion, up 18% year-on-year, while adjusted earnings per share came in at $4.74, comfortably ahead of analysts' expectations of $4.