


FXOpen

Scalping on the 1-minute chart is about reacting to short bursts of order flow, momentum shifts, and volatility as they unfold in real time. Execution speed, clarity, and repeatable rules matter more than broad narratives or longer-term bias. This article looks at four 1-minute trading strategies that combine price behaviour with common technical tools, outlining how many traders structure entries, exits, and trade management when working on ultra-short timeframes.
Takeaways
- Scalping is a trading approach that focuses on short-lived price moves on small timeframes (from 1-minute to 15-minute charts), with trades managed over seconds or minutes and outcomes shaped by execution, spread, and timing rather than extended market moves.
- The article outlines four approaches: VWAP with MACD, Keltner Channels with RSI, ALMA with Stochastic, and RSI with Bollinger Bands. We show how traders frame entries and exits within 1-minute trading strategies.
- Volume Weighted Average Price (VWAP), Moving Average Convergence Divergence (MACD), Relative Strength Index (RSI), Bollinger Bands, Keltner Channels, Arnaud Legoux Moving Average (ALMA), and Stochastic Oscillator are common 1-minute scalping indicators used to track momentum, volatility, and short-term structure.
- Frequent trading increases exposure to costs and execution variance, so predefined stops, take-profit targets, and session rules may help manage your trades.
1-Minute Scalping Trading: Basics
1-minute scalping is a fast-paced trading style focusing on taking advantage of small price movements within a minute timeframe. Traders using this approach rely on 1-minute charts to make quick, multiple trades throughout the trading session. The primary goal is to accumulate potential small gains that might add up to larger returns over time.
A scalp trading strategy requires a solid understanding of technical analysis and market conditions. Scalpers typically use indicators, price action patterns, and trend analysis to identify short-term market movements and potential entry and exit points. The rapid nature of 1-minute scalping demands precision and discipline, as even a slight delay can impact the trade outcome.
One of the advantages of 1-minute scalping is the ability to generate frequent trades, which can be particularly appealing during volatile market conditions. However, it also comes with higher risks due to the speed and frequency of trades, meaning risk management plays a significant role.
Scalpers should also be aware of transaction costs, as frequent trading can lead to significant fees, which may erode potential returns. Choosing a broker with low commissions, tight spreads, and fast execution speeds may help when implementing a scalping forex strategy.
Four 1-Minute Scalping Strategies
Now, let’s take a closer look at four 1-minute trading strategies. To apply these strategies, see how they work in practice, and access each of these 1-minute scalping indicators, you can consider following along on FXOpen’s TickTrader trading platform.
Strategy 1: VWAP + MACD
Indicators Used
- VWAP (Volume Weighted Average Price): VWAP calculates the average price a security has traded at throughout the day, based on both volume and price. It may help traders determine the trend and identify potential support and resistance levels.
- MACD (Moving Average Convergence Divergence): MACD is an indicator that visualises the relationship between two moving averages. MACD settings for a 1-minute chart are standard: the MACD line is derived from the difference between the 12-period and 26-period exponential moving averages (EMA), while the signal line is a 9-period EMA of the MACD line.
VWAP and MACD work well together by providing both trend and momentum analysis. VWAP is used to determine the overall trend and significant price levels, while MACD offers insights into momentum changes. This combination may help traders set entries by confirming trends and potential reversals.
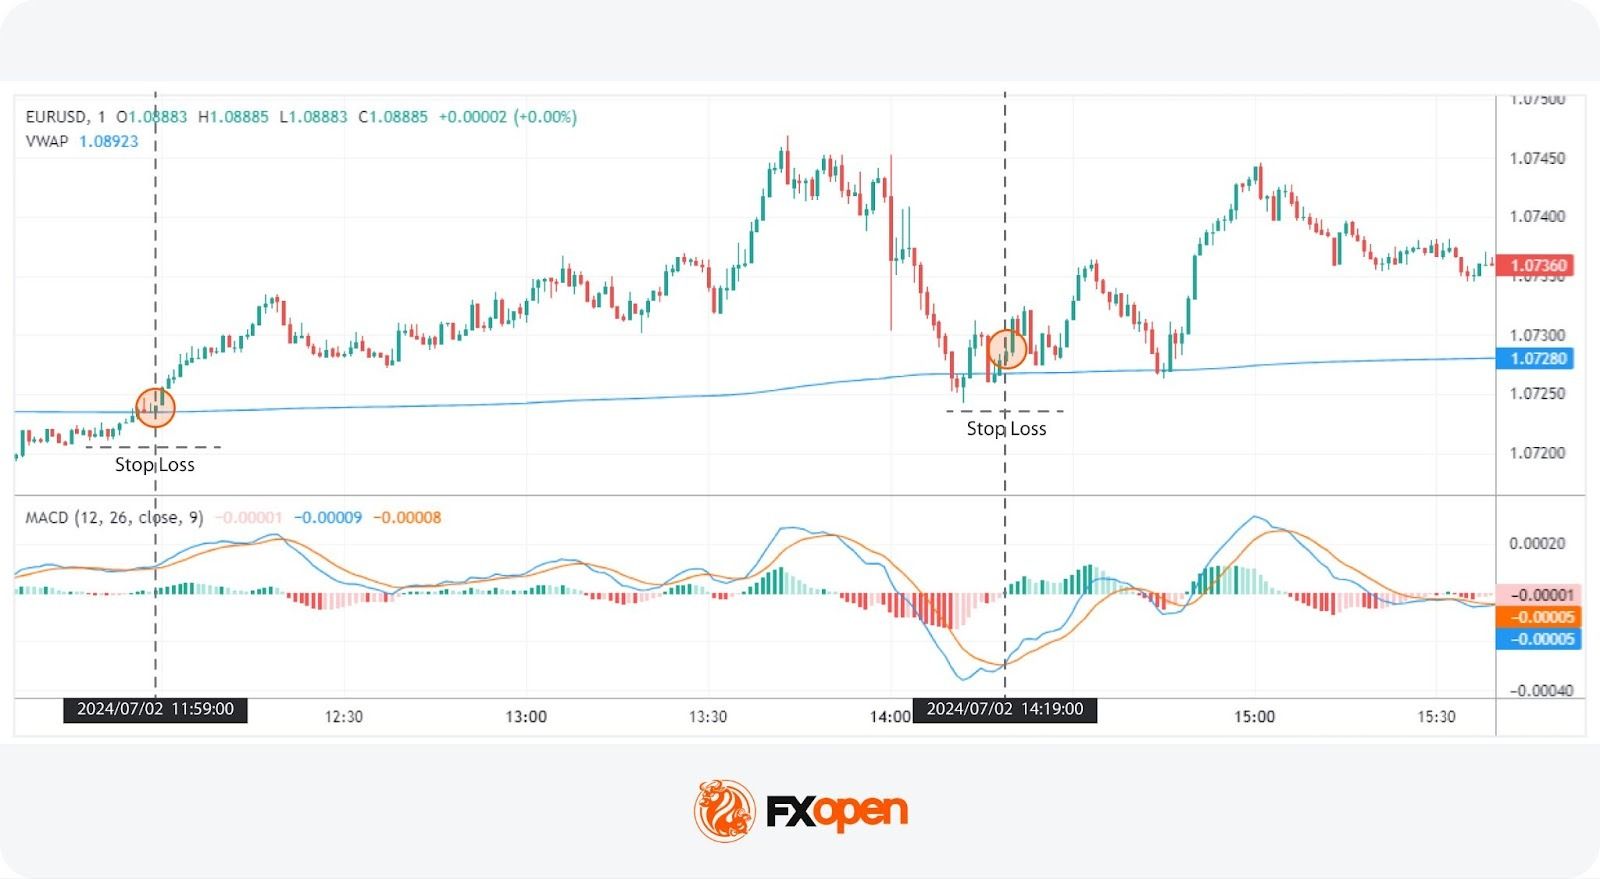
Entry
- Traders typically look for the price to close through the VWAP, with the MACD turning from positive to negative or vice versa. This coincides with the signal line crossing over the MACD line.
- Alternatively, another common entry point is when the price uses the VWAP as a level of support or resistance, confirmed by the MACD turning from positive to negative or vice versa.
These triggers will likely occur within a few candles of each other, typically within 4 or 5 candles.
Stop Loss
- Stop losses might be set just beyond a recent high or low swing point.
Take Profit
- Traders could place take-profit orders when the signal line crosses the MACD line in the opposite direction, and the histogram switches from positive to negative or vice versa. This approach allows traders to take advantage of momentum shifts and potentially lock in gains as the trend changes.
- However, some may prefer to exit at a significant support or resistance level in order to maximise potential gains.
Strategy 2: Keltner Channels + RSI
Indicators Used
- Keltner Channels: Volatility-based bands plotted above and below an exponential moving average. The channels are typically set to two average true range (ATR) values away from the EMA. They are used by traders to identify overbought and oversold conditions and potential breakouts.
- RSI (Relative Strength Index): A momentum oscillator, introduced by J. Welles Wilder in his book New Concepts in Technical Trading Systems, that gauges the rate and extent of price changes. It ranges between 0 and 100, where readings above 70 signal overbought conditions, and readings below 30 indicate oversold conditions. RSI can also indicate bullishness when it crosses above 50 and vice versa.
The Keltner Channels, which offer insights into breakouts, and the RSI, which gauges momentum, may support traders in finding entry points on the 1-minute chart. It is widely used not only in the forex market but as a 1-minute gold scalping strategy, given the high volatility of gold.
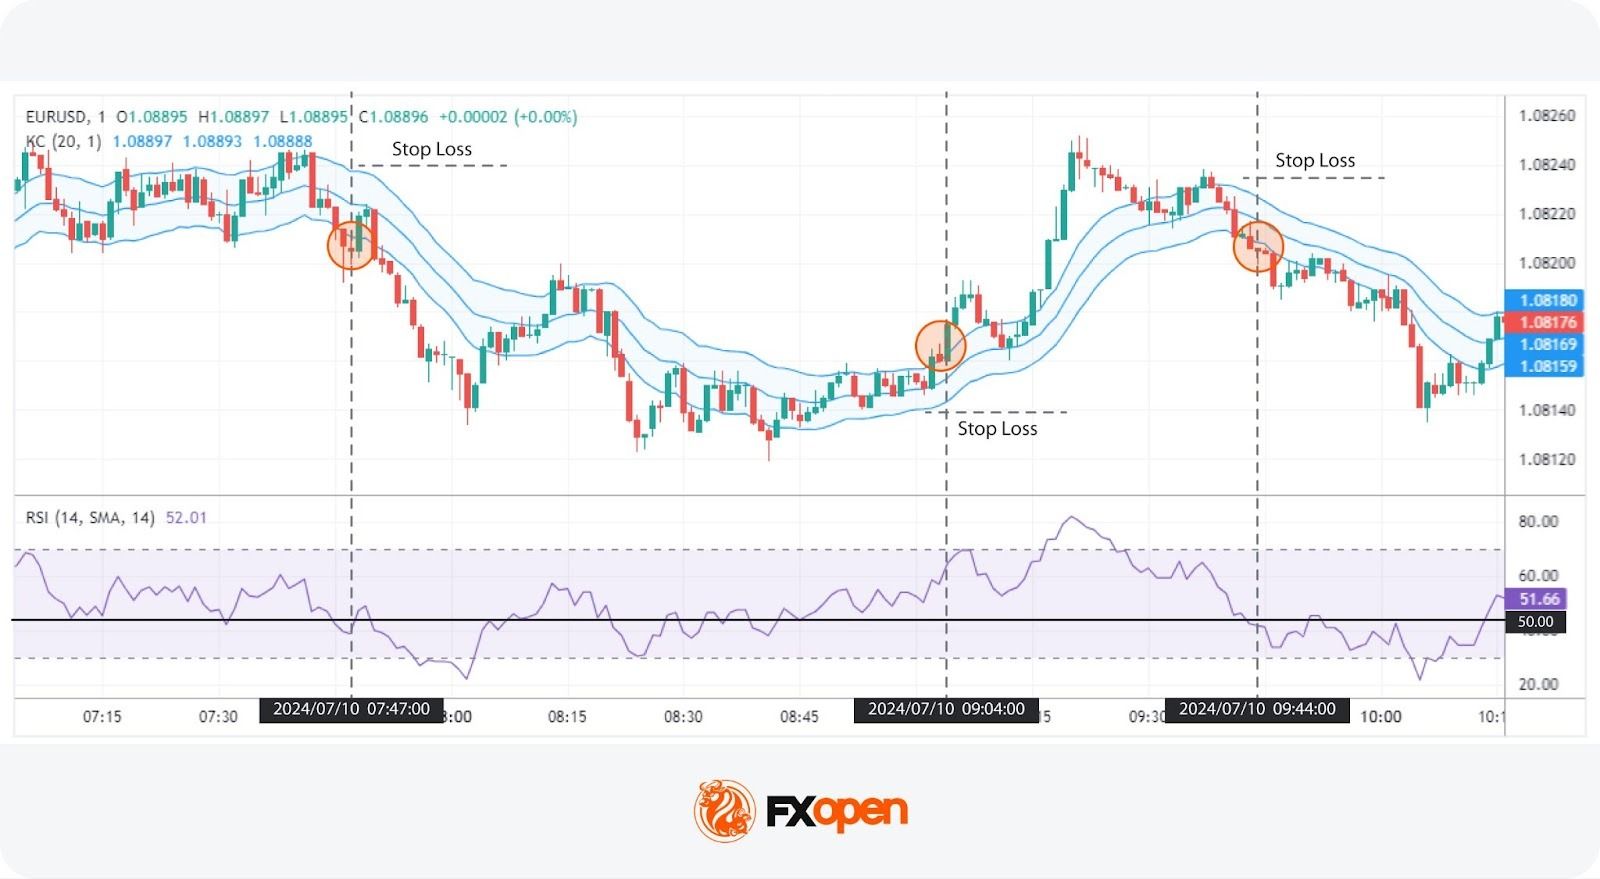
Entry
- Traders often look for two or more closes outside of the Keltner Channel and ideally strong and/or consecutive green (bullish) or red (bearish) candles.
- This is confirmed by the RSI recently breaking above 50 for bullish signals or below 50 for bearish signals.
The combination of strong price action and momentum change may help traders identify potential trend continuations.
Stop Loss
- Stop losses might be set beyond the opposite side of the Keltner Channel.
- For a higher risk-reward ratio, traders might place stop losses beyond a nearby swing candle.
Take Profit
- Traders might set take-profit orders when the price crosses back beyond the Keltner Channel's midpoint or reaches the opposite side of the channel, indicating a potential exhaustion of the current move.
- Alternatively, profit targets might be placed when RSI moves beyond 70 (overbought) or below 30 (oversold), signalling potential reversals in price direction.
Strategy 3: ALMA + Stochastic
Indicators Used
- ALMA (Arnaud Legoux Moving Average): ALMA is a moving average that aims to smooth price data while reducing lag. The settings used are 21 for the window size, 0.85 for the offset, and 6 for the sigma. This combination may support traders when identifying the trend.
- Stochastic Oscillator: The Stochastic measures the location of the close relative to the high-low range over a set period. Settings of 21, 1, 3 are used to capture momentum and potential reversal points. A figure above 80 signals overbought conditions, while below 20 indicates the opposite.
Combining ALMA with the Stochastic Oscillator allows traders to identify potential reversals in trends. ALMA provides a smoothed view of the price trend, while the Stochastic Oscillator offers momentum-based signals that are expected to help confirm the strength of a move.
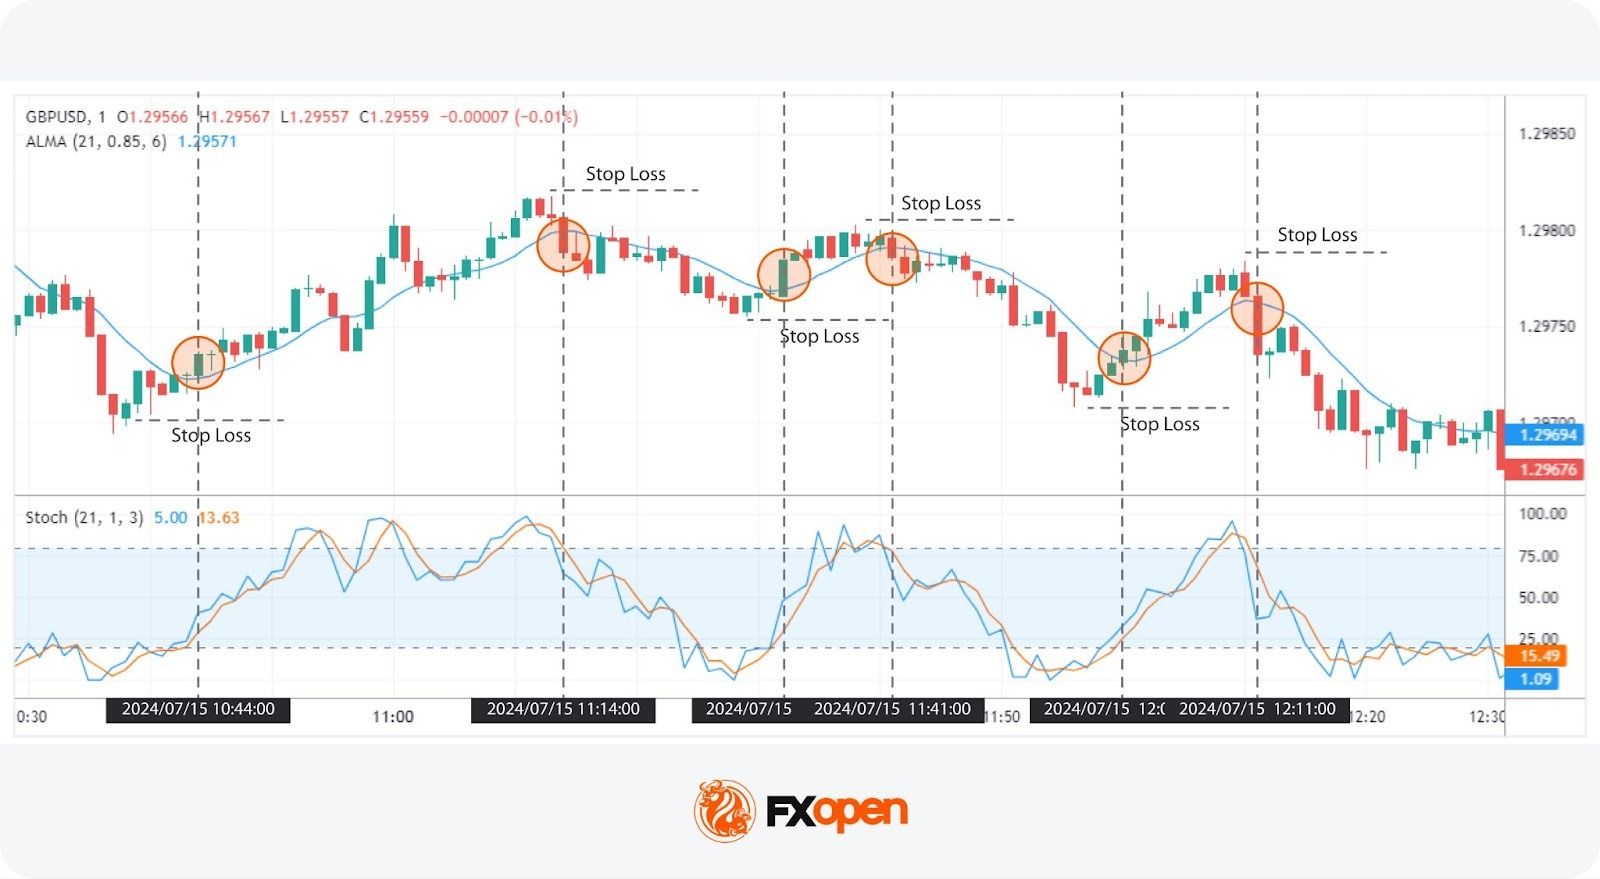
Entry
- Traders look for the price to close through the ALMA, ideally with a strong close, which suggests a potential trend change.
- This is confirmed by the Stochastic Oscillator crossing below 80 for a bearish signal or above 20 for a bullish signal, indicating momentum alignment with the trend.
Note that price may fluctuate above and below the ALMA in ranging conditions and produce false signals.
Stop Loss
- Stop losses might be set beyond the nearest swing point.
Take Profit
- Traders might place take-profit orders when the Stochastic reaches the opposite territory (e.g., from above 80 to below 20 for a bearish move), indicating a potential exhaustion of the current trend.
- Alternatively, profit targets might be set at identified areas of support or resistance, where price action historically reacts, providing a logical exit point.
Strategy 4: RSI + Bollinger Bands
Indicators Used
- RSI (Relative Strength Index): For this 1-minute strategy, RSI settings are a length of 4, with overbought and oversold boundaries at 80 and 20, respectively. These settings are popular when identifying short-term overbought and oversold conditions.
- Bollinger Bands: Bollinger Bands settings for a 1-minute chart are a 20-period simple moving average (middle band) and two outer bands set at a standard deviation level of 2 from the middle band. They may help determine periods of high and low volatility as well as potential reversal points.
The combination of RSI and Bollinger Bands allows traders to identify potential short-term reversals in the market. Bollinger Bands provide a dynamic range for price action, while the RSI confirms overbought or oversold conditions. This may support traders when identifying entry and exit points.
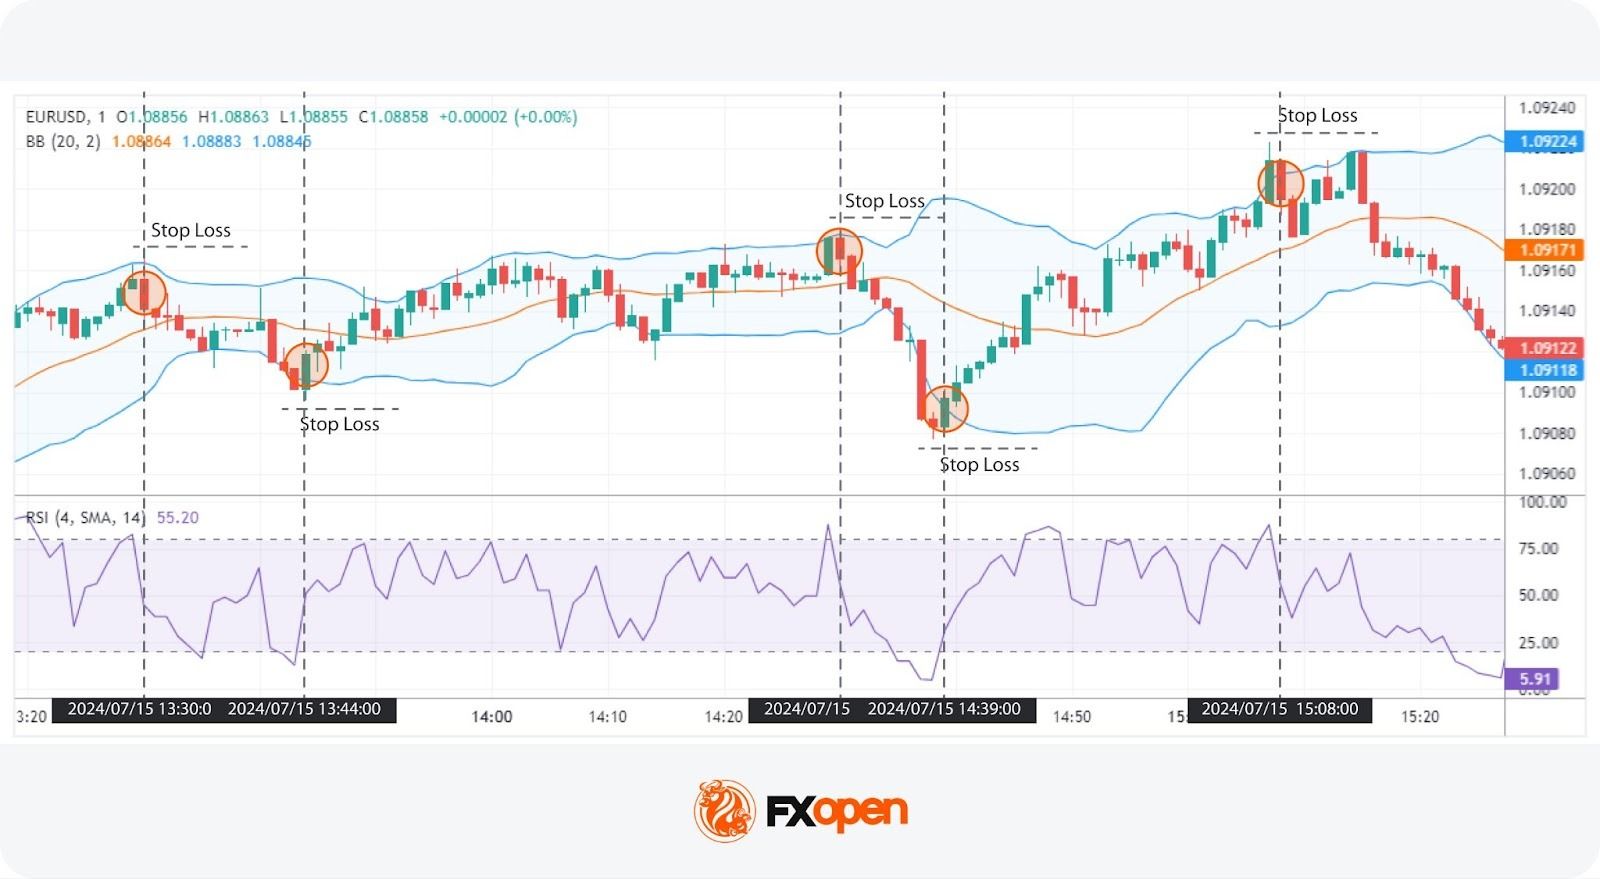
Entry
- Traders often enter when the RSI crosses below 80 from above or above 20 from below, signalling an exit from potential overbought or oversold conditions.
- This entry is confirmed when the price is also touching or breaching the Bollinger Band, indicating the likelihood of a short-term reversal.
Stop Loss
- Stop losses might be set beyond a nearby swing point or just outside the Bollinger Band, giving the trade room to develop.
Take Profit
- Traders might place take-profit orders when the price touches the opposing Bollinger Band, suggesting a potential end to the current price move.
- Alternatively, some might set take-profit orders when the RSI crosses into the opposing overbought or oversold territory, indicating a shift in momentum.
The Bottom Line
Mastering a 1-minute trading strategy requires a combination of speed, precision, and disciplined risk management. The usefulness of a trading strategy may depend on several factors, including a thorough understanding of technical indicators, adherence to strict trading rules, and the ability to adapt to changing market conditions in real time.
If you want to develop your own trading approach and learn market behaviour in different conditions, you may consider opening an FXOpen account. FXOpen provides access to over 700 instruments, with commissions starting from $1.50 and spreads from 0.0 pips (additional fees may apply).
FAQ
What Is the 1-Minute Timeframe Trading Strategy?
The 1-minute timeframe trading strategy involves making multiple trades within a single minute, aiming to capture small price movements. Traders use a 1-min scalping strategy when they rely heavily on technical indicators and prefer to act immediately.
Which Indicator Is Popular for a One-Minute Scalping Strategy?
There is no single 1-minute scalping strategy indicator; it comes down to preference and experience. However, popular choices include the Moving Average Convergence Divergence (MACD), Relative Strength Index (RSI), Bollinger Bands, and the Volume Weighted Average Price (VWAP). Many traders combine several indicators to confirm signals.
What Is the Popular Timeframe for Scalping Crypto*?
The timeframe for crypto* scalping depends on the trader's preference and strategy. While a 1-minute crypto* scalping strategy is based on numerous rapid trades, some traders prefer slightly longer timeframes like the 5-minute or 15-minute charts to balance speed and cryptocurrency* market noise.
What Is the Stochastic Setting for Scalping 1-Minute Strategy?
For 1-minute scalping, the Stochastic Oscillator is typically set to the standard settings of 14, 1, 3. These settings may help capture short-term momentum changes, providing timely signals for entry and exit points. Adjustments can be made based on the trader's specific strategy and market conditions.
*Important: At FXOpen UK, Cryptocurrency trading via CFDs is only available to our Professional clients. They are not available for trading by Retail clients. To find out more information about how this may affect you, please get in touch with our team.
This article represents the opinion of the Companies operating under the FXOpen brand only. It is not to be construed as an offer, solicitation, or recommendation with respect to products and services provided by the Companies operating under the FXOpen brand, nor is it to be considered financial advice.
Stay ahead of the market!
Subscribe now to our mailing list and receive the latest market news and insights delivered directly to your inbox.


Latest articles

Market Insights with Gary Thomson: Where Are Oil, Gas & Global Indices Heading?
In this video, we’ll explore the key economic events and market trends, shaping the financial landscape. Get ready for insights into financial markets to help you navigate the week ahead. Let’s dive in!
In this episode of Market

Netflix (NFLX) Shares Pull Back After a 30% Surge
On 21 January, while analysing the NFLX chart, we:
→ identified a descending channel and a resistance zone around the $100 level;
→ noted that Netflix shares were showing a sustained downtrend. Selling pressure had been triggered primarily by reports of a

US Dollar Index (DXY) Rises Above the 100 Level
Today the US Dollar Index (DXY) climbed above the psychological 100 mark for the first time in 2026, supported by a tense fundamental backdrop, with the military conflict in the Middle East acting as the main driver.
→ Financial market participants