


FXOpen

BTC/USD
The price of Bitcoin has been moving to the downside from Sundays high and decreased by 3.76% coming from $9488 to $9132 where it is currently being traded. Sunday’s high was a retest of last week’s high made on Thursday and with the price falling to exceed it we have seen a retracement.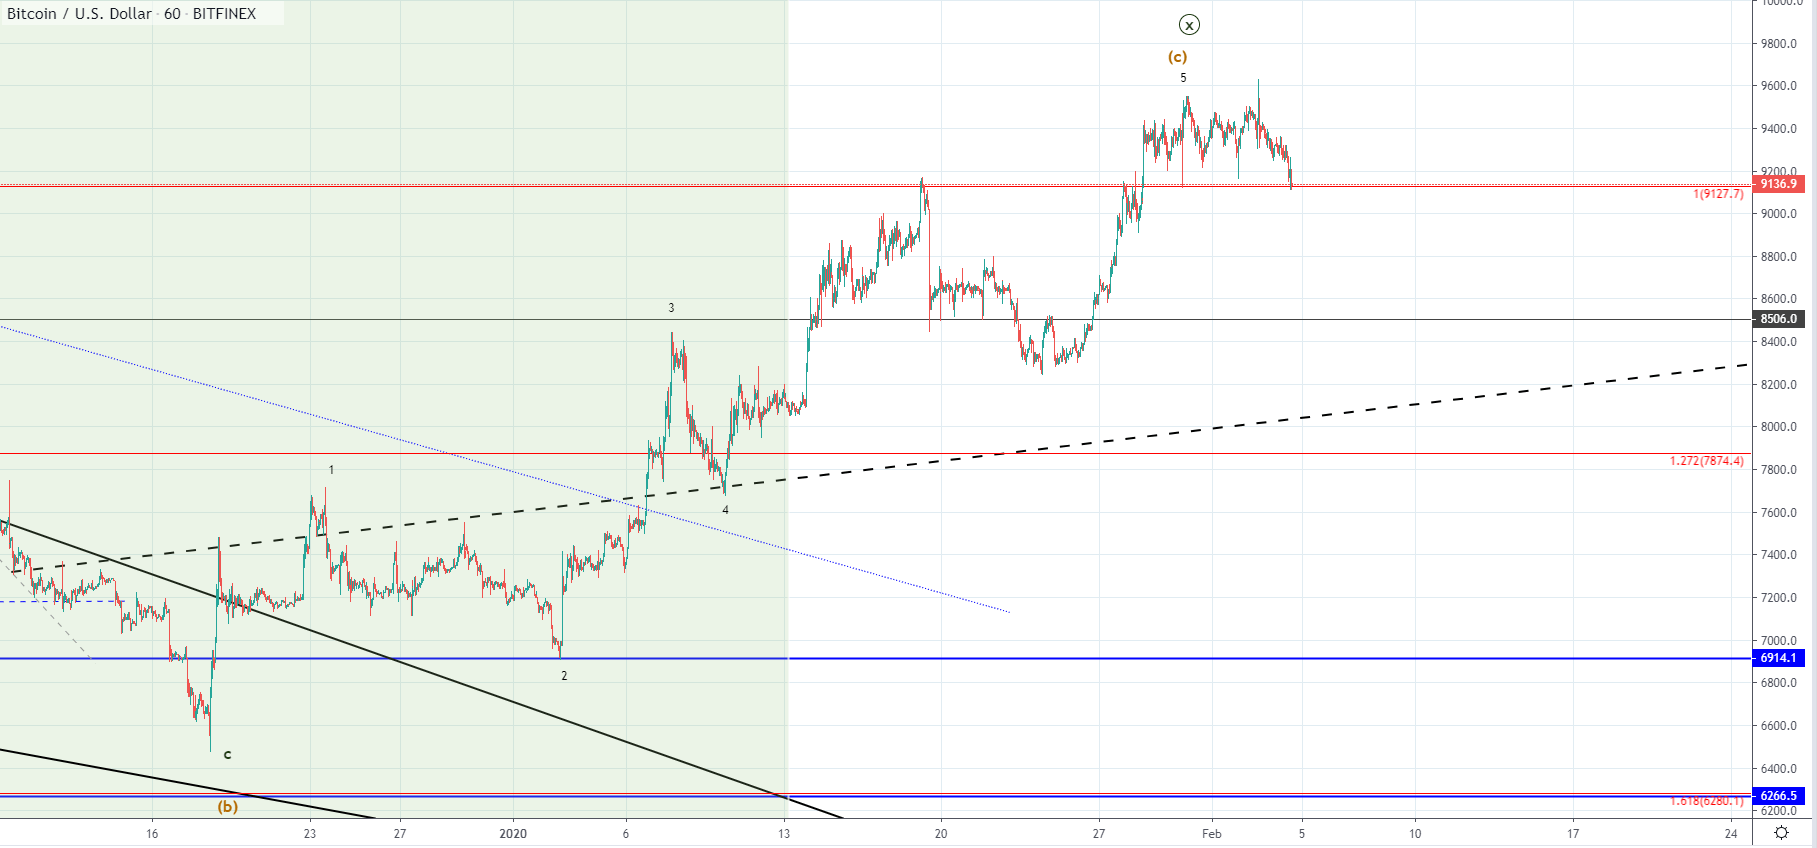
On the hourly chart, you can see that the price of Bitcoin is currently retesting the 1 Fibonacci level which is a highly significant one and is managing to stay above it. If the price continues moving to the downside and falls below the mentioned level further decrease could be anticipated as the price most likely ended its 5th wave. For now, we are presuming that the 5th wave ended which is why a move to the downside of higher degree would be expected and if we have seen the completion of the five-wave move this one could push the price of Bitcoin all the way down to $6914.
But if the price ended its upward wave as the C wave which is corrective in nature we could see the price going even further below as the next corrective structure to the downside started to develop.
XRP/USD
From Sunday’s high at $0.26198 we have seen the price of Ripple decreasing by 5.6% as it came down to $0.24731 on the next day. The price is currently being traded slightly higher but is still around the vicinity of the yesterday’s low.
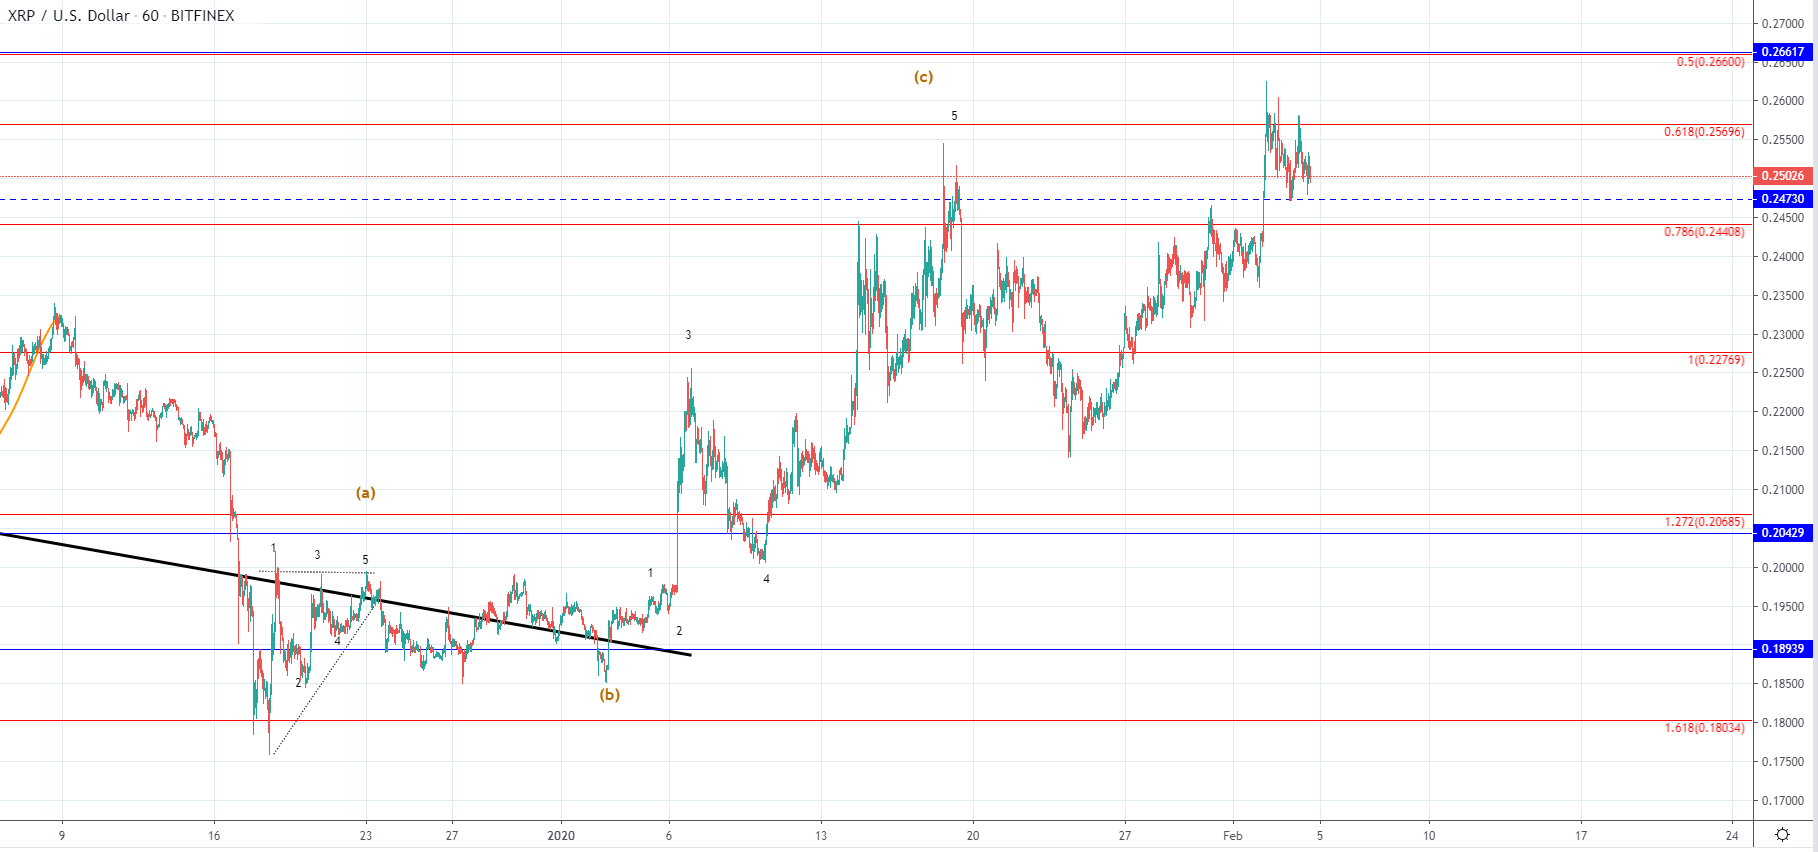
Looking at the hourly chart, you can see that the price of Ripple made a higher high compared to the previous one around $0.25 which could be interpreted as the 5th wave out of the five-wave move to the upside. The increase was stopped out at 0.618 Fibonacci level which makes this level as a significant resistance point and is most likely going to serve as a pivot point between a bullish scenarios in which the price of Ripple is to continue increasing from here or a bearish scenarios in which the price of Ripple could start moving to the downside as the C wave of a higher degree ended.
This will be validated by the breakout direction from the current resistance zone between the mentioned Fib level and the $0.24730 interrupted supper level. If the price breaks out to the upside further increase could be expected above the 0.5 Fib level, but if it breaks the zone’s support we could see a retracement all the way down below $0.2/
FXOpen offers the world's most popular cryptocurrency CFDs*, including Bitcoin and Ethereum. Floating spreads, 1:2 leverage — at your service. Open your trading account now or learn more about crypto CFD trading with FXOpen.
*Important: At FXOpen UK, Cryptocurrency trading via CFDs is only available to our Professional clients. They are not available for trading by Retail clients. To find out more information about how this may affect you, please get in touch with our team.
This article represents the opinion of the Companies operating under the FXOpen brand only. It is not to be construed as an offer, solicitation, or recommendation with respect to products and services provided by the Companies operating under the FXOpen brand, nor is it to be considered financial advice.
Stay ahead of the market!
Subscribe now to our mailing list and receive the latest market news and insights delivered directly to your inbox.


Latest articles

Market Insights with Gary Thomson: Canada’s Inflation, Fed and BoE Interest Rates, Earnings Reports
In this video, we’ll explore the key economic events, market trends, and corporate news shaping the financial landscape. Get ready for expert insights into forex, commodities, and stocks to help you navigate the week ahead. Let’s dive in!

S&P 500 Analysis: How Long Could the Stock Market Correction Last?
Six days ago, we noted that the Nasdaq 100 had entered a correction phase. Now, the S&P 500 (US SPX 500 mini on FXOpen) has followed suit, closing more than 10% below its 19 February peak on Thursday,

Spotify (SPOT) Shares Rise by Nearly 7%
According to the stock chart of music streaming giant Spotify (SPOT), the share price:
→ Increased by almost 7% by the end of trading on Friday.
→ Has surged approximately 28% since the start of 2025—one of the strongest performances in