


Identifying and Trading the Cypher Harmonic Pattern
FXOpen
Harmonic trading patterns provide traders with structured setups based on Fibonacci ratios. The Cypher, while less frequent than patterns like the Gartley or Bat, may provide strong reversal signals when determined correctly. Trading the Cypher pattern requires both skill in identifying the formation and discipline in following its entry and exit rules. In this article, we’ll explore how to draw the Cypher, interpret its signals and how traders apply it within a disciplined trading framework.
What Is the Cypher Harmonic Pattern?
The Cypher is a type of harmonic pattern used by traders to identify potential buy and sell trades in financial markets. Specifically, it’s used to help find areas where a reversal may occur. The pattern is made up of five swing points (X, A, B, C, D) and four legs (XA, AB, BC, CD). Traders typically place orders at D to catch the potential reversal.
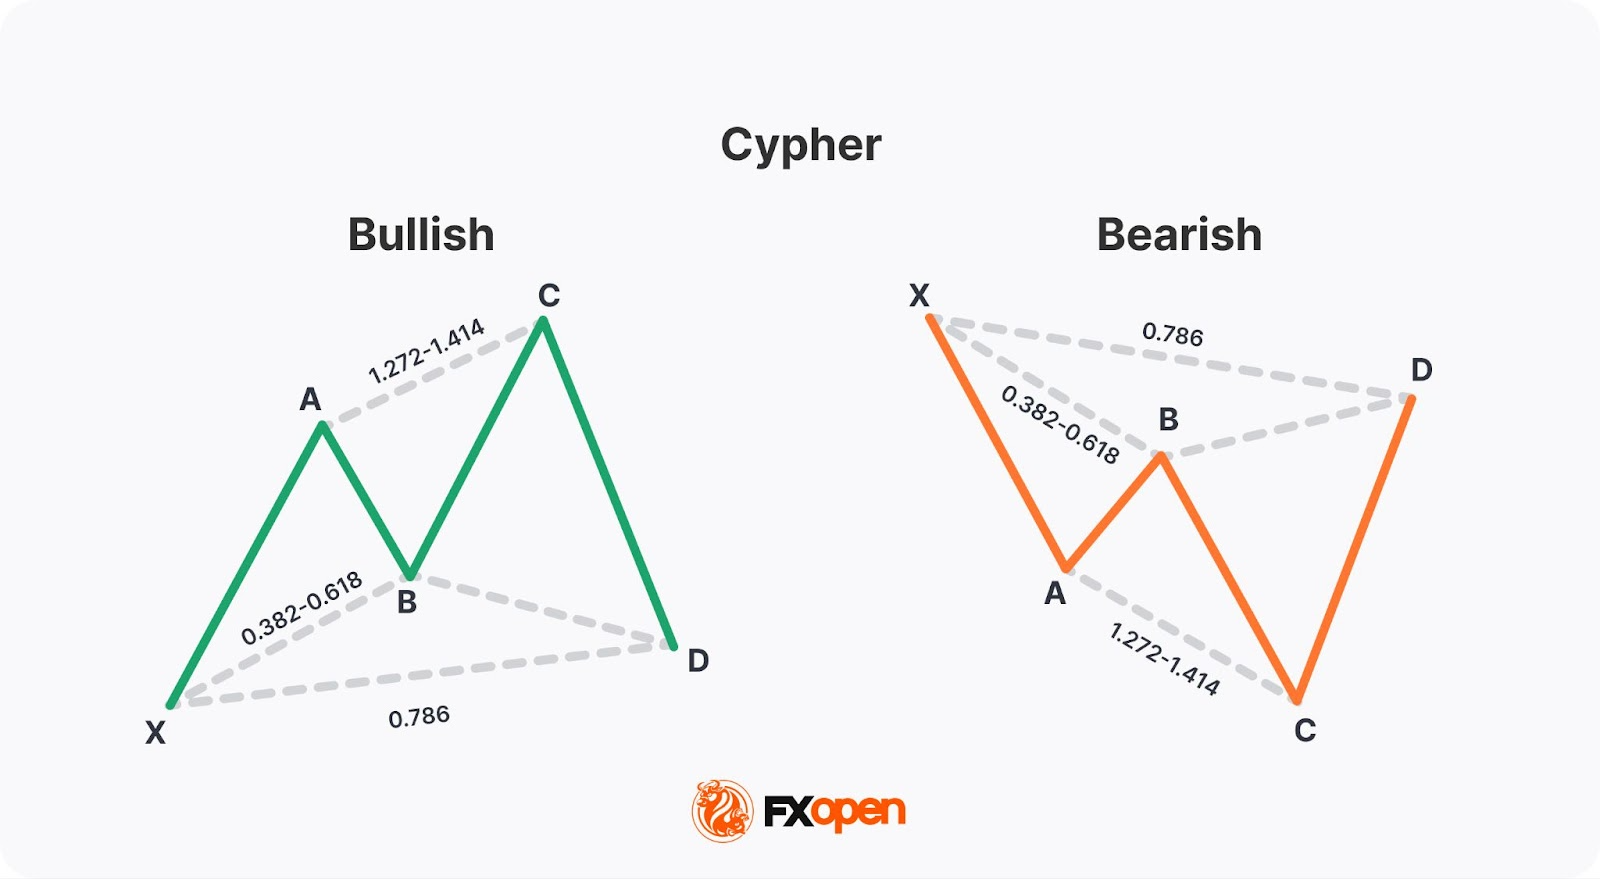
There are two types: bullish Cypher and bearish Cypher. A bullish Cypher pattern signals a potential reversal to the upside. It is represented by higher highs and higher lows, as well as a corrective downward price movement. It is shaped like the letter "M." The Bearish Cypher indicates a potential downside reversal. It is represented by lower highs and lower lows, as well as a corrective upward price movement. It is shaped like the letter "W."
Like other harmonic patterns, the Cypher requires specific Fibonacci ratios to be met before it is traded. However, the ratios used for the Cypher are relatively unique, which makes the formation one of the less common harmonic patterns.
The Cypher is also more advanced than other patterns, like the Gartley, Bat, or Butterfly, so you may need to spend some extra time learning how to recognise and trade it. Once you master the skill, however, you’ll find that the Cypher can be a valuable addition to your trading arsenal.
Identifying the Cypher Chart Pattern
At its simplest, the Cypher pattern comprises an impulse leg, XA, that retraces to form AB. Another impulse beyond the swing point A creates the BC leg, and a final retracement to D generates the CD leg.
Here are the Cypher harmonic pattern rules that should be met based on theory:
- AB retraces XA by 38.2% to 61.8% Fibonacci retracements.
- BC extends XA by 127.2% to 141.4% Fibonacci extensions.
- CD retraces XC by 78.6% Fibonacci retracement.
It’s acceptable if the ratios don’t line up exactly. For example, if AB retraces XA by 63% and the rest of the pattern looks correct, you could still consider trading. This is especially true for the final rule. Generally speaking, CD often moves slightly beyond the 78.6% area before reversing but can sometimes stop just short of the actual point, so you don’t need to be discouraged if the ratios are slightly off.
Drawing the Cypher Pattern
Now that we know how to identify the Cypher, we can begin plotting it on live charts. If you want to develop your Cypher drawing skills, you may consider using the TickTrader platform with a Cypher pattern indicator and over 1,200 other trading tools. There, you can use the built-in XABCD drawing tool, as seen in the chart above.
To draw the Cypher pattern:
- Choose the XABCD tool from the sidebar in “Patterns.”
- Click to place X at your first swing point.
- Add the following A, B, and C points at the corresponding swing highs and lows.
- Place D at 78.6%.
You may notice that the ratios on the chart are expressed as numbers instead of percentages. Just multiply the number by 100 to get the percentage, such as 1.272 = 127.2%.
Using the Cypher Pattern While Trading
So, now we know how to identify and draw the Cypher pattern, but how may it be traded? You may consider following these steps to get an idea of how the Cypher pattern may be applied to forex and other markets.
Entry
Traders have two options when it comes to entering a Cypher pattern. They can either set a limit order at the 78.6% level or use a market order after confirming that the price is beginning to reverse.
Placing a limit order carries the risk of missing an entry. However, it also removes the need to actively monitor the market for confirmation. Meanwhile, looking for validation, like if D begins to reverse at a support/resistance level or with a candlestick pattern (such as a pin bar or tweezer tops/bottoms), and entering with a market order may potentially offer you a worse risk/reward ratio, but can get you into trades with more certainty.
Stop Loss
Since X should always be the most extreme point out of X, B, and D, stop losses may be placed just above X (bearish Cypher) or below X (bullish Cypher). Beyond X, the setup becomes invalid, so this is a suitable area to set a stop.
If entering with a market order, you could set a stop loss above (bearish Cypher) or below (bullish Cypher) the candle you entered on for potentially greater risk/reward, but be aware that the price could still hit your stop loss and take off without you.
Take Profit
Many traders begin to partially close their position at A, although you could choose C if you want to take a more aggressive approach. Beyond the structure, you could set targets based on Fibonacci extension levels, like 1.272 or 1.618. This is done by applying the Trend-Based Fibonacci Extension tool to X, A, and B, which will project levels outside the formation.
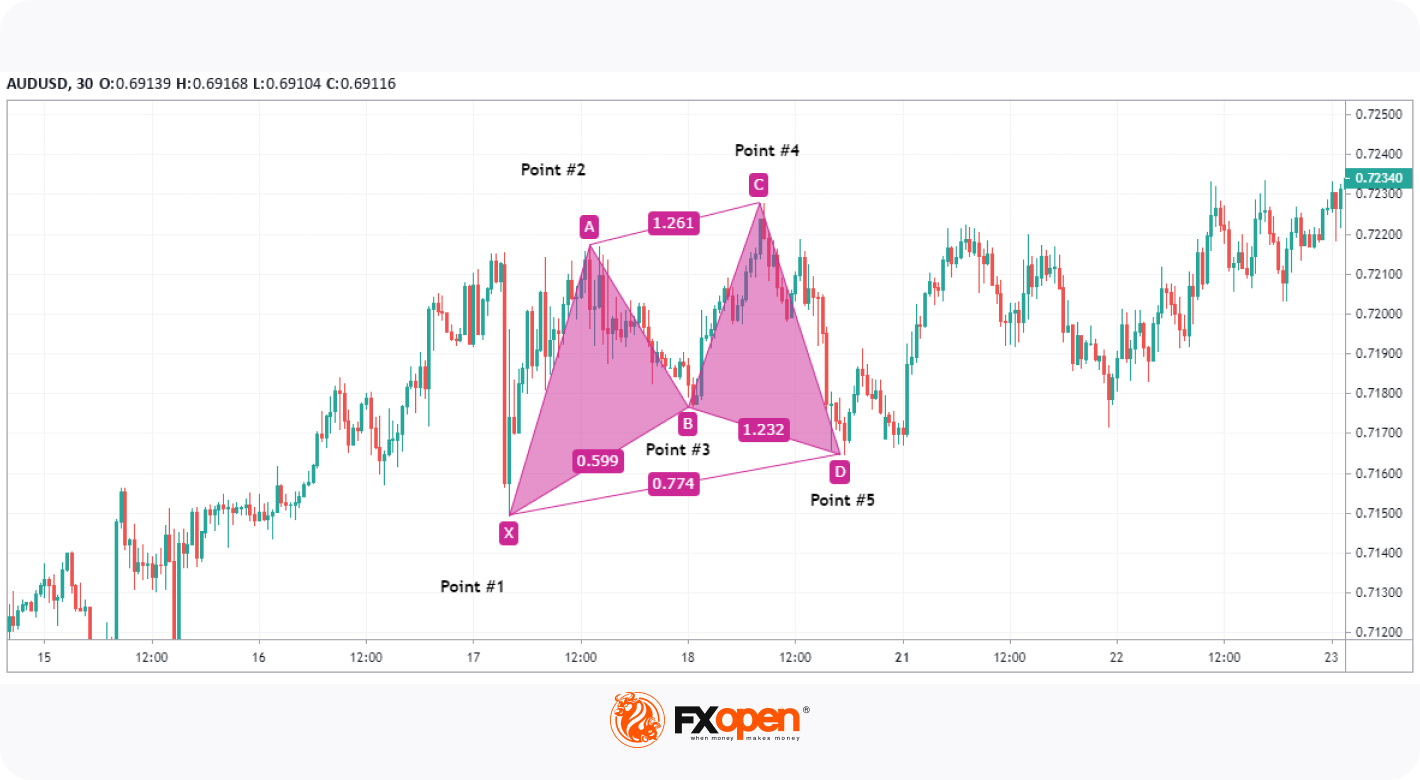
Bullish Cypher Pattern Example
Here, we have an almost perfect AB retracement of 61.4%, followed by a pinpoint CD retracement to the 78.6% level. Note that the tool shows the pullback as 73.7%, but we know by applying the Fibonacci retracement tool to X and C that it actually hit the expected level. Even if you weren’t using the Fibonacci retracement tool, you could still consider the hammer candle signs of a reversal and enter with a market order.
The stop loss was placed suitably, just below X. Given how well this example aligns with the ratios, you could decide to be more aggressive and set a profit target at C. You might also use the Trend-Based Fibonacci Extension tool, as we’ve used here, to find further targets, such as 127.2%.
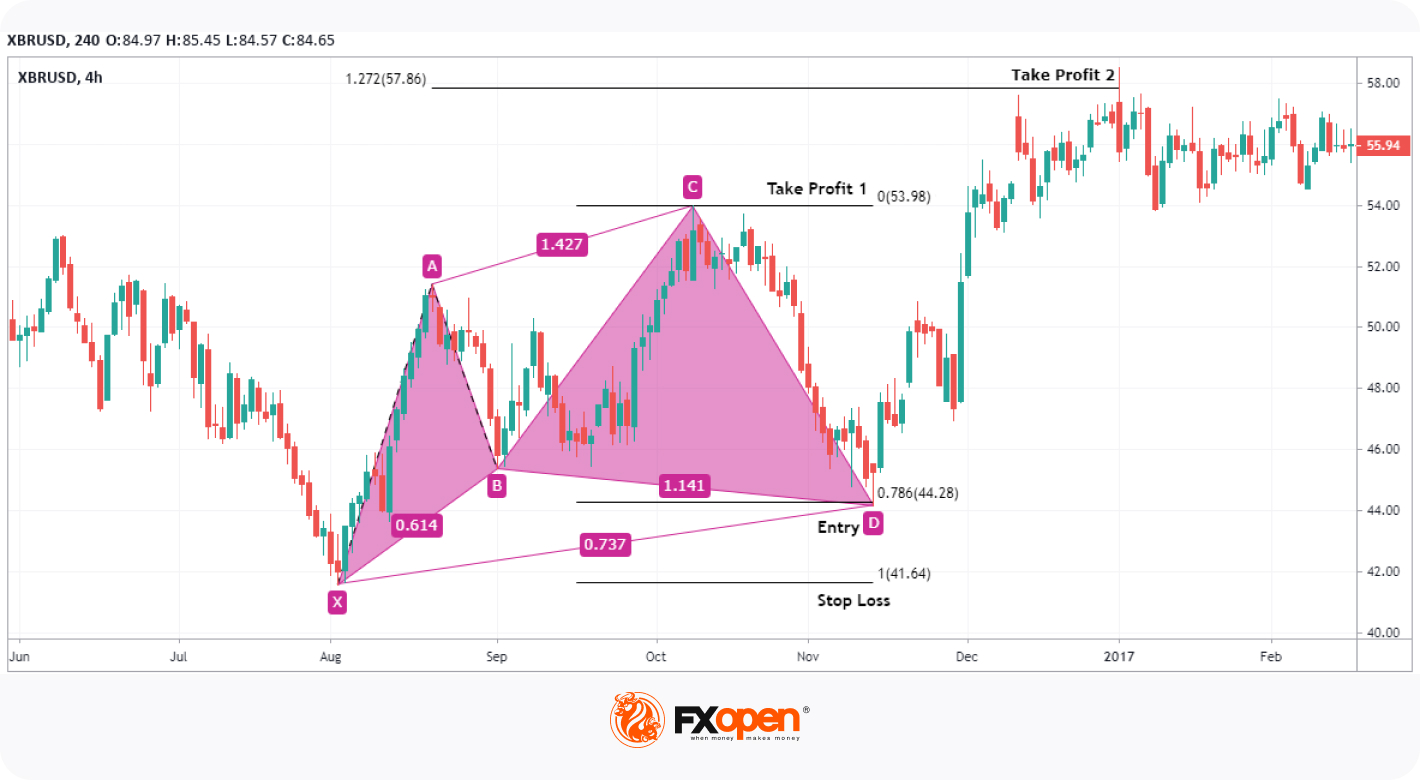
Bearish Cypher Pattern Example
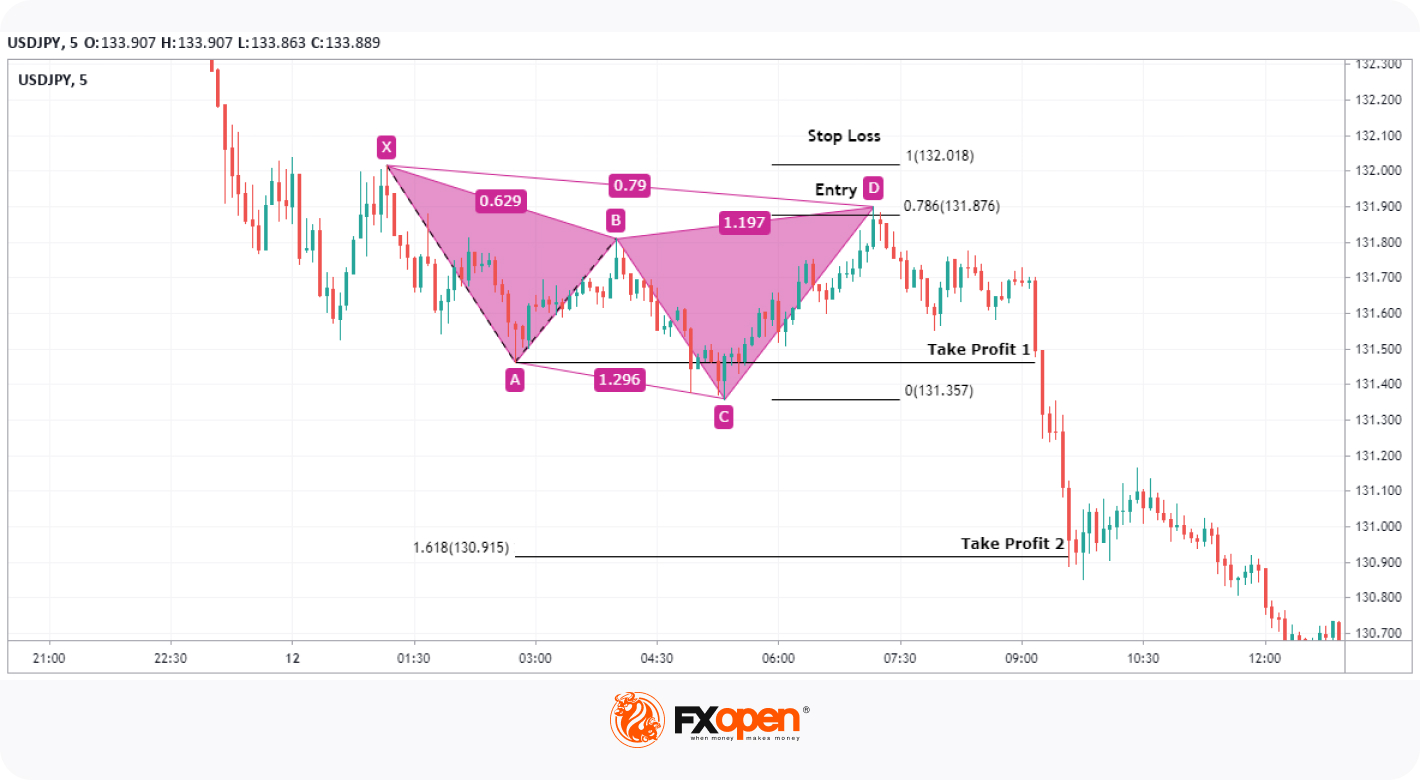
In this example, we can see a bearish Cypher forming as part of a larger downtrend. The AB retracement of 62.9% and BC extension of 129.6% are very close to the ratios of 61.8% and 127.2%, so the price is likely to reverse at 0.786 before breaking down further.
As such, a limit order at 78.6% could be placed, as the price retraced to 79% before plummeting. The risk/reward ratio here is also attractive with a stop loss just above X. A conservative profit-taking approach would be to partially close the position at A, although C would have also been suitable in this scenario. Using the Fibonacci extension tool applied as described above showed us a second target at 161.8%.
Final Thoughts
The Cypher harmonic pattern is a complex trading setup. By learning to identify its structure and applying strict entry and exit rules, traders can use it to anticipate market reversals and build their reversal strategies. As with any advanced pattern, consistent practice and risk management may help traders achieve results.
If you want to apply your strategy to over 700 markets and gain access to spreads from 0.0 pips and commissions starting from $1.50 per lot, you may consider opening an FXOpen account.
FAQ
How May the Cypher Harmonic Pattern Be Traded?
According to theory, to trade the Cypher harmonic pattern, traders first identify the structure using Fibonacci ratios. After confirming the completion point (D), traders typically look for a market reversal. Entry is usually placed near point D, with stop-losses below or above recent swing levels, and take-profit targets set at A and C points or Fibonacci retracements of the CD leg. Strict risk management and confirmation signals are popular as they may help traders improve the pattern’s signals.
How May the Cypher Pattern Be Identified?
The Cypher pattern is recognised by its distinctive five-point structure (X–A–B–C–D). The main Fibonacci rules are:
- AB retraces XA by 38.2% to 61.8% Fibonacci retracements.
- BC extends XA by 127.2% to 141.4% Fibonacci extensions.
- CD retraces XC by 78.6% Fibonacci retracement.
Because it is less common than other harmonic patterns, traders carefully validate each ratio before executing trades.
What Is the Difference Between the Shark Pattern and the Cypher Pattern?
While both are advanced harmonic patterns, the Shark and Cypher have different structures and Fibonacci measurements. The Shark typically forms with a 0X–AB–CD sequence and relies on the 88.6% and 113% retracements, while the Cypher is identified by its 78.6% retracement at point D. As a result, they signal potential reversals at different levels and should not be confused.
This article represents the opinion of the Companies operating under the FXOpen brand only. It is not to be construed as an offer, solicitation, or recommendation with respect to products and services provided by the Companies operating under the FXOpen brand, nor is it to be considered financial advice.
Stay ahead of the market!
Subscribe now to our mailing list and receive the latest market news and insights delivered directly to your inbox.


Latest articles

Weekly Market Insights with Gary Thomson: The Week of Central Banks and Earnings
In this video, we’ll explore the key economic events and market trends, shaping the financial landscape. Get ready for insights into financial markets to help you navigate the week ahead. Let’s dive in!
In this episode of Market

Intel at a Crossroads: Earnings Beat Meets Technical Resistance
Intel has just delivered its strongest quarter in over fifteen years, and the market reaction says it all. Q2 2026 revenue surged 25% year-over-year to $16.1 billion, crushing the consensus estimate of $14.42 billion, while adjusted EPS of

Tesla: Complex Range Structure Breaks Down Following Quarterly Earnings
Tesla released its Q2 2026 results after the market closed on 22 July. Revenue increased 26% year-on-year to $28.24 billion, while vehicle deliveries reached a record 480,126 units. However, operating margin fell sharply to 1.4%, down from