


FXOpen

On Thursday, Amazon released its second-quarter report:
→ Earnings per share: actual = $1.26, forecast = $1.03;
→ Gross sales: actual = $147.98 billion, forecast = $148.66 billion.
Amazon’s CFO, Brian Olsavsky, attributed the decline in sales to distractions caused by Trump’s news coverage and the Olympics, suggesting people spent more time reading news and less time shopping on Amazon.
As a result, the sales forecast for the third quarter fell short of expectations, with management estimating between $154 billion and $158.5 billion, while analysts’ average estimate was $158.24 billion.
Investors were disappointed by this news, causing Amazon’s share price to drop approximately 9% on Friday, creating a wide bearish gap. On Monday, the price also opened with a bearish gap and continued to fall, creating a precarious situation.
However, by Monday’s close, the bulls had recovered the early trading losses, and on Tuesday, AMZN showed some stability, staying close to Monday’s closing price.
Does this mean the downward trend (with AMZN’s price now more than 20% below its July all-time high) has run its course?
Today's technical analysis of Amazon’s stock chart provides valuable insights:
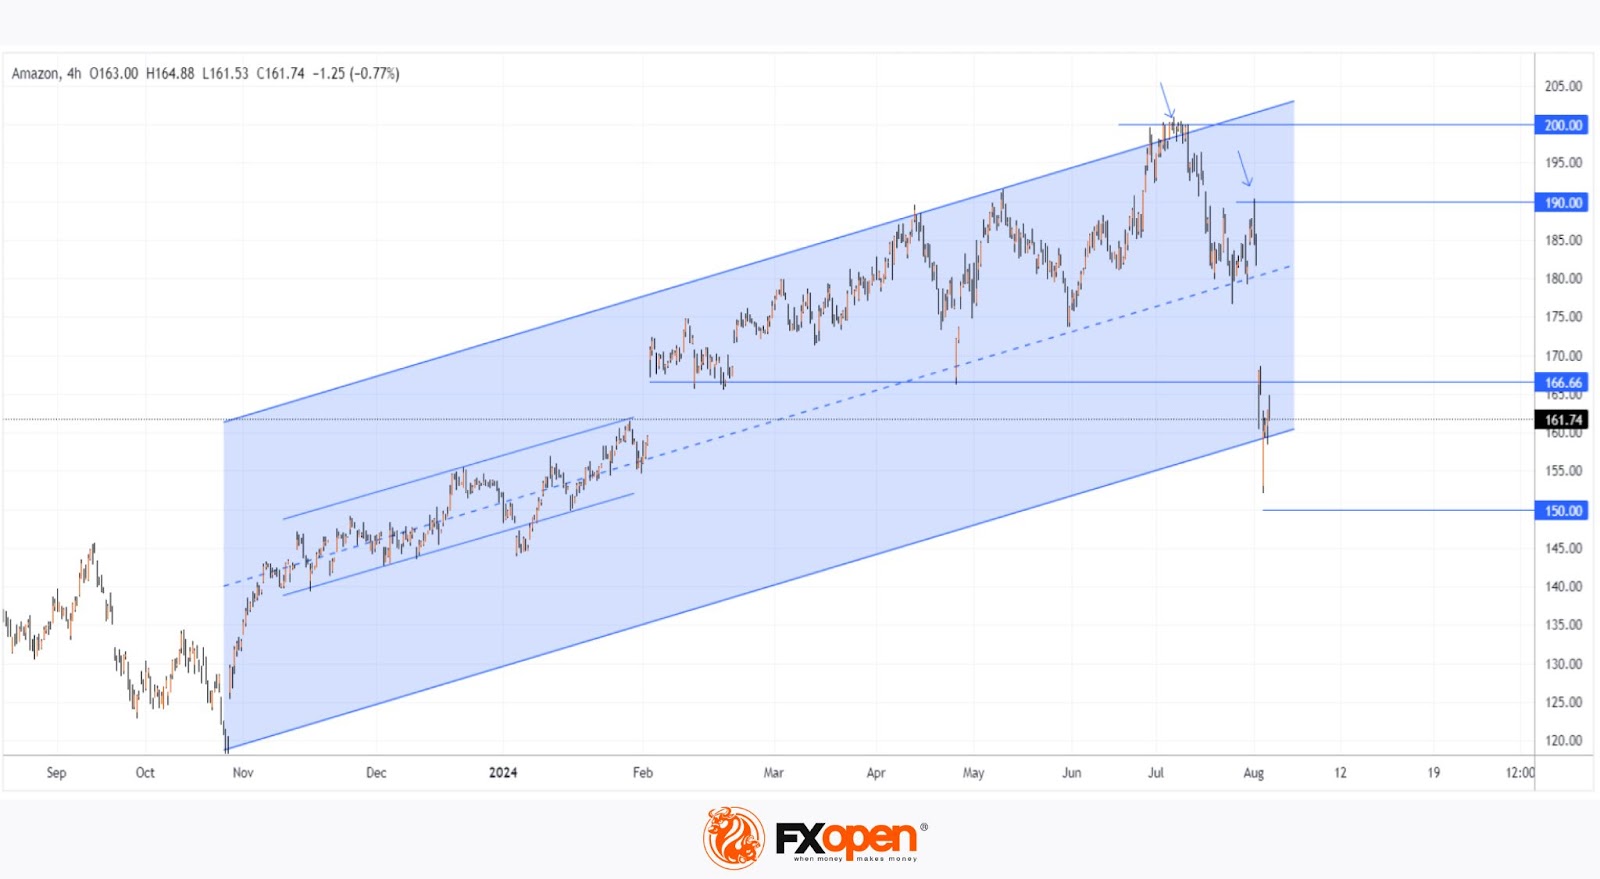
→ In late 2023 and early 2024, the price gradually increased within a narrow range along the median of an ascending blue channel, indicating a consensus between buyers and sellers on the stock’s fair value.
→ Good news in early February pushed the price up, accelerating growth towards the upper boundary of the channel, which acted as resistance.
→ Last week’s report had the opposite effect. On the bad news, AMZN’s price fell to the lower boundary of the channel, where it found support. This price action shows the impact of news on deviations from the median, which may still be relevant.
It’s worth noting the importance of breaking psychological levels (indicated by arrows showing false bullish breakouts at $200 and $190). It’s possible that:
→ AMZN’s price will continue to consolidate around the lower boundary of the channel, with former support at $166.66 acting as resistance;
→ We may see a false bearish breakout at the $150 level.
Price forecasts for AMZN have slightly worsened since the report, as we warned on July 26. According to current forecasts by 41 Wall Street analysts surveyed by TipRanks, 40 analysts recommend buying AMZN. On average, they predict AMZN’s price will reach $223.60 (about 38% above current levels) over the next 12 months.
Buy and sell stocks of the world's biggest publicly-listed companies with CFDs on FXOpen’s trading platform. Open your FXOpen account now or learn more about trading share CFDs with FXOpen.
This article represents the opinion of the Companies operating under the FXOpen brand only. It is not to be construed as an offer, solicitation, or recommendation with respect to products and services provided by the Companies operating under the FXOpen brand, nor is it to be considered financial advice.
Stay ahead of the market!
Subscribe now to our mailing list and receive the latest market news and insights delivered directly to your inbox.


Latest articles

European Currencies Decline: Pound Hits New Lows, Euro Under Pressure
European currencies continue to weaken against the US dollar amid rising geopolitical tensions and increased demand for safe-haven and liquid assets. Market participants are reducing exposure to riskier instruments, putting pressure on both the euro and the pound. Additional support

Market Analysis: GBP/USD Dips Further As EUR/GBP Regains Traction
GBP/USD failed to climb above 1.3500 and corrected some gains. EUR/GBP started a decent increase and might aim for more gains above 0.8700.
Important Takeaways for GBP/USD and EUR/GBP Analysis Today
· The British Pound
