


Lockheed Martin (LMT) Stock Price Surpasses $600 for the First Time
FXOpen

As indicated by the Lockheed Martin (LMT) stock chart, after breaking through the psychological barrier of $600, the price has reached an all-time high. Remarkably, it took less than 2.5 months for the stock to climb from $500 to $600.
Demand for Lockheed Martin (LMT) shares is being driven by consistent news of government contracts awarded to the company amid rising geopolitical tensions. These contracts include deals for F-35 Joint Strike Fighter aircraft, Trident II D5 missile production, and supplies for the U.S. missile defence system.
The surge in orders has enabled Lockheed Martin’s board of directors (NYSE: LMT) to announce an increase in dividends for Q4 2024 by $0.15, bringing them to $3.30 per share. It is worth noting that the company has raised its dividends for 22 consecutive years.
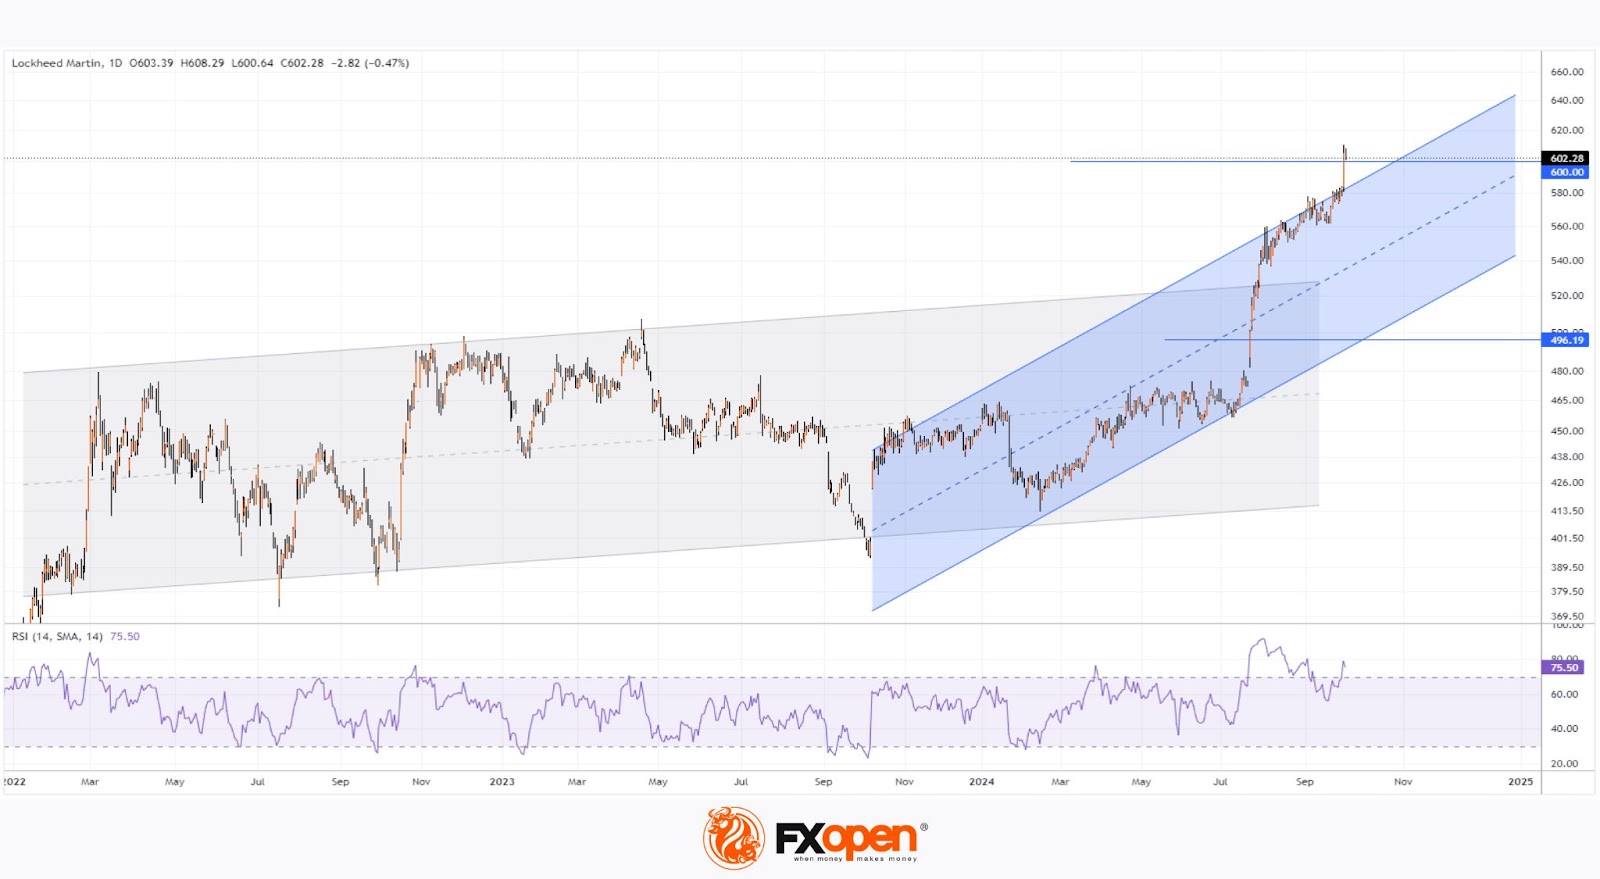
Technical analysis of the Lockheed Martin (LMT) chart today reveals a strongly bullish outlook:
→ Since February 2022, the price has moved within an upward channel (shown in grey);
→ From July 2024 onwards, the price action has required a steeper upward channel to capture its dynamics;
→ The RSI indicator is showing bearish divergences, yet the price continues to hit record highs.
It’s possible that the psychological $600 level could trigger profit-taking among investors, which may lead to a correction following the impressive rally – in this scenario, LMT shares could retrace to the median line of the blue channel.
According to TipRanks, the average 12-month price target for LMT is $579.14, which highlights the potential overvaluation of the stock at its current level.
Buy and sell stocks of the world's biggest publicly-listed companies with CFDs on FXOpen’s trading platform. Open your FXOpen account now or learn more about trading share CFDs with FXOpen.
This article represents the opinion of the Companies operating under the FXOpen brand only. It is not to be construed as an offer, solicitation, or recommendation with respect to products and services provided by the Companies operating under the FXOpen brand, nor is it to be considered financial advice.
Stay ahead of the market!
Subscribe now to our mailing list and receive the latest market news and insights delivered directly to your inbox.


Latest articles

Market Analysis: GBP/USD Holds Firm, USD/CAD Bulls Target Breakout Move
GBP/USD started a downside correction from 1.3480. USD/CAD is gaining bullish momentum and might clear 1.3880 for more upside.
Important Takeaways for GBP/USD and USD/CAD Analysis Today
· The British Pound rallied toward 1.3500


Market Repricing of Risk as Gold Loses Safe-Haven Demand
Geopolitical tensions in the Middle East had remained the primary macro driver for the gold market over recent weeks; however, on 8 April the situation shifted sharply as the United States and Iran agreed to a temporary two-week ceasefire, including