


FXOpen

As indicated by the XAG/USD chart today, the intraday price of silver reached $29.84 per ounce yesterday, while the previous yearly high on 12 April was $29.79. The last time this price was seen was in February 2021.
It is worth noting that today the price of silver is behaving more bullishly than the price of gold, which is approximately 1.5% below its April high.
The main factor contributing to the rise in the price of silver is likely the weakening of the US dollar, as traders expect the Federal Reserve to ease monetary policy.
Can the price of silver continue to rise? Analysts are generally bullish. As CNBC reports:
→ Saxo Bank strategists recently stated in an analytical review that the price of silver could rise to $30, while gold could soon test the $2,400 level.
→ Analysts at ROTH Capital Partners forecast that the prices of gold and silver will rise even higher in the coming months. According to JC O'Hara, Chief Market Technician, if the price breaks the $30 level, "there will be few resistance levels until the $35/$37 range."
Let’s provide more data for a technical analysis of the silver market.
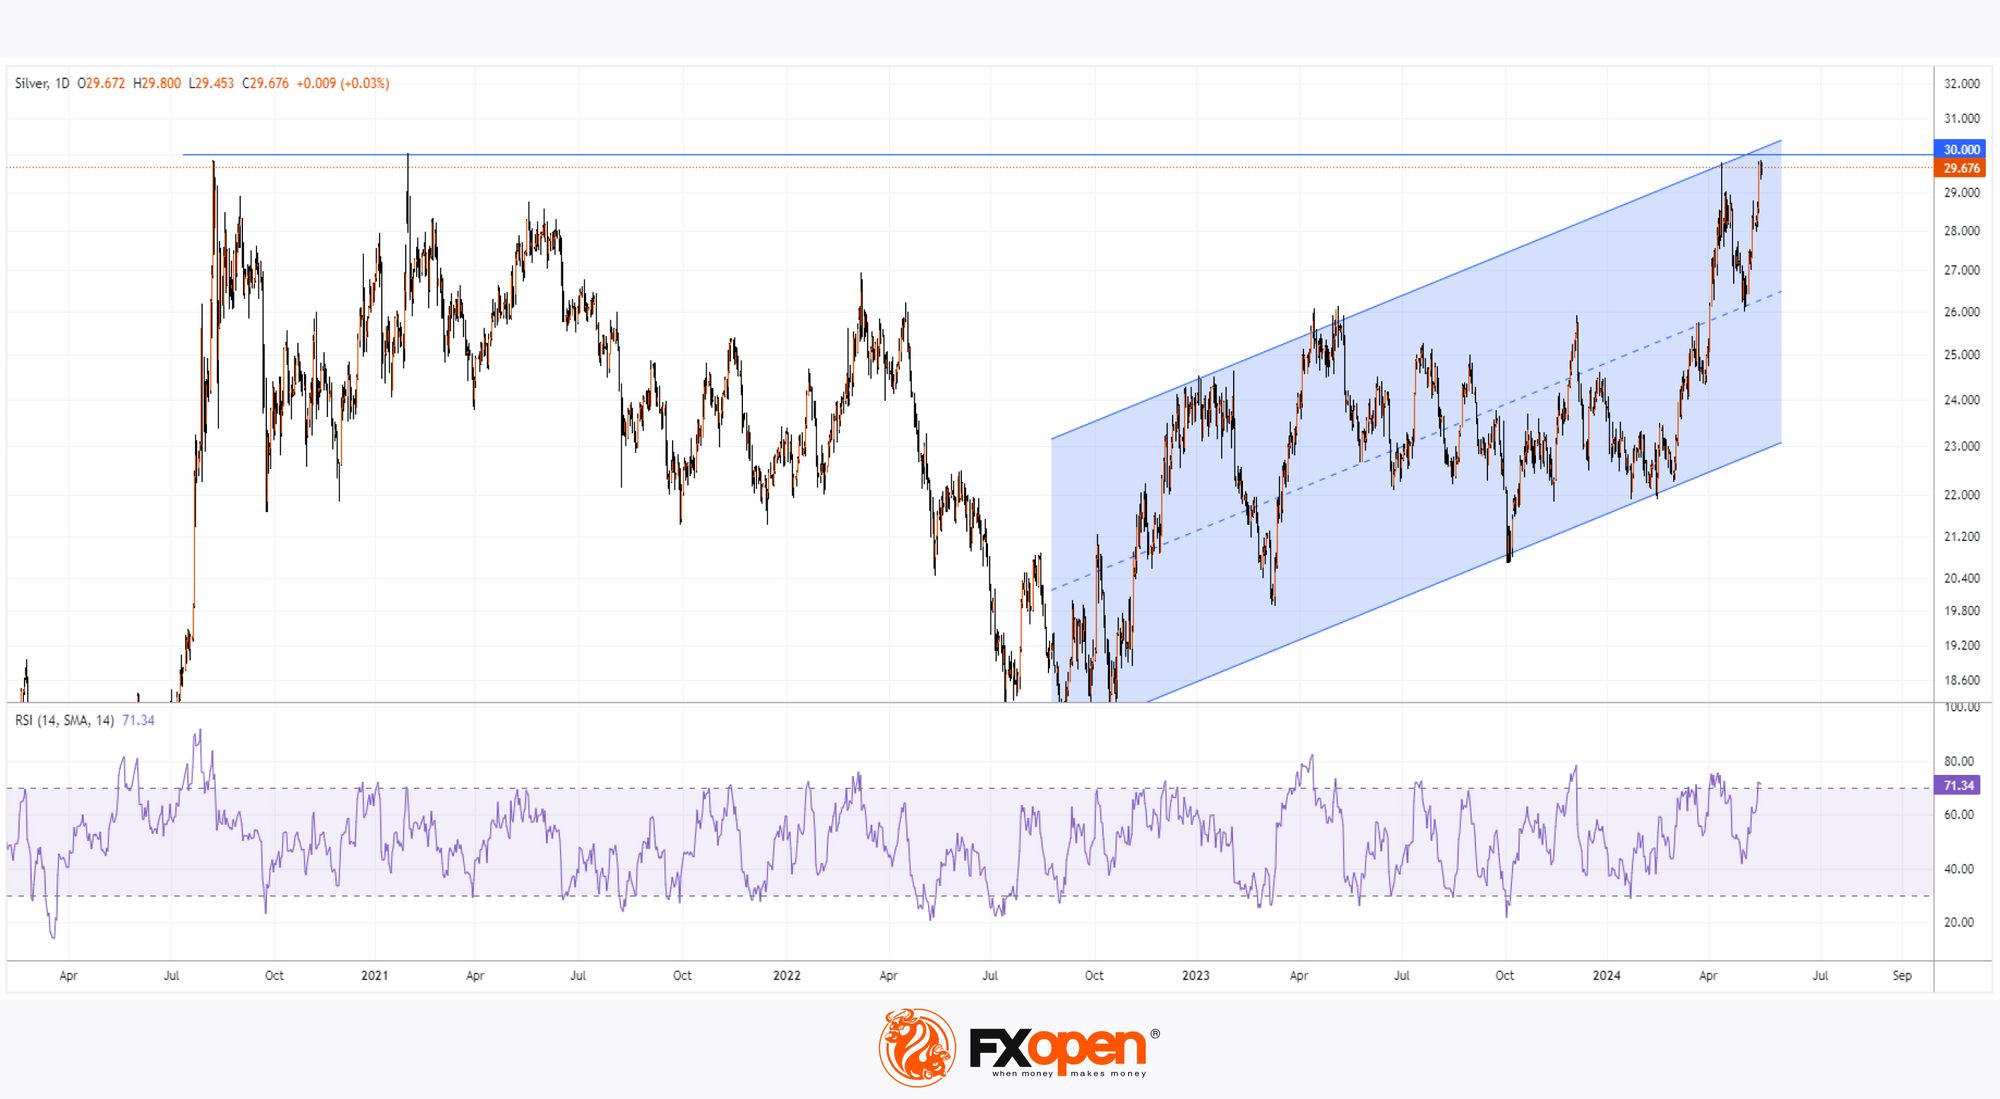
The daily XAG/USD chart shows that:
→ the price of silver is moving within an upward channel (shown in blue);
→ in April, the price sharply declined after briefly exceeding the upper boundary of the channel (a sign of seller activity);
→ today the price of silver is again near the upper boundary, which should be considered as resistance;
→ the psychological level of $30 could also be an obstacle for the bulls;
→ judging by the RSI, the market may be overbought.
Note the history of the XAG/USD chart – in 2020 and 2021, the price of silver already tried to surpass the $30 level but turned downward. It is possible that we will soon witness another bullish attempt at this important "round" price level.
Start trading commodity CFDs with tight spreads (additional fees may apply). Open your trading account now or learn more about trading commodity CFDs with FXOpen.
This article represents the opinion of the Companies operating under the FXOpen brand only. It is not to be construed as an offer, solicitation, or recommendation with respect to products and services provided by the Companies operating under the FXOpen brand, nor is it to be considered financial advice.
Stay ahead of the market!
Subscribe now to our mailing list and receive the latest market news and insights delivered directly to your inbox.


Latest articles

Consolidation Ahead of NFP: Commodity Currencies Search for Direction
Commodity-linked currencies have entered a consolidation phase following recent directional moves, as market participants adopt a wait-and-see approach ahead of key US labour market data. Current price action reflects a balance between ongoing demand for the US dollar and attempts

The Real Driver Behind the Dollar Rally: Market Insights with Gary Thomson
The US dollar has been firm, but the drivers behind the move may be more complex than they first appear.
While geopolitical tension and shifts in risk sentiment play a role, current price behaviour seems increasingly influenced by inflation expectations

EUR/USD and USD/CHF Pull Back: Market Reacts to Fundamentals
European currencies have shown a recovery in recent trading sessions after their recent decline, displaying early signs of a reversal. The US dollar is weakening amid expectations surrounding upcoming US macroeconomic data, while market participants are reassessing their short-term positions