


FXOpen

According to Reuters, precious metal prices have risen in the past 1-2 days as Treasury yields have fallen, enhancing metals' appeal as a "safe haven" for investor portfolios.
Currently:
→ Expectations are growing that US interest rate cuts may begin as early as September;
→ Market participants are focusing on non-farm employment data and other US market data, set to be released on Friday at 15:30 GMT+3.
In this context, it is notable that the gold market is clearly stronger than silver.
The XAU/USD chart shows that the price of gold today rose above $2370 per ounce, a high not seen since 23 May, more than 10 days ago.
Meanwhile, the price of silver experienced a decline of over 8% from 29 May to 4 June. Today’s rise appears to be an attempt by bulls to offset this bearish momentum, during which the price of gold remained stable.
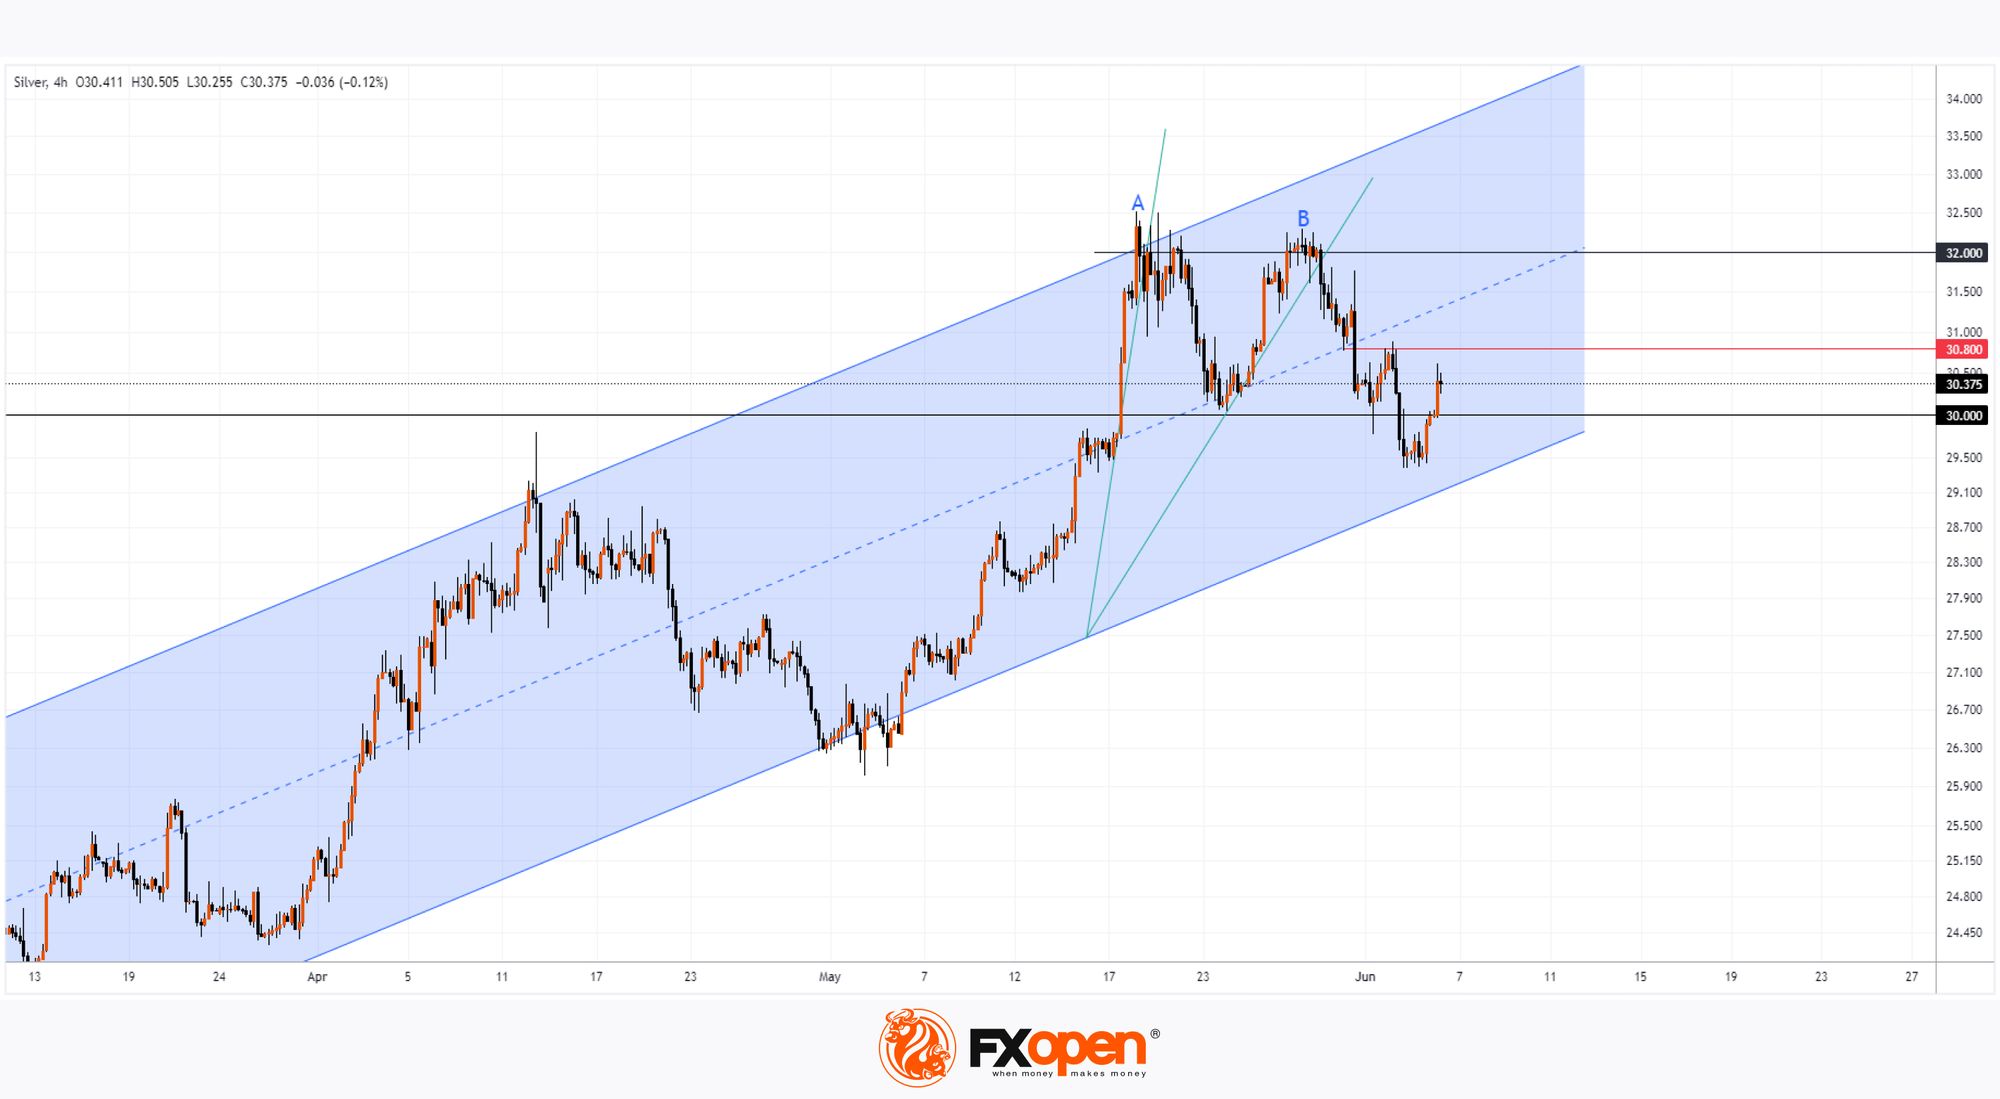
Technical analysis of the XAG/USD chart shows that:
→ Since March, there has been an upward trend in the market (indicated by a blue channel);
→ On 17 May, we noted in our analysis of the XAG/USD chart that we might witness a new bull attack on the psychological level of $30 per ounce of silver. Indeed, the bullish breakout occurred immediately after publication.
→ Following the breakout, the price of silver reached the upper boundary of the ascending channel (A), retreated to the key level of $30, and then formed a new peak (B), demonstrating an inability to reach the upper boundary – a bearish sign. Thus, a double top pattern has formed around the $32 per ounce level on the silver price chart.
Additionally, the steepness of the ascending trend lines is decreasing (shown in green), indicating a potential exhaustion of demand – fewer buyers are willing to pay more than $30 per ounce of silver.
The $30.80 level is already showing resistance. Bulls may attempt to break through it and resume the uptrend from the lower boundary of the channel, but there are no guarantees that this will subsequently activate demand forces around the double top area.
Start trading commodity CFDs with tight spreads (additional fees may apply). Open your trading account now or learn more about trading commodity CFDs with FXOpen.
This article represents the opinion of the Companies operating under the FXOpen brand only. It is not to be construed as an offer, solicitation, or recommendation with respect to products and services provided by the Companies operating under the FXOpen brand, nor is it to be considered financial advice.
Stay ahead of the market!
Subscribe now to our mailing list and receive the latest market news and insights delivered directly to your inbox.


Latest articles

Market Analysis: GBP/USD Dips Further As EUR/GBP Regains Traction
GBP/USD failed to climb above 1.3500 and corrected some gains. EUR/GBP started a decent increase and might aim for more gains above 0.8700.
Important Takeaways for GBP/USD and EUR/GBP Analysis Today
· The British Pound


Market Insights with Gary Thomson: Oil, US Retail Sales & NFP in Focus
In this video, we’ll explore the key economic events and market trends, shaping the financial landscape. Get ready for insights into financial markets to help you navigate the week ahead. Let’s dive in!
In this episode of Market