


FXOpen

As shown in the USD/JPY chart, today the rate is around 160.58 yen per US dollar.
Bloomberg reports the words of Japan’s Finance Minister Shunichi Suzuki:
→ It is desirable for the exchange rate to move in a stable manner.
→ Sudden, one-sided moves are not desirable.
→ We will analyze the background to this move with a high sense of urgency, and take necessary action as needed.
Such rhetoric from officials seems not to have deterred the bulls, who are keeping the rate above the April high (when the Bank of Japan intervened in the market to support the weakened yen, resulting in a 4.75% decline over 5 days).
In our analysis from 24 June, we noted that:
→ the price is moving within a large upward channel (shown in blue),
→ and the local rise (framed by orange lines) could push the price to the boundaries of the blue channel.
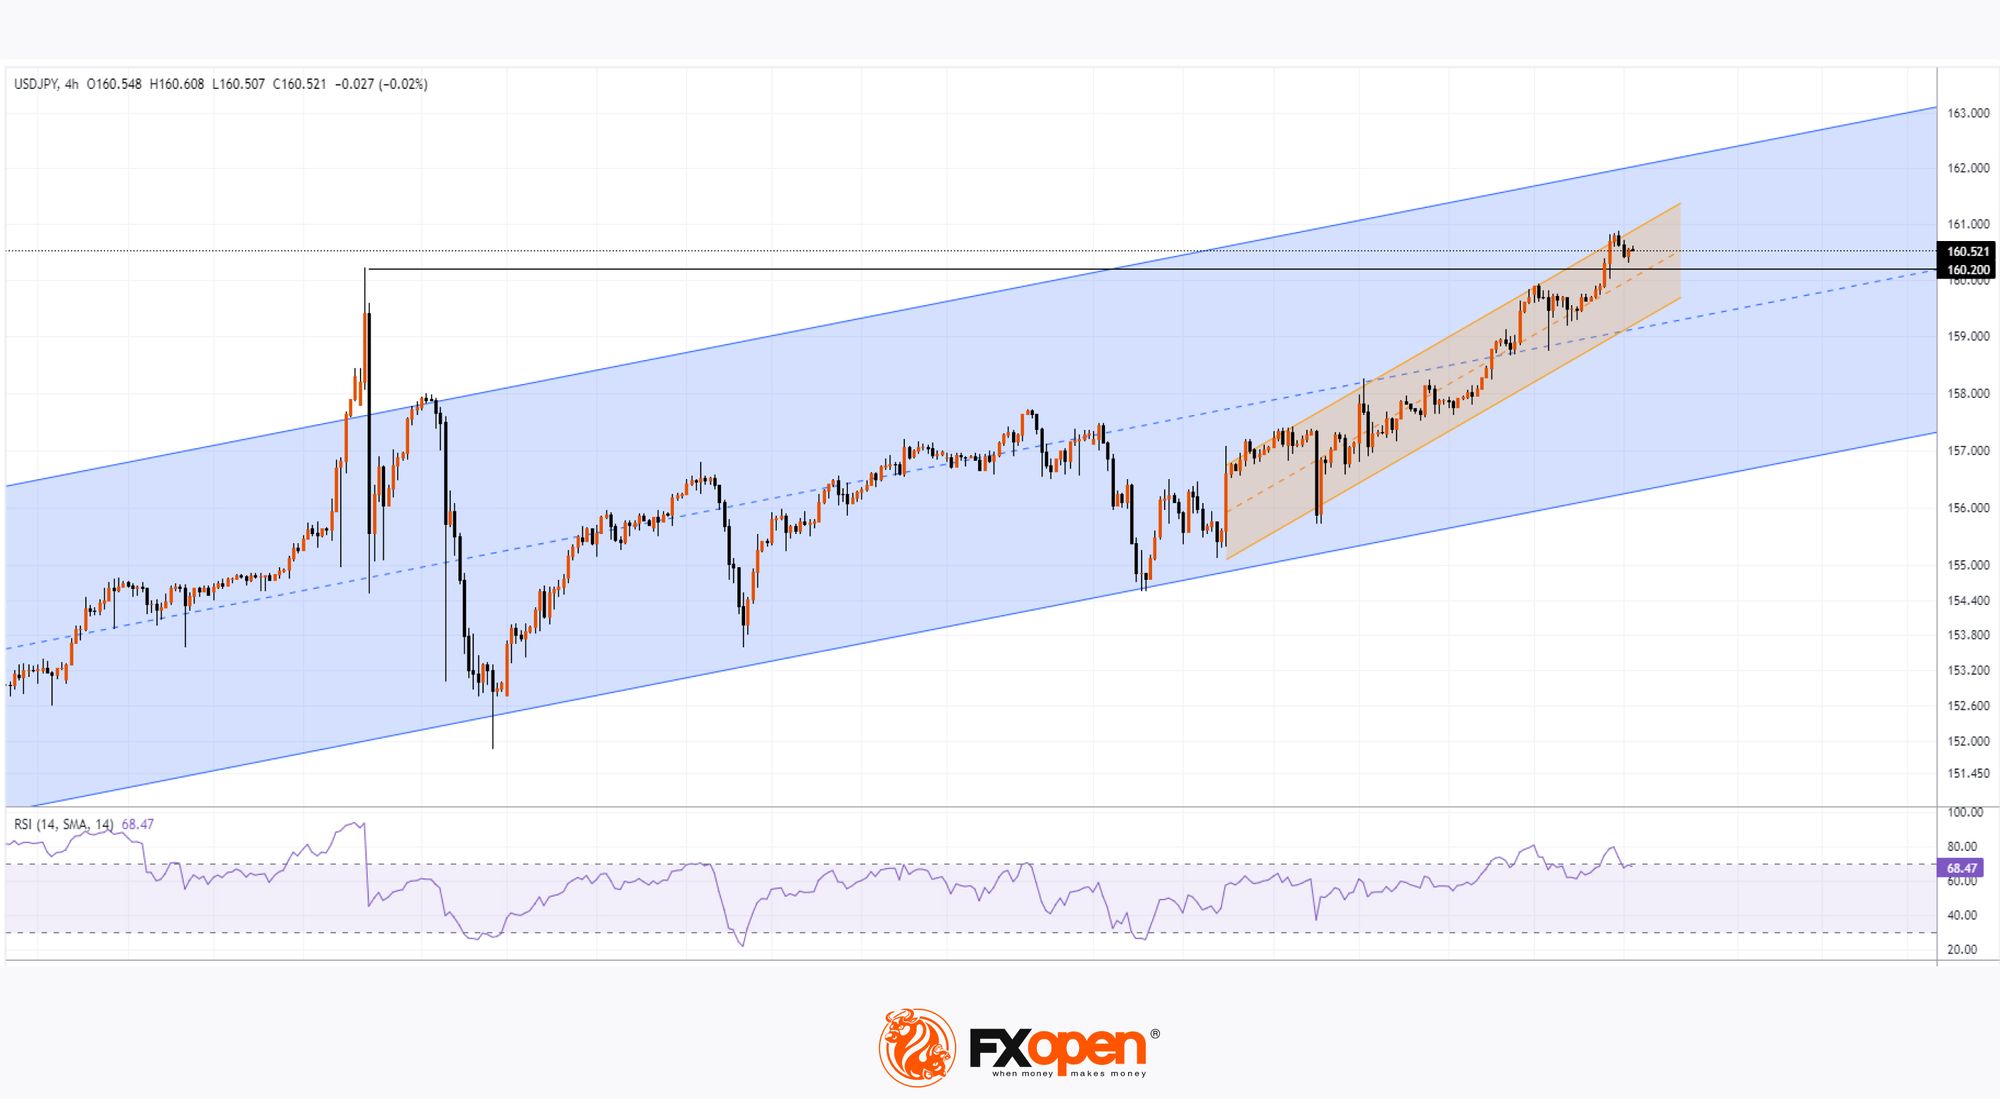
Updated technical analysis of USD/JPY shows that:
→ the price continues to hold within the orange channel;
→ in the coming days, the April high of 160.20 yen per dollar may act as support after being broken, reinforced by the median line of the orange channel.
It seems the bulls are in control, highlighted by the RSI indicator, which has not dropped below the 50 level since mid-June.
However, everything could change suddenly with the release of US inflation data tomorrow at 15:30 GMT+3. It is possible that the data will indicate rising inflation (as it did in Australia this week), and the US dollar will strengthen further, pushing the USD/JPY rate even higher – potentially prompting another intervention by the Bank of Japan.
Be prepared for possible spikes in volatility.
Trade over 50 forex markets 24 hours a day with FXOpen. Take advantage of low commissions, deep liquidity, and spreads from 0.0 pips (additional fees may apply). Open your FXOpen account now or learn more about trading forex with FXOpen.
This article represents the opinion of the Companies operating under the FXOpen brand only. It is not to be construed as an offer, solicitation, or recommendation with respect to products and services provided by the Companies operating under the FXOpen brand, nor is it to be considered financial advice.
Stay ahead of the market!
Subscribe now to our mailing list and receive the latest market news and insights delivered directly to your inbox.


Latest articles

Market Analysis: GBP/USD Dips Further As EUR/GBP Regains Traction
GBP/USD failed to climb above 1.3500 and corrected some gains. EUR/GBP started a decent increase and might aim for more gains above 0.8700.
Important Takeaways for GBP/USD and EUR/GBP Analysis Today
· The British Pound


Market Insights with Gary Thomson: Oil, US Retail Sales & NFP in Focus
In this video, we’ll explore the key economic events and market trends, shaping the financial landscape. Get ready for insights into financial markets to help you navigate the week ahead. Let’s dive in!
In this episode of Market