


FXOpen

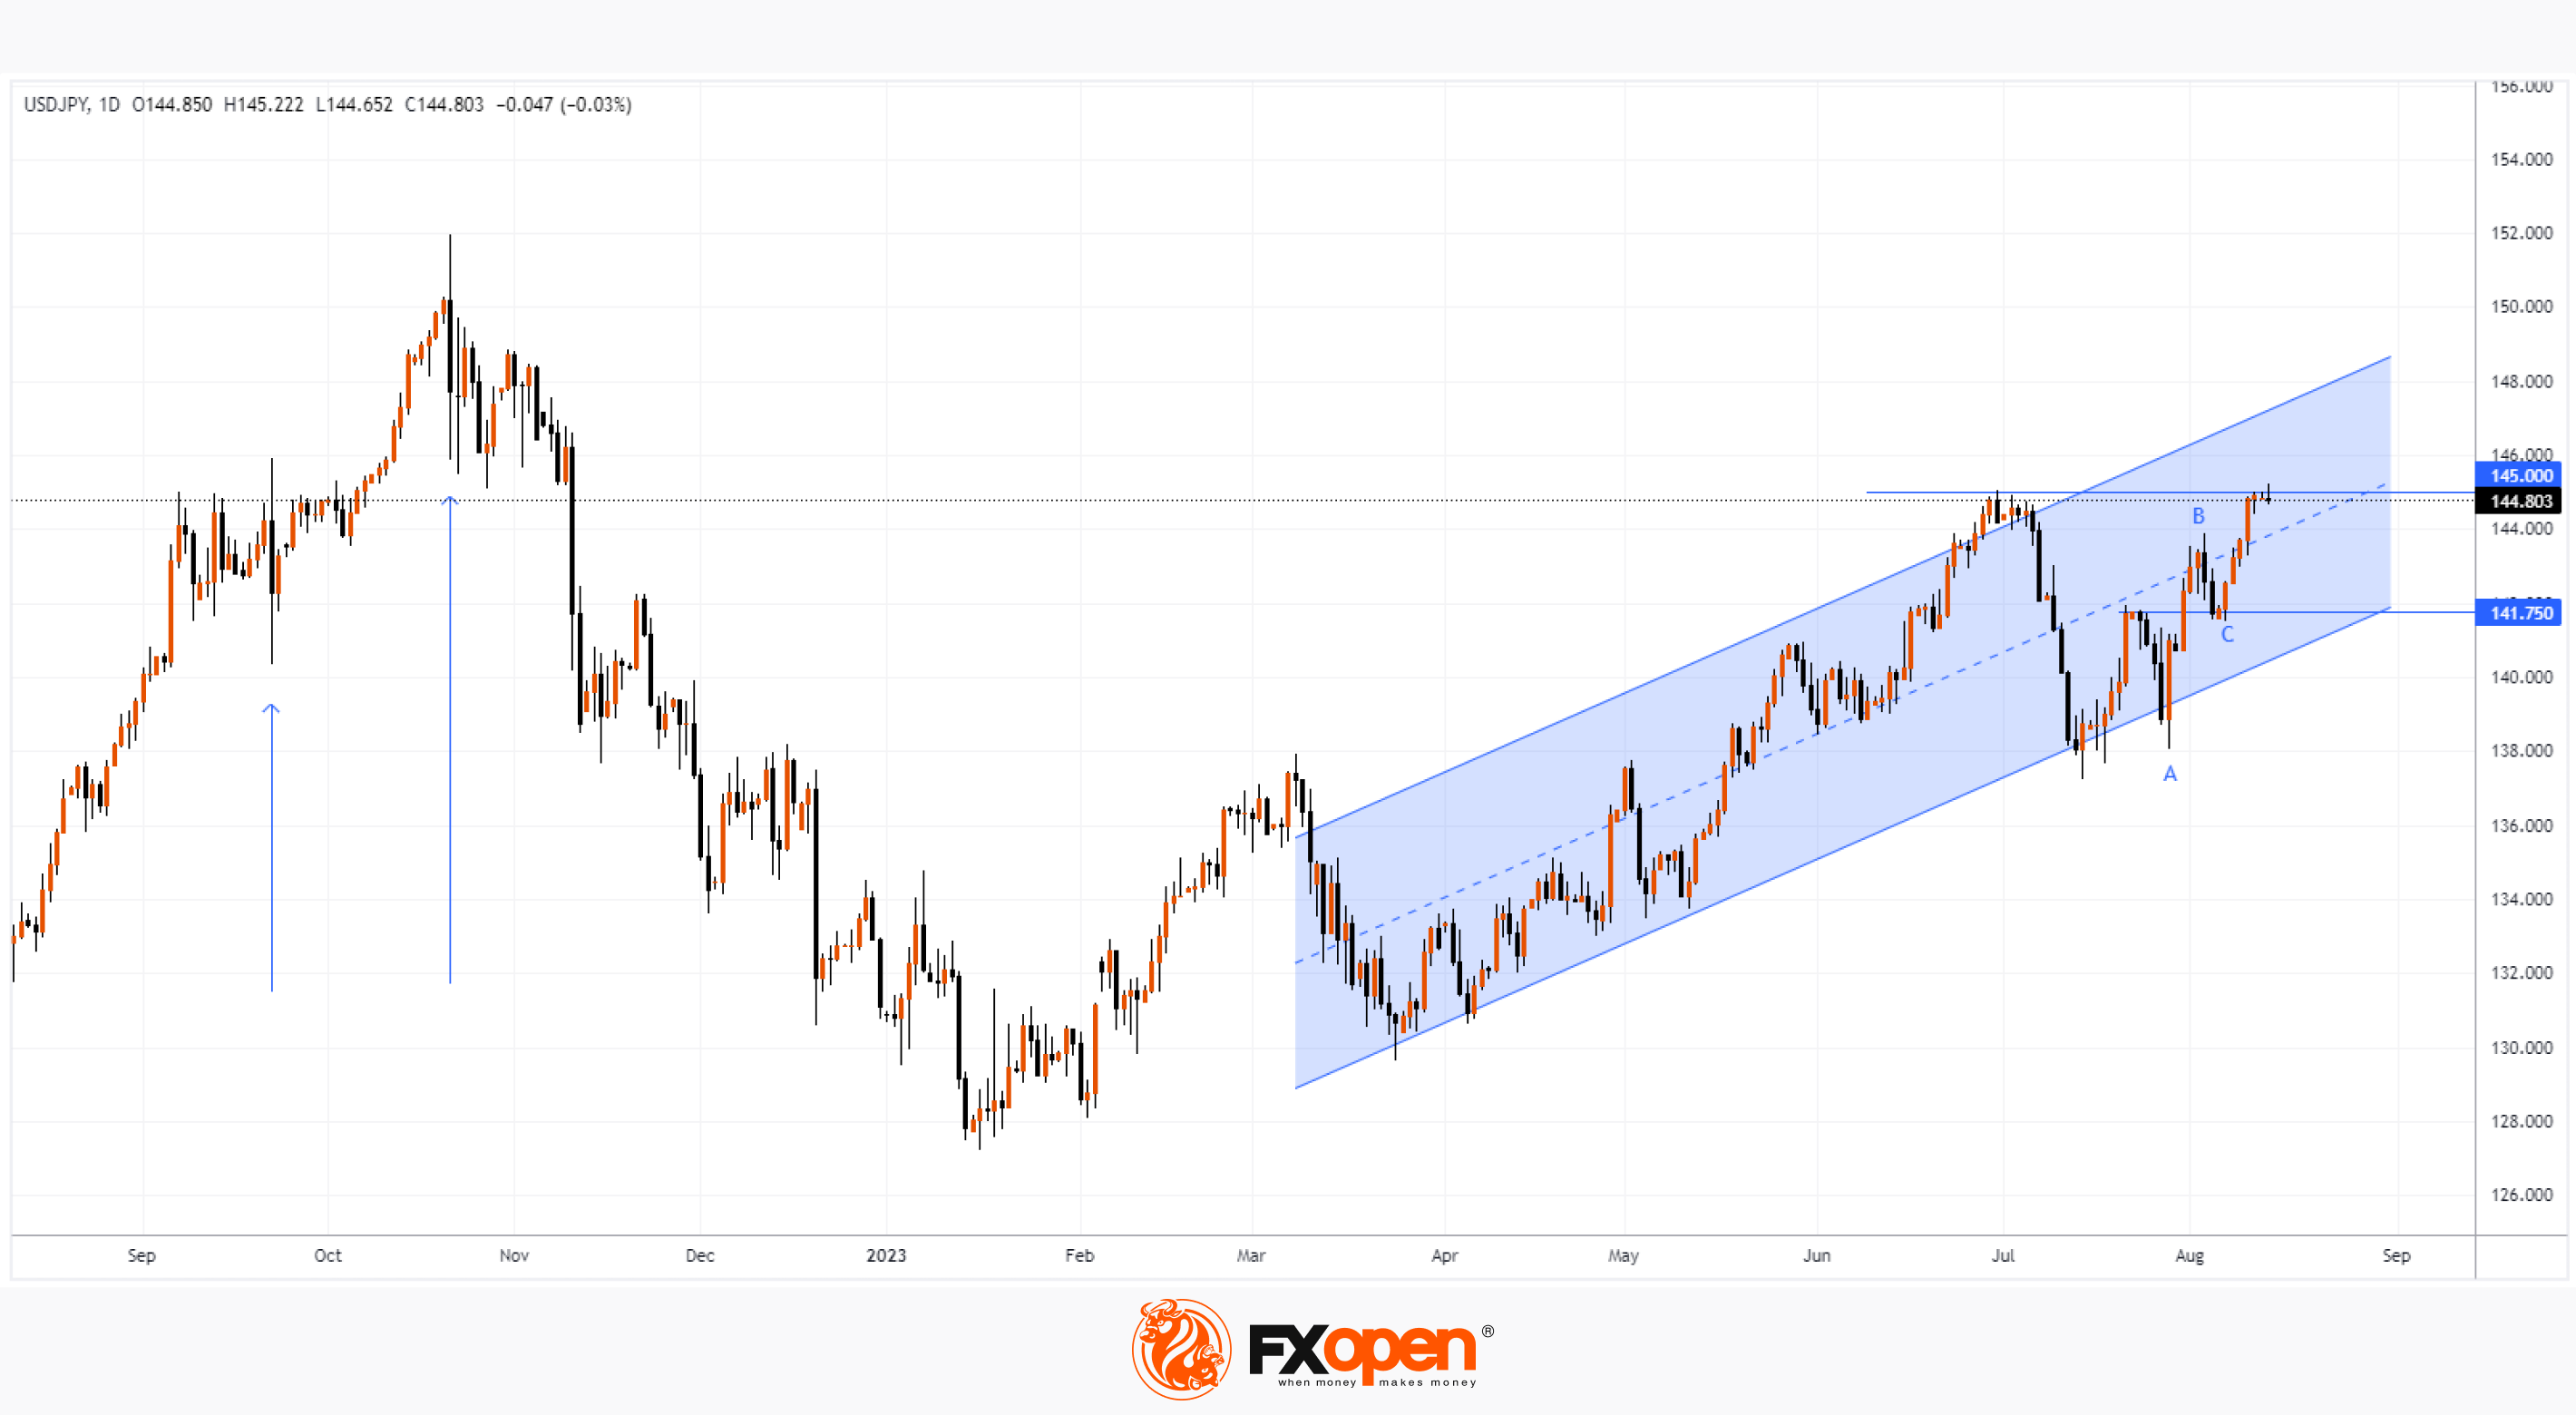
The uptrend in 2023 is due to the difference in the monetary policy of the Bank of Japan and the US Federal Reserve. As the chart shows, USD/JPY hit 145.22 yen per US dollar today. The last time such a rate was relevant was in November 2022 after foreign exchange interventions (marked with arrows).
Since the USD/JPY rate has again reached the level of 145 yen per US dollar, which is important for the Japanese authorities, traders expect official warnings regarding interventions, but there are none yet. Reuters reports the words of Joey Chu, head of Asian currency research at HSBC: "We believe that the Treasury will start moving in the 145-148 range."
Bullish arguments:
→ The ability of the exchange rate to recover from a sharp fall in early July indicates the strength of demand in the market.
→ The chart shows that the rate has not yet reached the upper limit of the ascending channel.
→ B→C retracement after A→B advance was less than 50%.
→ Central bank monetary policy differentials are unlikely to change any time soon.
Bearish arguments:
→ Presumably, traders may take profits from long positions, fearing currency interventions, which will slow down the current bullish trend.
→ This morning there was a false breakdown of June-July highs to force sellers to close positions and lure buyers in the wrong direction.
Important news calendar for USD/JPY (GMT+3):
→ data on inflation in Japan - on Friday, at 2:30;
→ US retail sales data - Tuesday at 15:30;
→ FOMC minutes - Wednesday at 21:30;
→ US labor market data - Thursday at 15:30.
Important levels:
→ support from the median line of the uplink;
→ psychological mark of 145 yen per US dollar;
→ support for 141.75.
Trade over 50 forex markets 24 hours a day with FXOpen. Take advantage of low commissions, deep liquidity, and spreads from 0.0 pips (additional fees may apply). Open your FXOpen account now or learn more about trading forex with FXOpen.
This article represents the opinion of the Companies operating under the FXOpen brand only. It is not to be construed as an offer, solicitation, or recommendation with respect to products and services provided by the Companies operating under the FXOpen brand, nor is it to be considered financial advice.
Stay ahead of the market!
Subscribe now to our mailing list and receive the latest market news and insights delivered directly to your inbox.


Latest articles

Weak Data Weigh on the Dollar: Market Awaits Trend Confirmation
The US dollar is retreating from recent highs, moving into a moderate correction after a prolonged period of gains. Pressure on the currency is building amid weaker-than-expected macroeconomic data, while market participants adopt a wait-and-see approach ahead of key labour

Market Analysis: EUR/USD Aims Recovery While USD/JPY Gives Back Recent Gains
EUR/USD is recovering losses from 1.1450. USD/JPY is correcting gains from 160.50 and might decline further below 158.00.
Important Takeaways for EUR/USD and USD/JPY Analysis Today
· The Euro struggled to stay in a

European Currencies Decline: Pound Hits New Lows, Euro Under Pressure
European currencies continue to weaken against the US dollar amid rising geopolitical tensions and increased demand for safe-haven and liquid assets. Market participants are reducing exposure to riskier instruments, putting pressure on both the euro and the pound. Additional support