FXOpen

The most common methods to analyse currency pairs are fundamental and technical analysis. To trade stock CFD, you may need to perform a more comprehensive analysis. Aside from fundamental factors such as global economic conditions, industry health, internal news, and technical analysis, including indicators and patterns, traders may also evaluate a company’s financial metrics, including P/E, D/E, PEG, ROE, and P/B ratios. Want to learn how to know if a stock is overvalued? Find the answer in our article.
Note: Stock CFD trading differs from stock investing. When trading stock CFDs, you don’t buy or sell a company share, which means stock CFDs don’t result in the physical delivery of the relevant underlying asset, but forecast a stock price direction and value. CFD trading allows traders to gain on the rise and fall of the price and enter the market with an affordable sum. Check stock CFD trading conditions on FXOpen.
Basic Terms
Before you learn how to tell if a stock is overvalued, it would be helpful to clarify what overvalued and undervalued mean.
Intrinsic Value
The first term you should learn is intrinsic (fair) value. An intrinsic value is the real value of an asset — how much an investor would pay for it.
It’s measured with a complex financial model or objective calculation. When analysing stocks, investors usually consider the cash flow. Generally speaking, a corporation’s internal metrics determine its stock value, so any internal factor can be applied to evaluate an asset’s fair value. This leads us to the conclusion that the intrinsic value is subjective, as investors consider various metrics when determining it.
The intrinsic value always differs from the current asset price. It’s where overvalued and undervalued terms appear.
Undervalued
An undervalued asset is an asset that is sold for less than its fair value. In most cases, the price doesn't fall to zero; in time, it rises back to the asset's intrinsic value.
Overvalued (overpriced)
An overvalued asset is an asset whose current price exceeds its fair value. The price can't rise to infinity, so it will fall in time to reach its fair value.
When Is a Stock Overvalued?
There are various reasons for stock overpricing. The most common ones are:
- Overall Market Sentiment
Market sentiment is a key factor for trading. It’s analysed in stock, crypto, indices, ETF, commodity, and Forex trading. Overall stock market fluctuations affect individual stocks. For example, the stock market may rise if macroeconomic conditions are positive. As such, the country's positive inflation rate may push the American stock market and each trading stock.
- Industry
Industry conditions may also affect the company’s shares. Positive news about industry development may trigger a rise in an individual stock value.
- Internal Events
A corporation’s internal events, such as entry into a new market or mergers and acquisitions, may attract investors and push its stocks.
- Cyclical Fluctuations
It’s believed that in particular months stocks rise more than average. Still, there are many doubts about the veracity of this approach. For instance, it’s believed that the stock market increases at the beginning of January. Still, if we compare times when the market rose and fell in January, the difference we see will be tiny.
- Earnings Report
Earnings reports include the essential metrics, considering which investors determine the company’s financial health and perspectives. If a corporation performs well, its stocks will likely rise. The reports are released on specific dates making rate forecasting easier.
How Do You Know If a Stock is Overvalued?
Reasons behind a price imbalance are less important than ways of determining when the stock is overpriced. The methods vary depending on whether you are a trader or an investor. The latter performs a more comprehensive analysis. Traders usually focus on the following metrics, which are established in earnings reports.
- Price-to-Earnings Ratio (P/E)
Price-to-earnings is a ratio between a share value and the earnings a shareholder could get per share. To calculate the P/E, traders divide the share price per unit by earnings per share.
To evaluate whether a stock is overpriced, traders compare a company’s ratio to its peers or historical data. If the ratio is higher, it’s more likely the stocks are overpriced, which means that investors pay more than they will receive as dividends.
- Price/Earnings-to-Growth (PEG) Ratio
The price/earnings-to-growth ratio is similar to the price-to-earnings ratio, but it considers the growth of earnings. It is said that a ratio above one stands for overpriced stocks.
- Debt-to-Equity (D/E) Ratio
The debt-to-equity ratio compares a corporation's liabilities and assets. It's calculated as a division of a company's total debt by its shareholders' equity. Similar to the previous metric, traders compare different companies to identify whether the ratio is high or low. Usually, a high ratio tells a trader that the corporation has more debt than its competitors. It may be considered as a signal of overpriced stocks.
- Return-on-Equity (ROE) Ratio
To calculate the ROE, a trader divides a company's net income by shareholders' equity. This metric shows how effective the firm is in generating profits.
If the return-on-equity ratio is low, the stocks may be overpriced as the corporation's net income is lower than shareholder investments.
- Price-to-Book (P/B) Ratio
A price-to-book ratio is used to determine a stock's fair value. The ratio places the stock's current market rate against the company's book value. The book value is calculated by subtracting the total liabilities from the total assets divided by the number of shares. Usually, a P/B value above one indicates stocks are overpriced.
- Technical Analysis
CFD traders often use a company’s financial data and technical indicators. When trading on short-term timeframes, the abovementioned metrics are ineffective as they don’t provide entry and exit points.
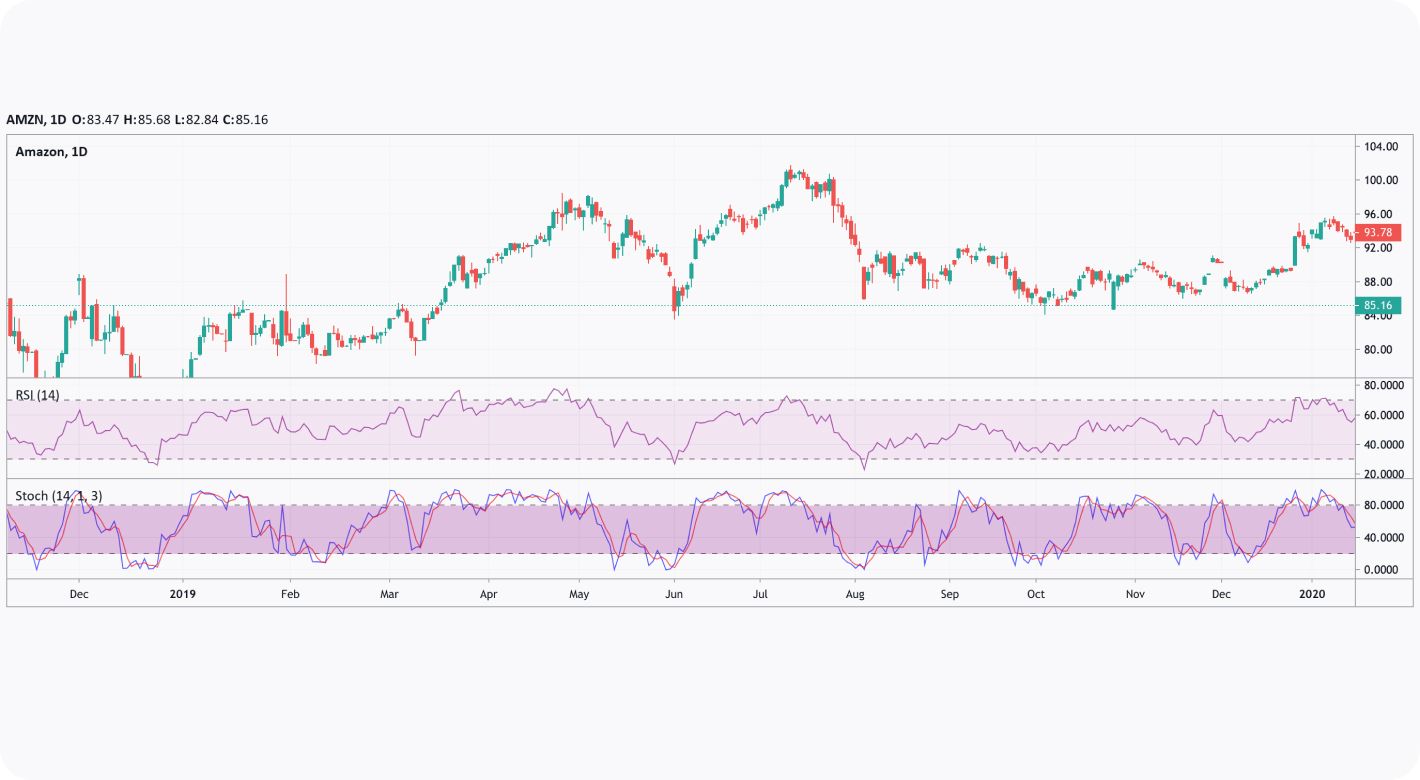
Oscillators may be an effective tool when talking about overvalued and undervalued assets — they reflect conditions when an asset is overbought and oversold. To determine an overpriced stock, you could check whether an oscillator says the asset is overbought. Conversely, if the indicator is in the oversold area, the stock is undervalued.
The relative strength index and stochastic are common oscillators that reflect when an asset is overbought or oversold. Let’s look at how to determine if a stock is undervalued or overvalued. An indicator has certain zones that reflect overbought and oversold conditions. For the RSI, they are 70 and 30; for the Stochastic, they are 80 and 20.

That is, if you need to know whether a stock is overpriced, you may check whether the RSI is above 70 or the Stochastic is above 80. When looking for an underpriced stock, you may consider the RSI below 30 and the Stochastic below 20. You can examine these indicators on a risk-free demo account.
Why Do I Need to Know If It Is an Overvalued or Undervalued Stock?
Investors use the information about the stock pricing to determine whether their investment will be profitable. As for traders, this information is helpful when identifying future stock direction. If stocks are overpriced, traders may consider opening a sell trade or closing a buy one. Knowing that stocks are undervalued, traders may open a buy position or close a sell one. The TickTrader platform may help you start practising.
This article represents the opinion of the Companies operating under the FXOpen brand only. It is not to be construed as an offer, solicitation, or recommendation with respect to products and services provided by the Companies operating under the FXOpen brand, nor is it to be considered financial advice.
Stay ahead of the market!
Subscribe now to our mailing list and receive the latest market news and insights delivered directly to your inbox.


