


FXOpen
In the fast-moving realm of forex and CFD trading, the ability to identify important chart patterns is essential for making informed decisions. One particular pattern that traders frequently seek is the four-price Doji. This article will explore what the setup entails, how to identify it on a chart, the trading strategies associated with it, and how it differs from similar patterns.
What Is a 4-Price Doji Pattern?
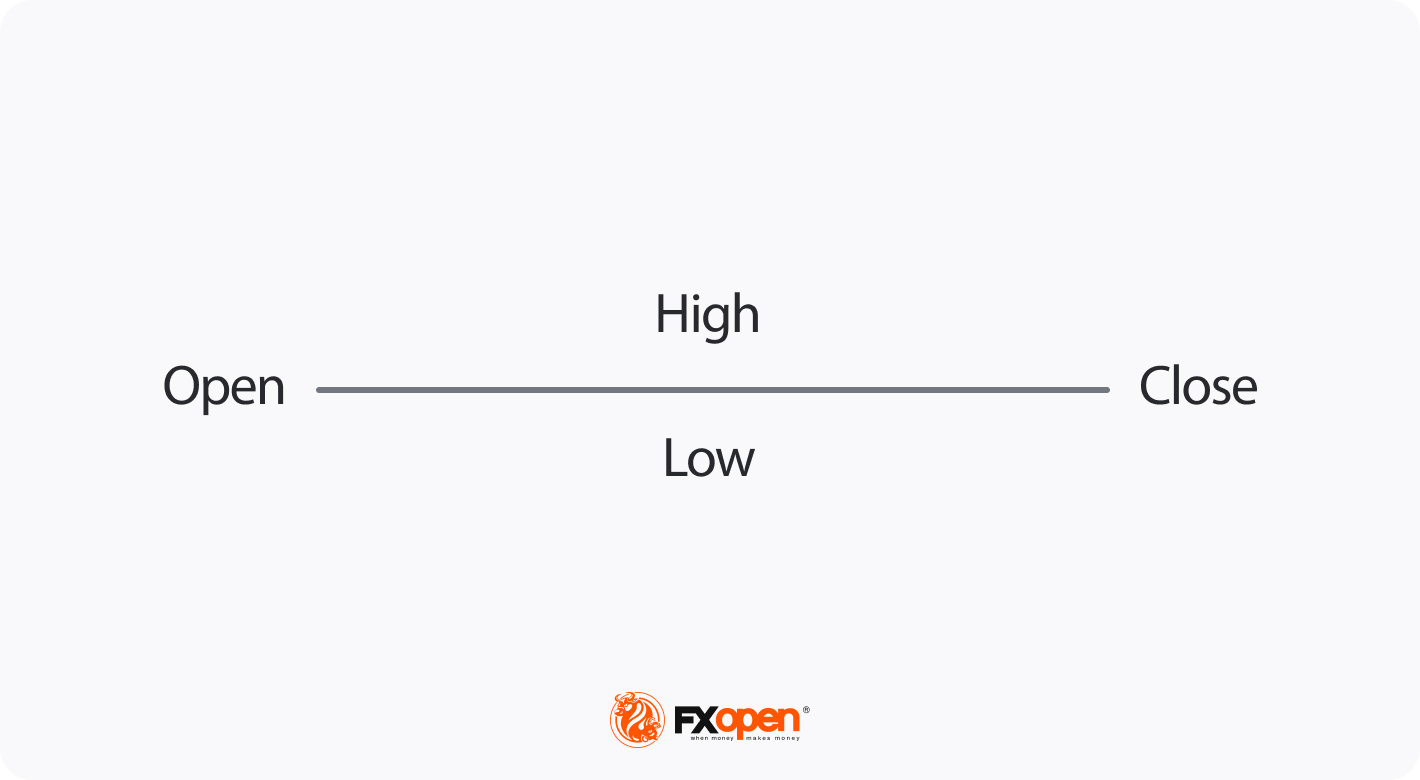
The four-price Doji is a type of candlestick pattern in technical analysis, which is characterised by open, high, low, and close prices located at the same level. This pattern represents extreme market indecision and is typically observed in markets with very low volatility or during periods of low trading volume, such as pre-market or after-hours trading. Traders should remember that the setup does not mean getting 4 Doji candlesticks in a row; rather, the number four refers to the number of prices in the pattern.
How to Spot the 4-Price Doji Candlestick in the Chart
To spot the setup on a price chart, traders may look for the following characteristics:
- Open, high, low, and close prices that are all at the same level.
- The candle appears as a horizontal line or a dash (—) on the chart, indicating that the market has made no significant price movement during the trading period.
- This pattern is often seen in flat or sideways markets where the asset's price remains virtually unchanged.
How Can You Trade the Four-Price Dojis?
Here are general rules for identifying potential entry, take-profit, and stop-loss levels. It’s vital to remember that this pattern doesn’t provide accurate reversal or continuation signals.
- Entry: When using the setup for entry, consider the context in which it appears. It may be part of a larger, more reliable candlestick pattern, such as a morning Doji star. For a bullish entry, look for the 4-price Doji formation after a downtrend, preferably in combination with other bullish reversal signals. For a bearish entry, look for the setup after an uptrend in combination with other bearish reversal signals.
- Take Profit: You may set a take-profit order at a predetermined price level that aligns with your trading strategy or the potential reversal target. Use technical indicators or support/resistance levels to identify areas where you expect price reversals or significant price moves.
- Stop Loss: Set a stop-loss order where you are comfortable with the amount of potential loss in case the trade goes against you. Consider using support and resistance levels, technical indicators, or the distance from your entry point to determine an appropriate stop-loss level based on the risk/reward ratio.
Live Market Example
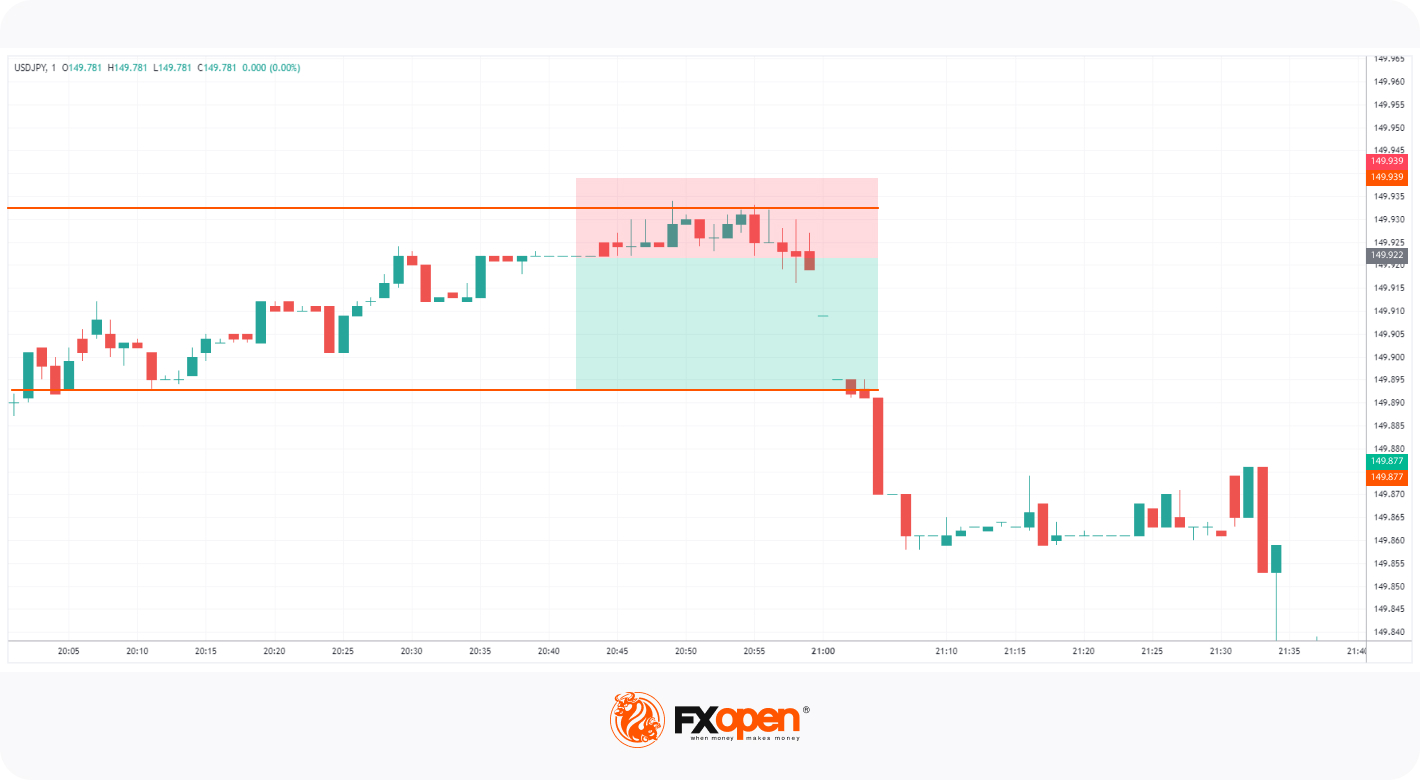
A trader observes the setup on the one-minute chart of the USD/JPY pair on the TickTrader platform by FXOpen. They do not use additional indicators for confirmation and enter the trade as soon as the second candle closes with open, high, low, and close prices that are all at the same level as the previous bar. They set the take profit at the closest support point with the stop loss above a resistance level.
4-Price Doji and Other Doji Types
Although all Doji candles reflect market uncertainty, some of them may provide more accurate signals. Let’s consider the other 4 Doji types used by traders worldwide.
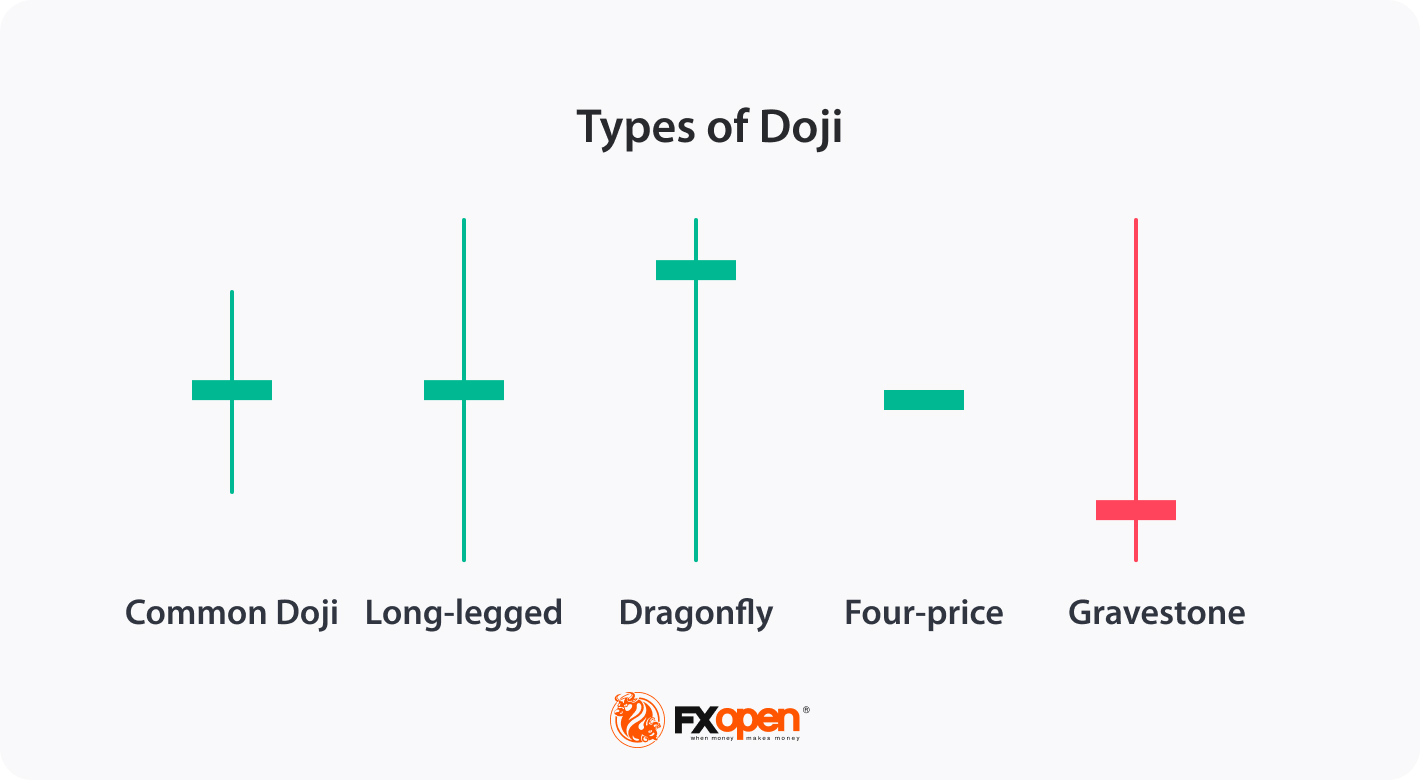
Doji Star
The Doji star is a three-candle pattern, where the second candlestick is a classic Doji characterised by a small body with long upper and lower wicks, symbolising indecision and a potential reversal in market direction. The Doji star suggests potential reversals depending on whether it follows an uptrend or a downtrend.
Gravestone Doji
The gravestone Doji is distinctly bearish, with a long upper wick and no lower wick, and often appears after an uptrend, indicating the potential for a bearish reversal. The critical distinction lies in their bias, as the 4-price Doji lacks a predefined direction, whereas the gravestone Doji strongly hints at a shift to bearish sentiment.
Dragonfly Doji
The dragonfly Doji, with its long lower wick and close near the high, indicates a bullish inclination. It often appears after a downtrend, suggesting a potential bullish reversal.
Long-Legged Doji
The long-legged candle is characterised by upper and lower wicks significantly longer than those of a standard Doji. While neither the 4-price Doji nor the long-legged Doji conveys a specific bullish or bearish bias, the long-legged formation’s distinctive feature is its portrayal of heightened volatility and indecision, making it more about market uncertainty than price equality.
Final Thoughts
Gaining a thorough understanding of chart patterns, including the 4-price Doji, is fundamental to making well-informed choices within the forex and CFD trading arena. This formation, with its unique equality of open, high, low, and close prices, serves as a powerful signal of extreme market indecision and is used alongside other technical indicators for a more comprehensive understanding of market sentiment and potential reversals. If you want to test strategies with this pattern, you may open an FXOpen account to trade in various markets.
This article represents the opinion of the Companies operating under the FXOpen brand only. It is not to be construed as an offer, solicitation, or recommendation with respect to products and services provided by the Companies operating under the FXOpen brand, nor is it to be considered financial advice.
Stay ahead of the market!
Subscribe now to our mailing list and receive the latest market news and insights delivered directly to your inbox.


Latest articles

BTC/USD Analysis: Bitcoin Tests Key Support
Today, BTC/USD is trading slightly below the psychological $70k level. Assessing its price action since the panic on 5 February, it is reasonable to suggest that the market is showing signs of range-bound behaviour: sellers tend to emerge near

The EUR/AUD Pair Rose by More Than 2% Over the Week
If last Thursday trading was taking place below the 1.6300 level, today one euro is worth more than 1.6660 Australian dollars. The upward trend seen in recent days has been driven by a combination of factors, including:
→ Bullish

Silver Price Falls Back Below $70
As can be observed on the XAG/USD chart, the price of silver has once again dropped below the psychological $70 level. At the same time, this week has been marked by sharp fluctuations: on Monday, prices traded below $65,