


FXOpen

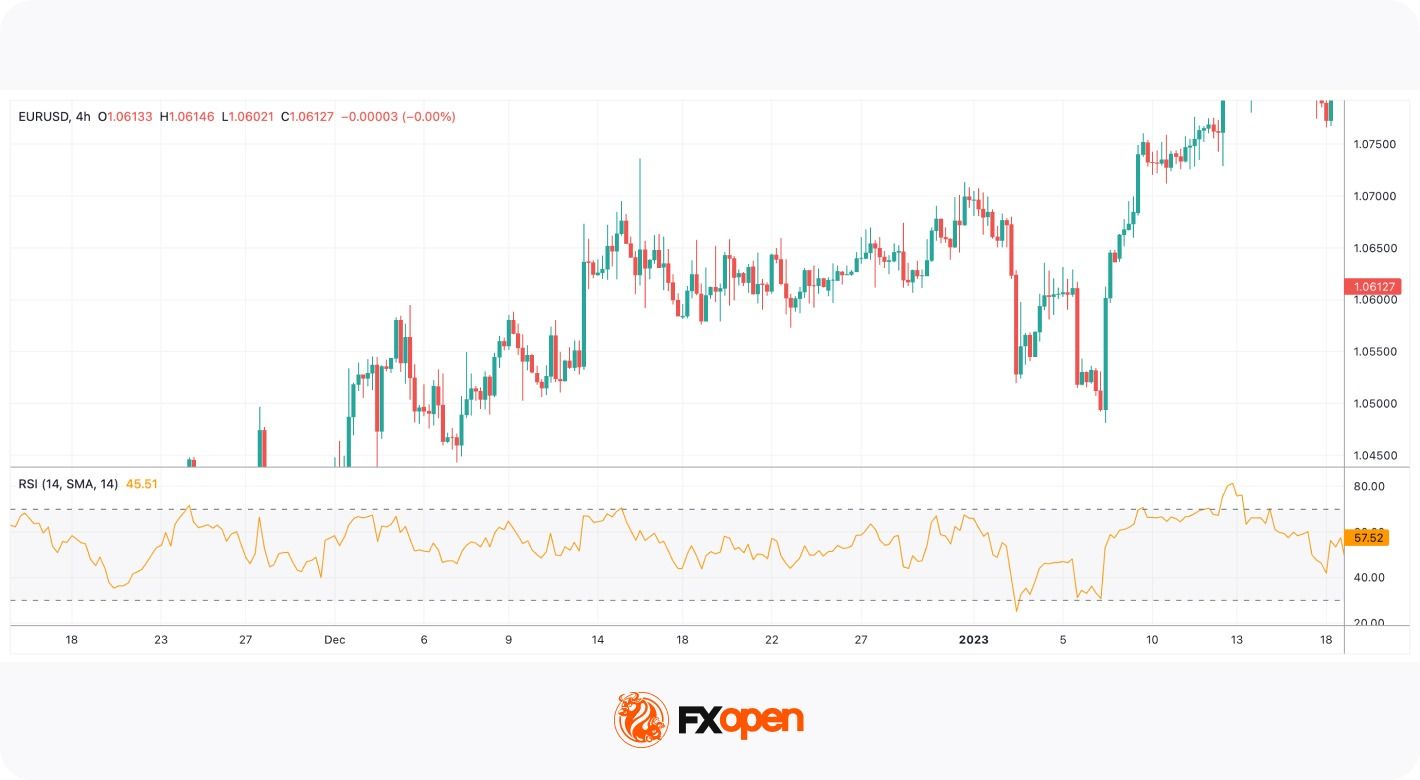
RSI is a popular momentum indicator in technical trading across forex, stock, and cryptocurrency* markets. The Relative Strength Index (RSI) is a momentum oscillator developed by J. Welles Wilder that measures the speed of price movements on a 0–100 scale. Traders use it to detect overbought/oversold conditions, trend strength, pullbacks, and exhaustion.
Although often viewed as a basic oscillator, the RSI plays a more nuanced role in professional trading strategies, particularly when combined with trend and volatility indicators. Understanding how the RSI behaves in different market environments may help traders refine entries, implement risk management strategies, and confirm trade setups.
In this article, we will consider how the RSI indicator works, how it is calculated, and how it can be applied in practical trading strategies across multiple asset classes.
Takeaways
- The Relative Strength Index (RSI) is a momentum indicator that measures the speed and magnitude of recent price movements to evaluate whether an asset is overbought or oversold.
- Developed by J. Welles Wilder, the RSI is plotted on a scale from 0 to 100 and is most commonly calculated over a 14-period timeframe.
- At its core, the RSI compares the average size of recent gains with the average size of recent losses over a defined period.
- Traditionally, RSI trading rules suggest that readings above 70 indicate overbought conditions, while readings below 30 signal oversold levels.
- Besides overbought and oversold signals, the indicator can provide divergence, trend strength, and failure swings signals.
What Is the Relative Strength Index?
The Relative Strength Index (RSI) is a momentum oscillator in modern technical analysis. Developed by J. Welles Wilder Jr. and introduced in 1978 in New Concepts in Technical Trading Systems, the indicator measures the speed and magnitude of recent price movements in order to evaluate underlying market momentum.
The RSI is plotted on a scale from 0 to 100 and is classified as an oscillator because it fluctuates within a fixed range rather than following price directly. This structure allows traders to evaluate whether buying or selling pressure is strengthening or weakening relative to recent market activity.
In practice the RSI functions less as a reversal indicator and more as a momentum persistence gauge. In directional markets the oscillator spends extended time in one half of its range, reflecting order-flow imbalance rather than exhaustion. Professional traders therefore interpret extreme readings as trend participation signals unless market structure begins to break.
Although the RSI is often introduced as a simple overbought-oversold tool, its practical application in professional trading is considerably broader. In leveraged markets such as forex and CFDs, traders use the indicator to identify pullbacks within trends, detect momentum divergence, and refine entry timing across multiple timeframes. The RSI therefore functions less as a standalone signal generator and more as a contextual momentum filter within broader trading systems.
The RSI belongs to the family of bounded momentum oscillators introduced by J. Welles Wilder in New Concepts in Technical Trading Systems (1978), alongside the average true range (ATR), the average directional movement index (ADX), and the parabolic stop and reverse (Parabolic SAR).
RSI Formula and Calculation
How is RSI calculated? It’s quite difficult to calculate the RSI. Fortunately, you don’t need to do it manually, as it’s one of the standard indicators implemented in most trading platforms. For instance, you can use TickTrader to examine the RSI without making complicated calculations.
However, it’s worth understanding how the indicator is measured to know which metrics can affect its performance.
The RSI Formula Explained
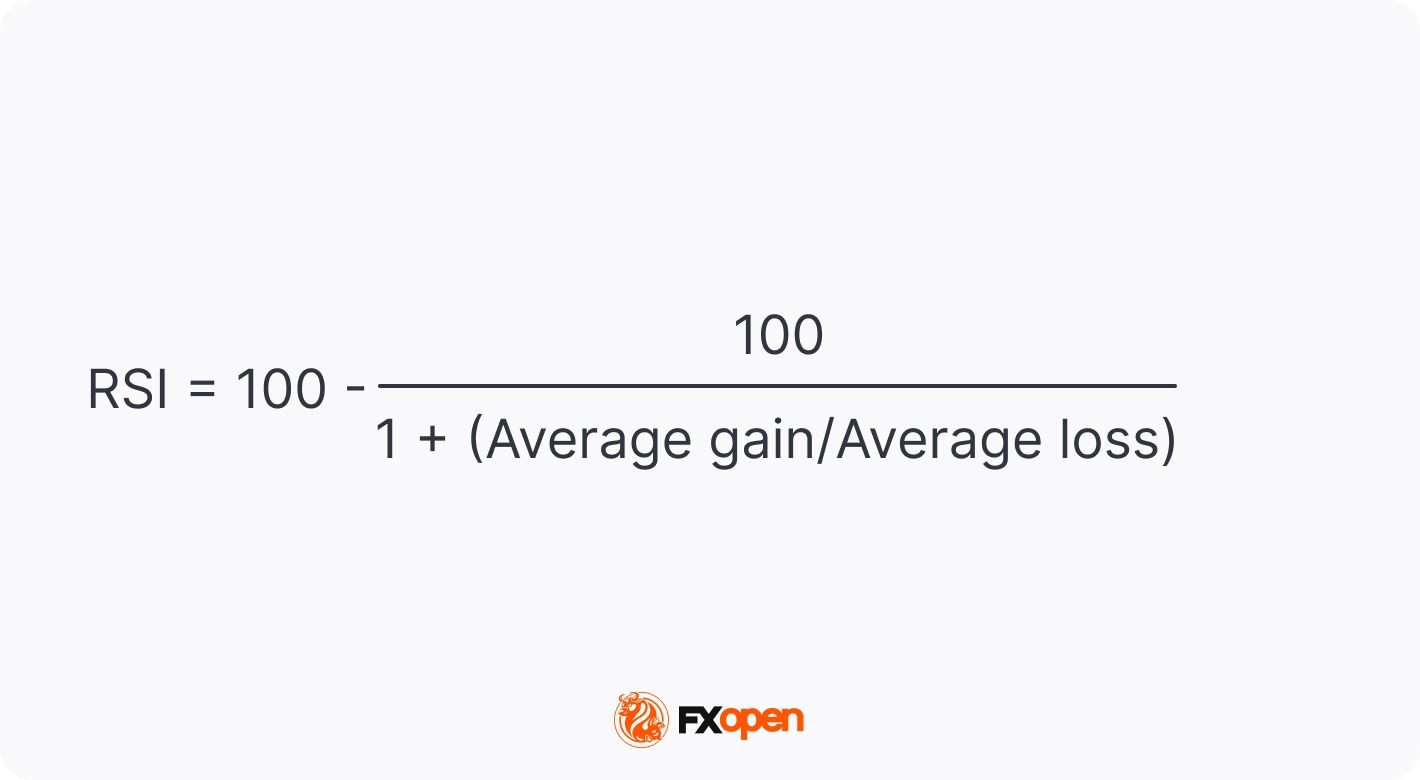
The calculation involves three main steps. First, the average gain and average loss over the selected period are determined. Second, these values are used to calculate relative strength, defined as the ratio of average gains to average losses. Finally, this ratio is transformed into an index value between 0 and 100 using the RSI formula.
The most popular RSI period is 14, meaning its values are based on closing prices for the latest 14 periods, regardless of the timeframe. We will use this period as an example of RSI calculations.
The standard RSI formula description:
Step 1: Average Gain and Average Loss
To calculate average gains and losses, you need to calculate the price change from the previous period.
Note: If the current price is higher than the previous one, add the gain to a total gain variable. If the price declined from the previous period, add the figure to a total loss variable.
After you calculate the change for all 14 periods, you need to add up the gains and divide them by 14 and sum up the losses and divide the total by 14.
Step 2: Calculate the Relative Strength (RS)
RS = Average Gain / Average Loss
To calculate the relative strength, divide the average gain by the average loss.
Step 3: Calculate the RSI
Now that you calculated the RS, you can proceed with the RSI value. For this, you need to add 1 to RS, divide 100 by the sum, and subtract the result from 100.
Relative Strength Index = 100 – 100 / (1 + RS)
Because the calculation uses smoothed averages of gains and losses, the RSI reacts to volatility contraction faster than to volatility expansion. This asymmetry explains why the indicator often gives early signals near market tops but delayed signals near lows.
What RSI Setting Do Traders Use?
The standard period is 14. Shorter lookback periods produce a more sensitive indicator that reacts quickly to price changes but generates more noise. Longer periods smooth out fluctuations but may lag behind rapid market shifts. This trade-off explains why RSI settings are often adjusted according to strategy type, whether scalping, day trading, or swing trading.
The following adjustments are common depending on strategy and timeframe:
Scalping strategies often use shorter RSI periods to capture rapid momentum shifts on lower timeframes. While this increases signal frequency, it also requires stricter risk management due to higher noise levels.
Want to learn how to read the RSI indicator signals?
How Is the RSI Indicator Used in Trading?
How to interpret the RSI indicator? There are four common ways to use the RSI indicator when trading: spot overbought and oversold conditions, find price divergences, implement failure swings for reversal signals, and determine market trends.
Relative Strength Index: Overbought/Oversold Indicator
The traditional interpretation of RSI levels focuses on the 70 and 30 thresholds. Readings above 70 are commonly described as overbought, while readings below 30 are considered oversold. However, in professional trading environments these thresholds are treated as reference zones rather than absolute signals.
The 70/30 framework works primarily in rotational markets. During macro-driven trends, price commonly continues moving after entering overbought or oversold territory because positioning flows dominate short-term mean reversion. In these conditions the RSI defines pullback zones rather than reversal zones.
During sustained uptrends, the RSI typically fluctuates between 40 and 80 (sometimes reaching 90 in very strong trends). Pullbacks often hold above 40, showing that bullish momentum remains intact. In sustained downtrends, the RSI usually ranges between 20 and 60, with rallies failing near 60, reflecting persistent selling pressure. These shifting RSI ranges may help traders assess trend strength rather than relying solely on the traditional 70/30 overbought–oversold levels.
Sustained RSI range shifts usually reflect systematic positioning rather than retail momentum. When the oscillator establishes a higher equilibrium range, dips towards the mid-zone often coincide with passive liquidity absorption rather than trend rejection.
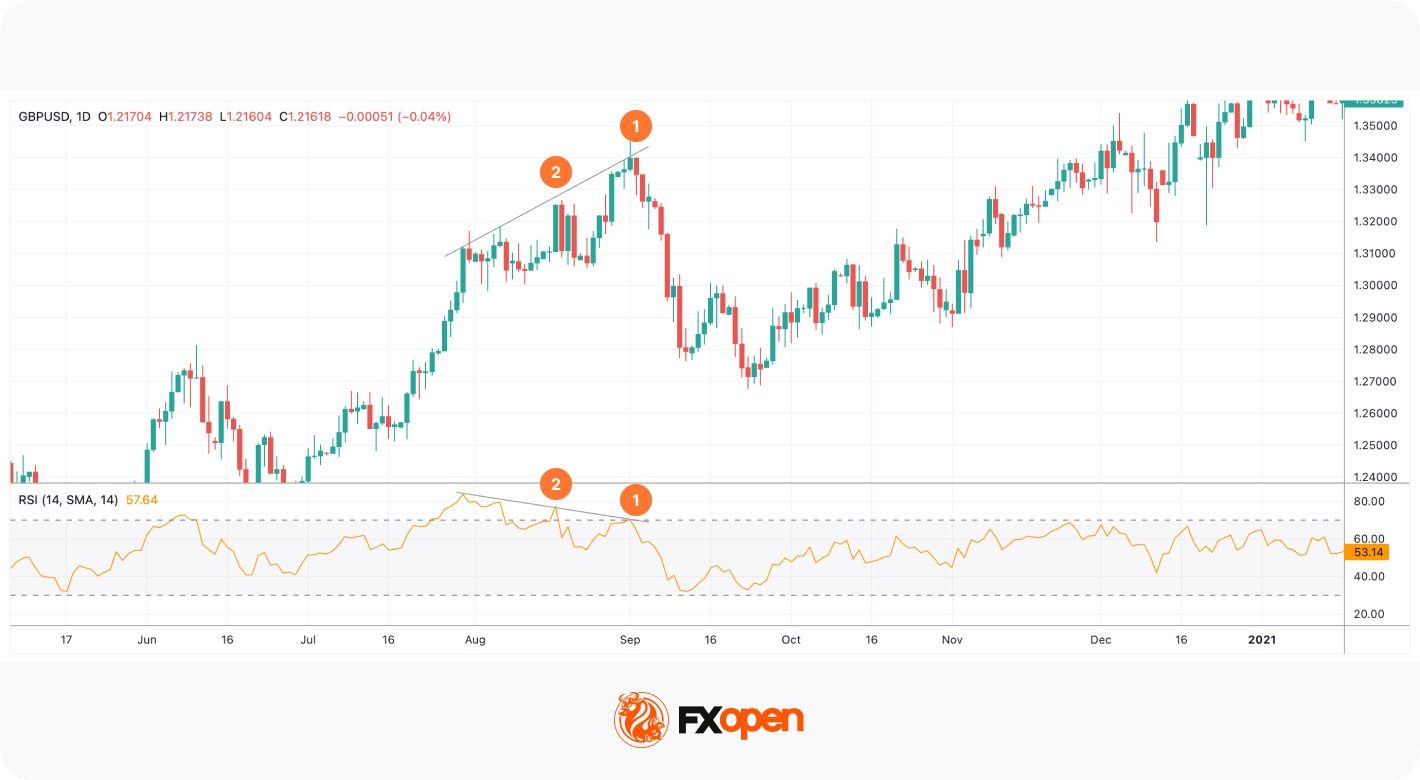
On the daily chart of the GBP/USD pair, the RSI entered the oversold area on 22nd April, left it for a while on 4th May, but returned to it and continued moving upwards only on 15th May.
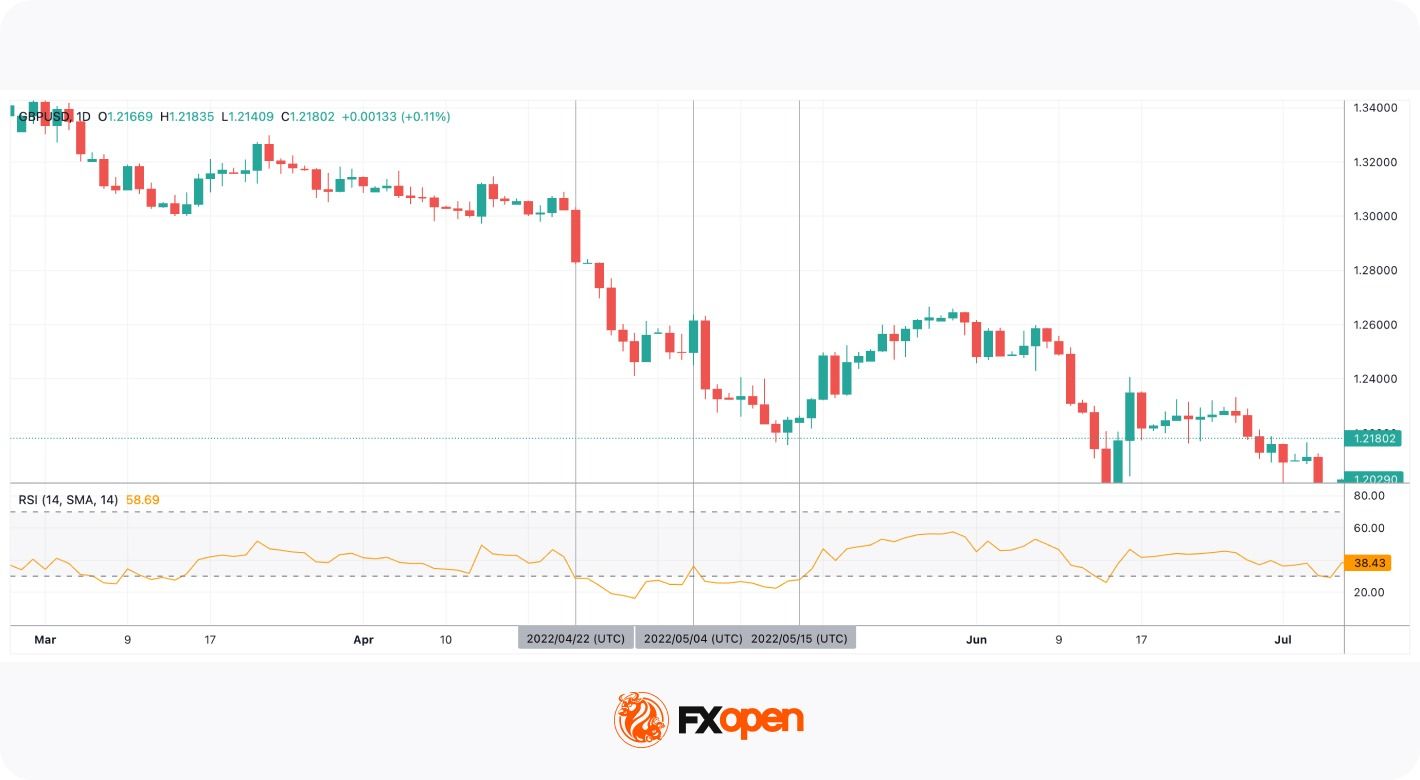
Additionally, when using overbought/oversold signals, traders keep in mind that they can reflect an upcoming correction, not a trend reversal. The GBP/USD pair was trading in a strong downtrend, and the RSI provided a signal of a short-term correction only.
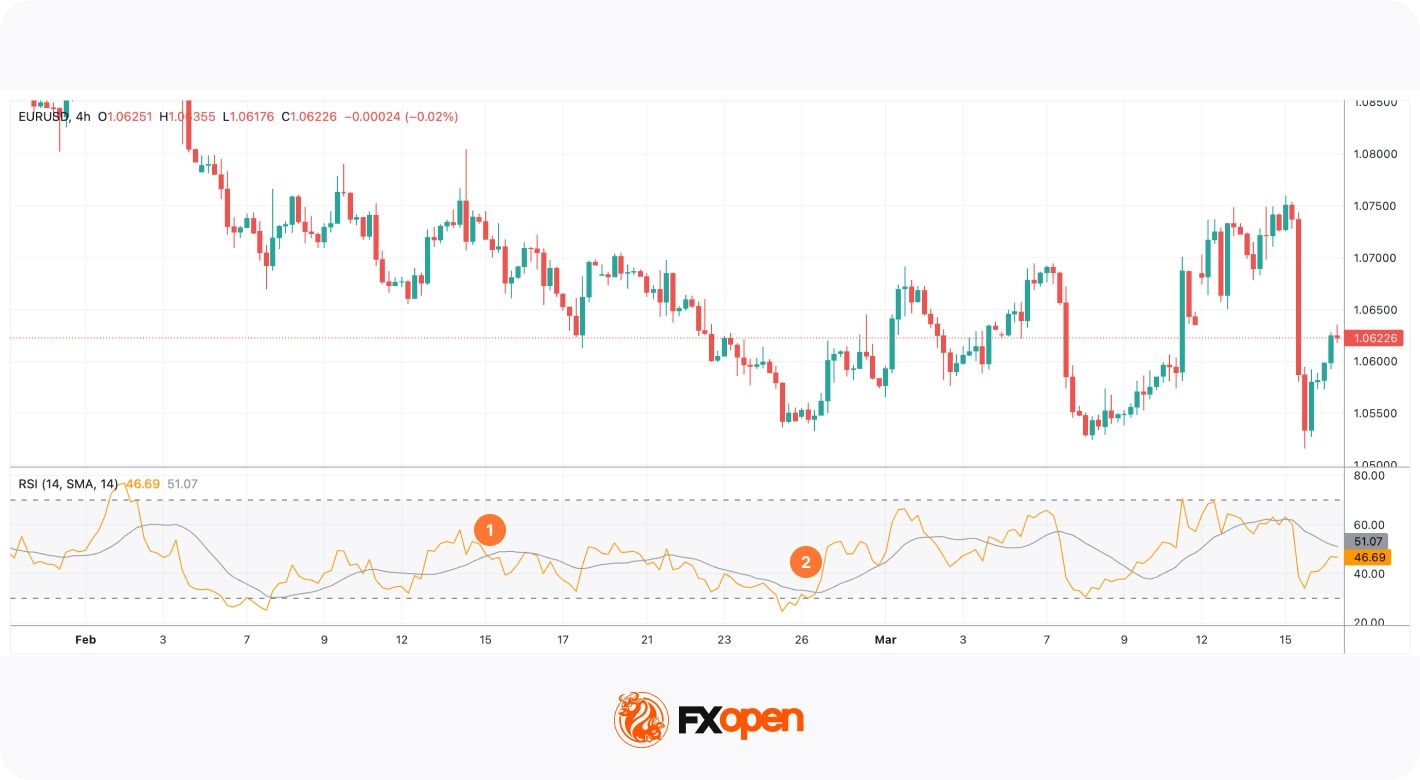
To distinguish between corrections and reversals, traders combine the RSI with other tools. A cross of a moving average can confirm a change in the trend.
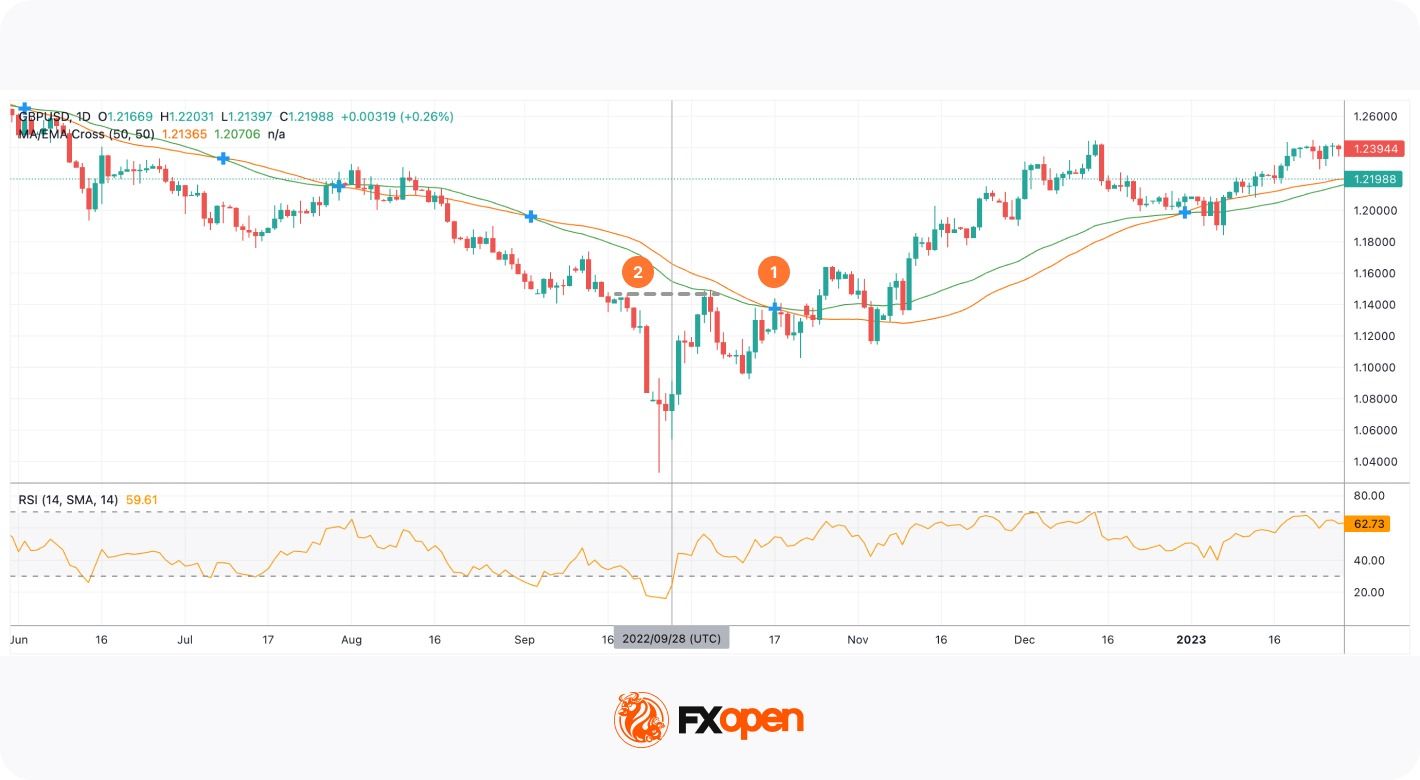
On the chart above, the RSI broke above the 30 level on 28th September. A trader could go long, using a trailing take profit. After the MA/EMA cross occurred (1), a trader could trail the take-profit target. Another option would be to place the take-profit order at the closest resistance level (2) and wait for the cross to confirm the reversal signal. After the confirmation, a trader could open another buy position and drive the uptrend.
RSI Divergence Strategy
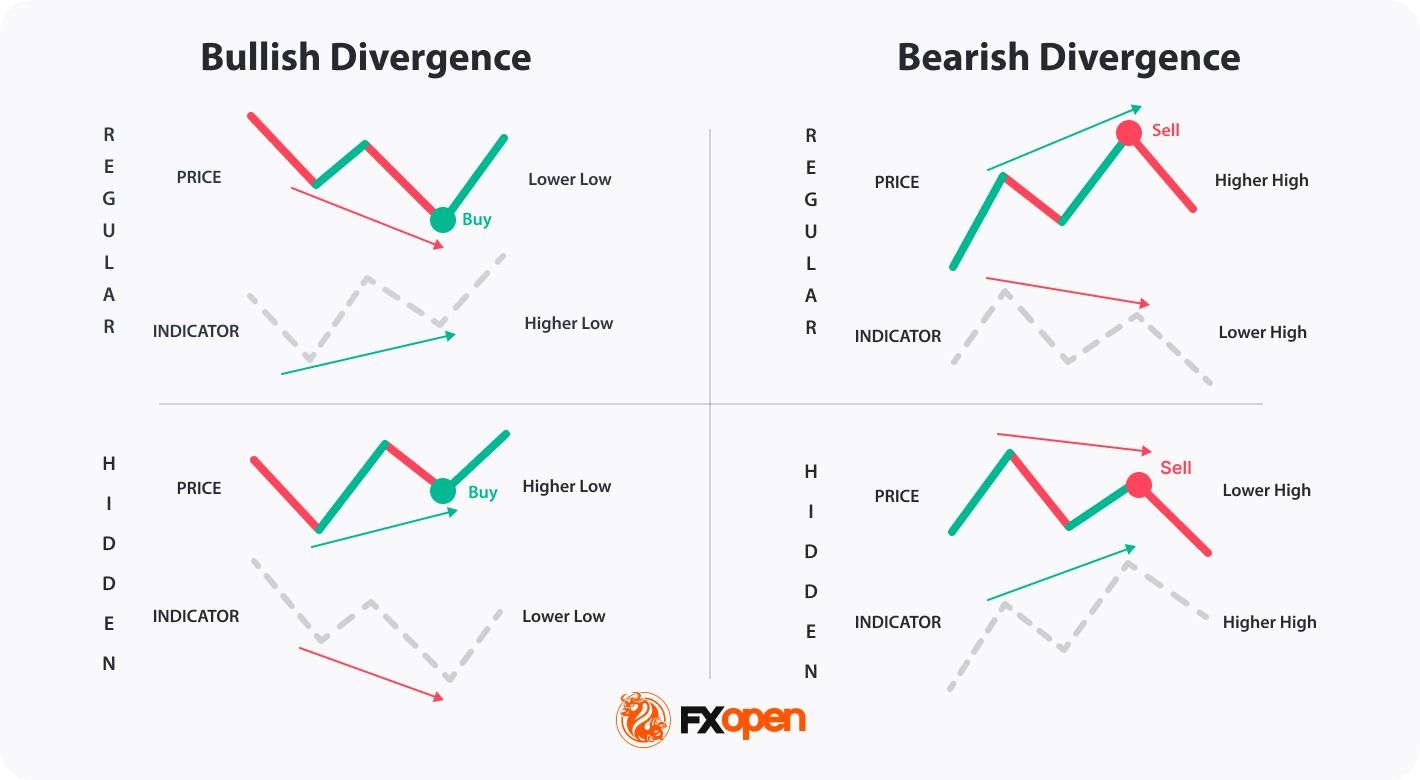
RSI is a divergence indicator. Another option for using the RSI is to look for divergences between the indicator and the price chart. Divergence occurs when price action and indicator momentum move in opposite directions, signalling a potential shift in underlying market dynamics.
A convention widely used in exchange educational materials is:
- An RSI bullish divergence forms when price records a lower low while the RSI prints a higher low. This pattern indicates that selling pressure is weakening even as price continues to decline.
- An RSI bearish divergence, by contrast, appears when price reaches a higher high but the RSI forms a lower high, suggesting diminishing upward momentum.
Divergence is more popular when it occurs near key support or resistance levels. However, because divergence can persist for extended periods before price reverses, it is rarely traded in isolation. Many traders confirm RSI divergence using tools such as the MACD or structural breaks in market structure.
Hidden divergence is another variation that signals trend continuation rather than reversal. In trending markets, this form of divergence may help traders identify pullbacks that are likely to resolve in the direction of the prevailing trend.
- A bullish divergence forms when the price rises with higher lows, but the relative strength index declines with lower lows, traders expect the price to move upwards.
- A bearish divergence forms when the price falls with lower highs, but the relative strength index moves upwards with higher highs, traders believe the price will decline.
Divergence frequently precedes momentum slowdown instead of immediate reversal. Markets often transition into consolidation before changing direction, which is why many traders wait for structure breaks rather than trading the first divergence signal. For example, in liquid index markets the first divergence often leads to range formation before trend change.
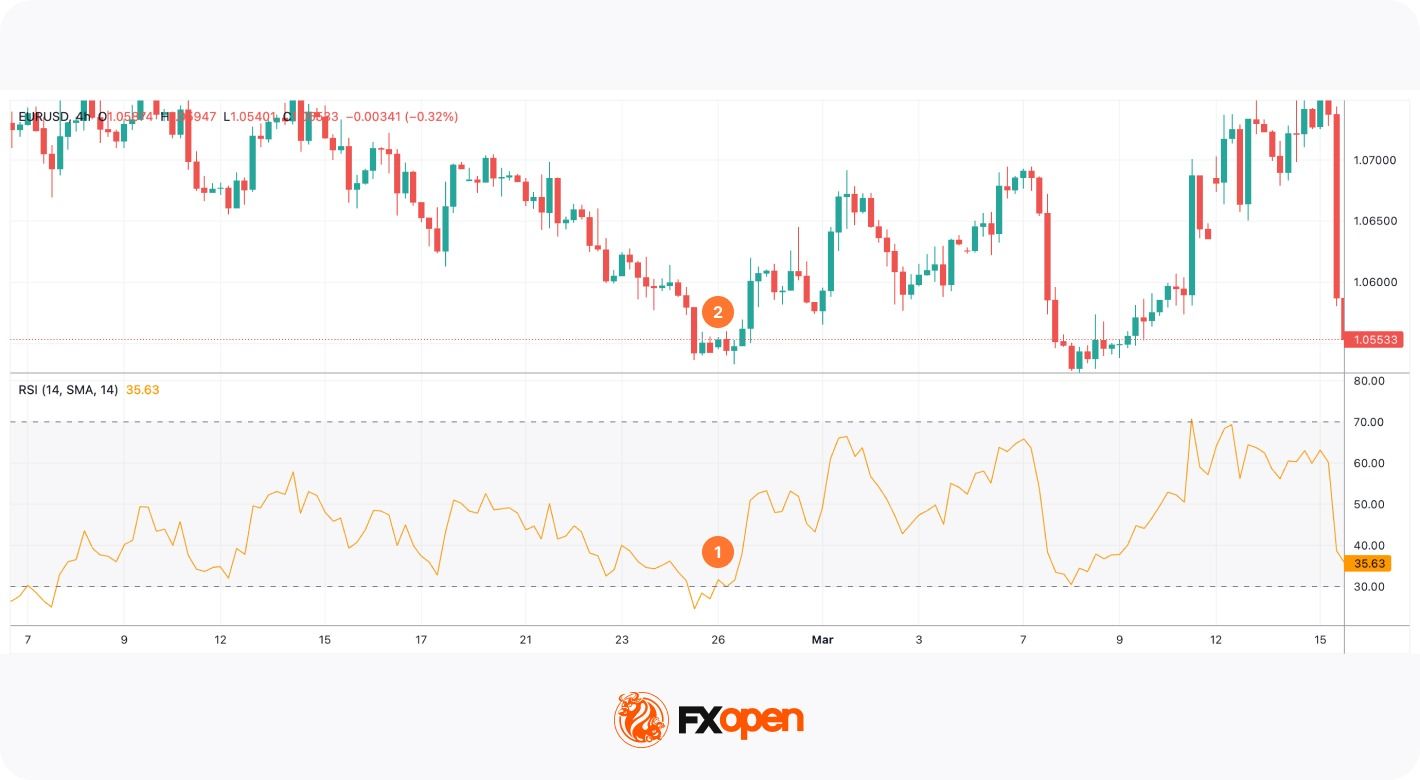
In the RSI example chart below, the indicator and the price formed a regular bearish divergence. As a result, the price fell (1). There was another divergence before the fall, but the price decline was short-lived (2). This highlights risks associated with the incorrect signals the RSI divergence may provide.
RSI Failure Swings: A Reversal Signal
Another signal that traders can consider is failure swings of the RSI which occur before a strong trend reversal. Although it is less common than the others, traders can add it to their list of tools.
The theory suggests traders don’t consider price actions but look at the indicator alone.
- Bullish reversal. A trend may turn bullish when the RSI breaks below 30, leaves the oversold area, falls to 30 but doesn’t cross it and rebounds, continuing to rise.
- Bearish reversal. A trend may reverse down when the RSI enters the overbought area, crosses below 70, and returns to 70 but bounces and continues falling.
Failure swings lose significance during volatility expansion events such as economic releases, when directional movement is driven by repricing rather than momentum decay.
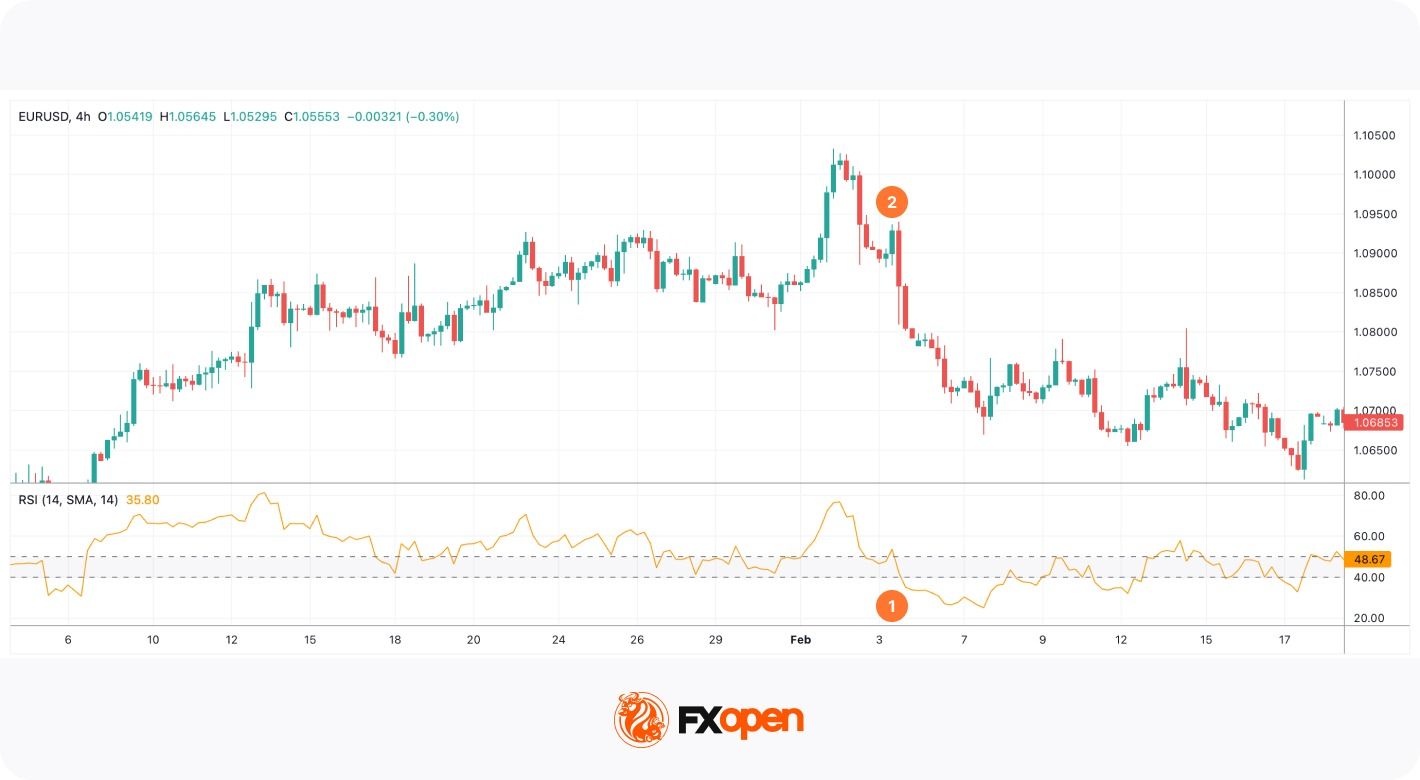
In the chart above, the RSI trading indicator broke below 30, left the oversold area, and retested the 30 level (1). At the same time, the price formed the bottom, and the downtrend reversed upwards (2).
Failure swings are more common on short-term timeframes and do not always reflect a trend reversal. Therefore, traders combine the RSI with trend and volume indicators.
Market Trends with RSI
The RSI can be used to identify a trend direction. Constance Brown, the author of multiple books about trading, noticed in her book Technical Analysis for the Trading Professional that the RSI indicator doesn’t fluctuate between 0 and 100. In a bullish trend, it moves in the 40-90 range. In a bearish trend, it fluctuates between 10 and 60.
To identify the trend, traders consider support and resistance levels. In an uptrend, the 40-50 zone serves as support. In a downtrend, the 50-60 range acts as resistance.
In the chart above, the RSI stayed above 40 as the price was moving in a solid uptrend. Once it broke below the 40-50 support level (1), the trend changed (2).
However, there may be incorrect signals. In the chart below, the RSI broke below the support level twice, but the trend didn’t change.
Ranges may vary depending on the trend strength, price volatility, and the period of the RSI.
RSI and Simple Moving Average
Usually, the RSI indicator consists of a single line. However, there are variations of the indicator. It can be combined with the simple moving average. The moving average usually has the same period as the RSI.
The rule is that when the RSI breaks below the SMA, the price is supposed to fall (1). When the RSI rises above the SMA, the price is expected to increase (2).
However, there are some aspects to consider. Firstly, traders avoid using RSI/SMA cross signals in the ranging market as the lines move close to each other and cross all the time, providing many fake signals. Secondly, a cross doesn’t determine the period of a rise or a fall. Traders use additional tools to identify where the price may turn around.
Note: The RSI is sensitive to volatility clustering. During news-driven sessions the indicator’s thresholds lose value because price movement is distribution-driven rather than momentum-driven.
RSI Trading Strategies Used by Professional Traders
Professional use of the RSI typically involves integrating the indicator into structured trading frameworks rather than relying on single signals. Several widely used approaches illustrate how momentum analysis can support decision-making.
What Is the 70-30 RSI Trading Strategy? EUR/USD Example
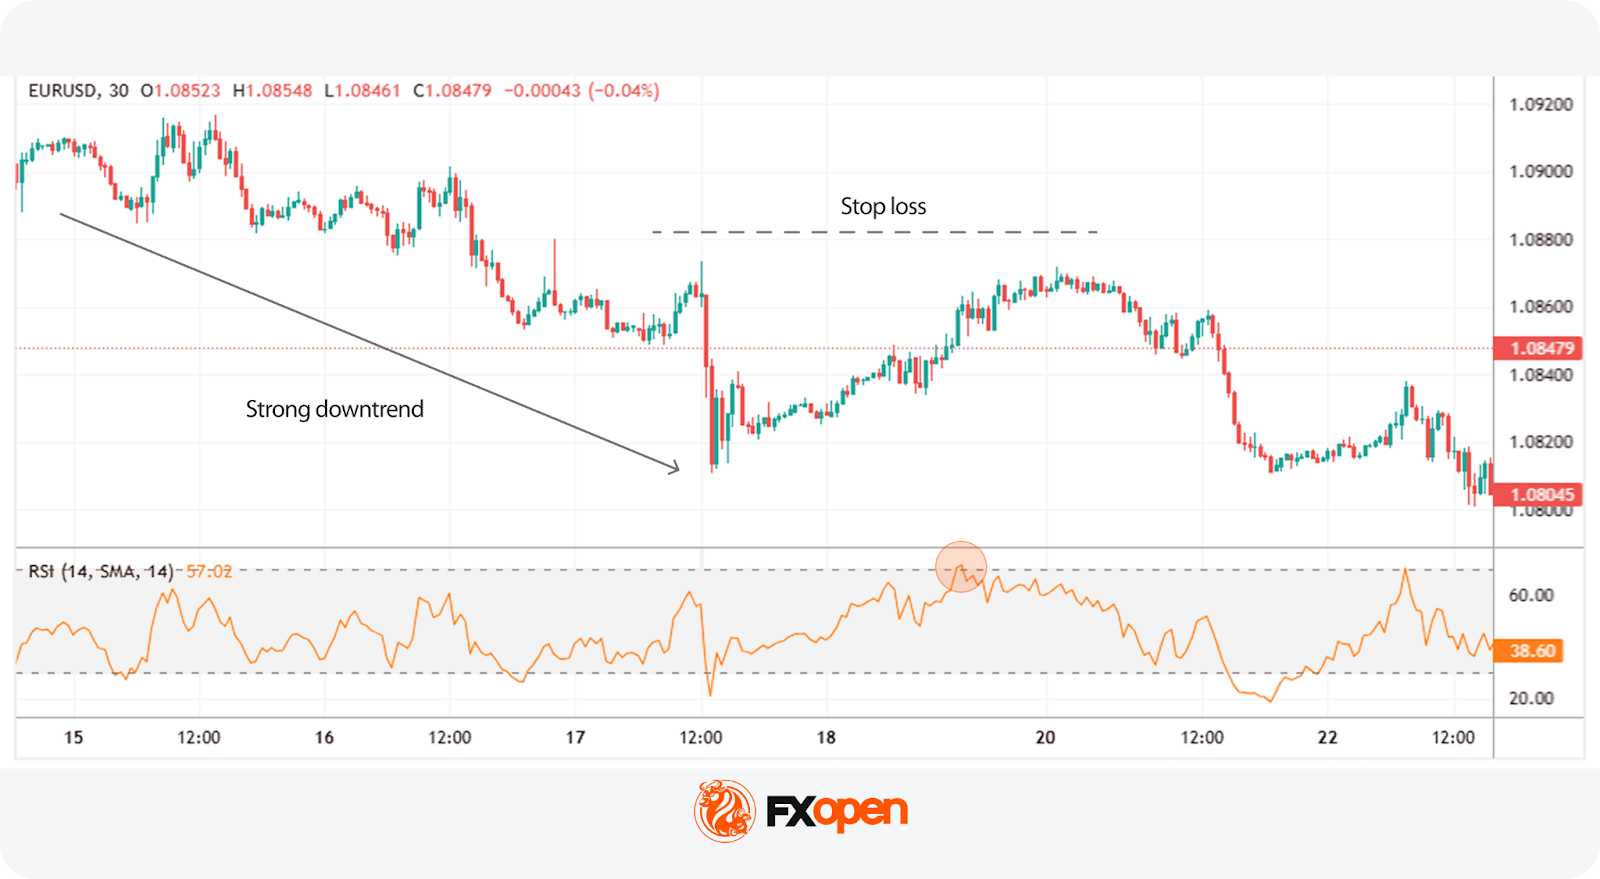
The 70-30 RSI strategy simply uses the overbought and oversold RSI readings to identify potential turning points. However, instead of simply going short above 70 (overbought RSI) and long below 30 (oversold RSI), traders typically apply a few levels of refinement.
Entry:
- Traders determine if the trend is bullish or bearish.
- They apply a trend filter. The RSI can produce false signals in a strong trend, showing overbought for a long time in a bullish trend and vice versa. They often use the 70-30 strategy to look for shorts when the price rallies in a downtrend and longs when the price dips in an uptrend.
- They enter the market when the RSI crosses back into the normal range. For instance, they’ll open a short trade when the RSI falls back below 70, indicating that a potential bearish reversal may be underway.
Stop Loss:
- Stop losses are often set beyond a nearby swing point.
Take Profit:
- Profits might be taken at an area of support or resistance when the RSI hits the opposite extreme (e.g. 70 when long), or when other indicators signal a price reversal.
Mean-reversion RSI strategies statistically depend on market volatility compression. As volatility expands, breakout continuation tends to dominate over oscillator reversal signals.
50-60 and 40-50 Trading Strategies: S&P 500 Index Example
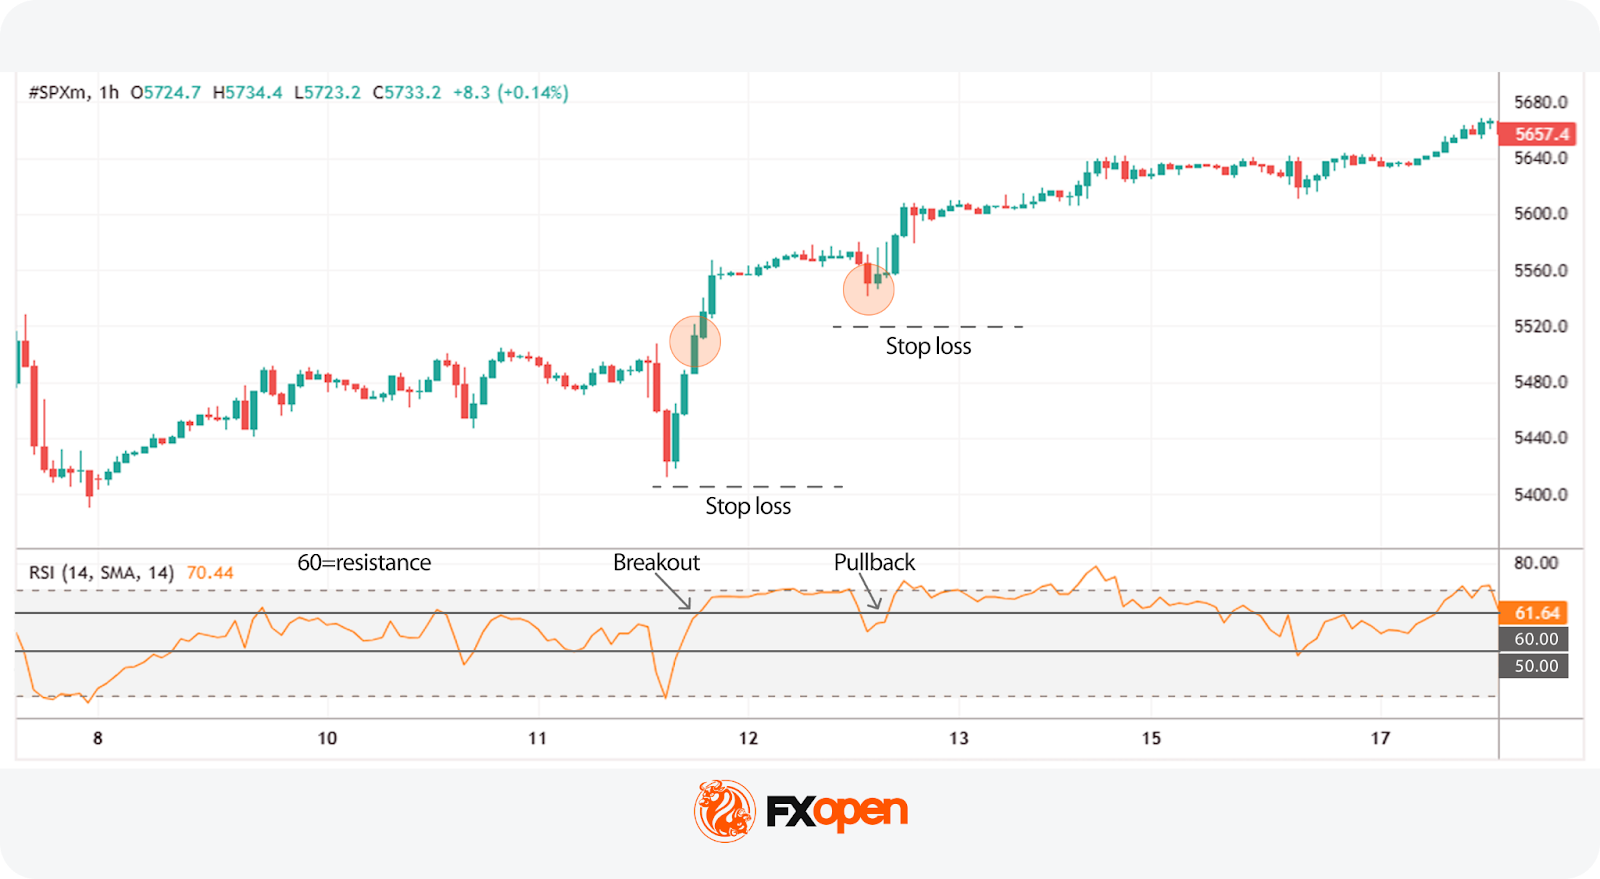
What is the 50-60 RSI trading strategy? The 50-60 RSI strategy works on the idea that the market shows bullish momentum above 50, with 60 acting as a resistance level. When the price breaks through 60, it can signal that bullishness is strong, offering a potential entry point.
Note:
- Despite the name, the same logic can be applied in a bearish trend, where 40 acts as a support level.
- This strategy is popular in markets with a strong trend. Indices, such as the S&P 500 and Nasdaq 100, or commodities like gold, that exhibit strong trends are often chosen by traders.
Entry:
- Traders may enter the market when the price crosses above 60 for the first time.
- Alternatively, they might wait for a pullback to 60 before going long.
Stop Loss:
- A stop loss may be set beyond the nearest major swing point or just beyond the entry candle on a pullback.
- Alternatively, some traders manually stop out if the price crosses below 50.
Take Profit:
- Profits might be taken when the price crosses below 50, giving room for the trade to run in a strong trend. However, this may limit potential returns when trading on short-term timeframes. Therefore, some traders prefer the closest resistance levels.
Typical RSI Strategy Comparison
RSI Meaning in Trading: Forex, Stocks, and Crypto* Markets
The RSI is applied across asset classes, but it behaves differently because persistence characteristics vary. Equity indices exhibit autocorrelation, currencies exhibit mean reversion around macro levels, and digital assets display momentum clustering. RSI interpretation should therefore be adjusted to the instrument’s structural behaviour rather than fixed thresholds.
In forex trading, where macroeconomic factors often drive sustained directional moves, the RSI is commonly used to identify pullbacks within trends rather than outright reversals. Currency pairs can remain overbought or oversold for extended periods when central bank policy or macro data supports a strong directional bias.
What is the RSI indicator in the stock market? In the stock markets, the indicator is frequently applied to mean-reversion strategies around key support and resistance levels. Stocks tend to exhibit more frequent range-bound behaviour than major currency pairs, making traditional overbought-oversold interpretations somewhat more applicable.
Cryptocurrency* markets, characterised by high volatility and rapid sentiment shifts, often produce extreme RSI readings. In this environment, divergence analysis becomes particularly valuable, as momentum frequently weakens before price reverses.
How to Use the Relative Strength Index with Other Indicators
In professional trading systems, the RSI is rarely used in isolation. Combining momentum analysis with trend, volatility, and volume tools may help traders filter signals and false entries.
RSI with MACD
RSI and MACD (moving average convergence divergence) are oscillators. However, they measure momentum differently, which allows one to confirm the signals of another. Usually, traders look for RSI overbought/oversold signals and MACD divergence. For instance, when the RSI is in the oversold zone but the MACD has a bullish divergence with the price chart, traders consider this a confirmation of a coming price rise. Read our article RSI vs. MACD.
RSI with Moving Averages
Early signals are one of the limitations of the RSI indicator. Therefore, traders often combine them with lagging technical analysis tools. An exponential moving average (EMA) is one of the options. Traders add two EMAs with different periods to the chart and wait for a cross to confirm the trend reversal signal the RSI provided.
RSI with Bollinger Bands
Bollinger bands are used similarly to the RSI, showing when the market is possibly overbought or oversold. Used together, these two indicators can provide confluence; for example, if the RSI indicates overbought and the price has closed through the upper band, then there may be an increased likelihood of a bearish reversal, and vice versa.
RSI with On-Balance Volume (OBV)
The on-balance volume (OBV) is a tool that tracks volume to confirm trends. Paired with the RSI, it has two uses. The first is that it can indicate trend strength. If the RSI is falling alongside the OBV, the bearish trend is likely genuine and vice versa. The second is confirming divergences. The OBV can diverge from the price like the RSI, so if both diverge, a reversal may be inbound.
Using RSI on Trading Platforms
Most trading platforms include the RSI as a standard built-in indicator. Platforms such as MetaTrader 4 and MetaTrader 5 allow traders to adjust periods, apply smoothing, and set custom alert levels. Also, you can implement the RSI indicator into your trading strategy on the TickTrader platform, which also allow you to set up the indicator for your unique trading style.
Professional traders often integrate RSI signals into multi-timeframe analysis. For instance, a higher-timeframe RSI reading may define directional bias, while a lower-timeframe signal provides entry timing. This approach reduces the likelihood of trading against broader market momentum.
Pros and Cons of the RSI Indicator
Although the relative strength index is one of the most popular indicators, it has limitations. Let's explore the two sides of the coin.
Benefits of the RSI in Trading
The relative strength index is a useful tool because of:
- Numerous signals. The RSI provides different signals so traders with different trading approaches can add it to their tool list.
- Numerous assets and timeframes. One of its advantages is that you can use the RSI on any timeframe of any asset. What does the RSI stand for in stocks? The same thing that it stands for in forex, commodity, and cryptocurrency* markets.
- Common signals. Despite the wide range of signals, it’s easy to remember them. If you are familiar with other oscillators such as the stochastic oscillator, you will quickly learn how to use the RSI indicator.
- Standard settings. Although you can change the period of the RSI, its standard period of 14 is used in many trading strategies.
- Reliability. The RSI is one of the most popular trading tools. However, the reliability of its signals depends on trader skills and market conditions.
Limitations and False Signals of RSI
Although the RSI is a functional tool, there are some pitfalls traders should consider.
- Weak at trend reversals. The indicator may provide early signals when spotting trend reversal.
- False signals. The relative strength index isn't a very popular tool in ranging markets.
- Lagging indicator. The RSI is based on past price data, meaning it may be relatively slow to react to sudden movements.
- Overbought/oversold conditions can persist. In strong trends, prices may remain above 70 or below 30 for long periods, leading to premature entries and exits.
Note: The RSI does not determine price direction; it measures the condition of the current move. Its primary value lies in distinguishing continuation conditions from exhaustion conditions.
Final Thoughts
The Relative Strength Index continues to play a central role in technical trading across forex, equities, and cryptocurrency* markets. Its value lies not in reflecting reversals in isolation but in providing insight into the strength and sustainability of price movements. When used alongside trend analysis, volatility measures, and volume indicators, the RSI becomes a powerful component of structured trading strategies.
For traders operating in leveraged CFD and forex markets, proper application involves combining the indicator with broader analytical tools, adapting settings to the trading timeframe, and maintaining disciplined risk management.
You can consider opening an FXOpen account today to build your own trading strategy in over 700 instruments with tight spreads from 0.0 pips and low commissions from $1.50 (additional fees may apply).
FAQ
What Does the RSI Stand For?
RSI stands for the relative strength index. It’s a momentum-based indicator that measures the speed and magnitude of price movements.
What Is the RSI Setting?
The only setting of the Relative Strength Index is the period, which reflects the number of past candles used to calculate average gains and losses, affecting how sensitive the RSI is to price changes. The default period is 14, though shorter or longer settings may be applied depending on trading style and timeframe.
How Traders Use the RSI Indicator
The RSI moves between 0 and 100, with >70 meaning the asset is overbought and <30 meaning oversold. It can be used to spot potential market reversals and confirm trend strength.
Is RSI Used in Forex Trading?
Yes. The RSI is widely used in forex to identify pullbacks, confirm trends, and detect divergence signals.
How Do Traders Use RSI Divergence?
Divergence between price and RSI is often used to identify weakening momentum and potential reversals, particularly when confirmed by other indicators or price-structure analysis.
What Is the RSI in Stocks?
The RSI meaning in stocks refers to the same RSI indicator used in other asset classes. It’s used to gauge buying and selling pressure.
Is High RSI Bullish or Bearish?
A high RSI (above 70) signals bullish momentum, suggesting an overbought market and a potential soon downward reversal.
*Important: At FXOpen UK, Cryptocurrency trading via CFDs is only available to our Professional clients. They are not available for trading by Retail clients. To find out more information about how this may affect you, please get in touch with our team.
This article represents the opinion of the Companies operating under the FXOpen brand only. It is not to be construed as an offer, solicitation, or recommendation with respect to products and services provided by the Companies operating under the FXOpen brand, nor is it to be considered financial advice.
Stay ahead of the market!
Subscribe now to our mailing list and receive the latest market news and insights delivered directly to your inbox.


Latest articles

Tesla (TSLA) Shares Surge Following Musk’s Announcements
According to the chart, Tesla (TSLA) shares had been under significant pressure since the start of 2026: from their December high, they had lost around 25% of their value. The main bearish drivers included:
→ Intense competition from Chinese automakers, particularly

XTI/USD Analysis: WTI Oil Prices Under Pressure from Trump’s Statements
Yesterday, following a false bullish breakout above the psychological $100 level, WTI crude prices fell sharply towards the $85 area. The primary driver of this rapid decline was comments made by the US President.
According to Donald Trump:
→ the United
