


FXOpen
Parabolic SAR is a key component of technical trading, or technical analysis, which involves assessing financial markets and guiding trading decisions through analysing historical price and volume data, along with utilising diverse technical indicators and chart patterns. This article aims to explore the significance of the Parabolic SAR indicator, finding out which settings make it an effective tool for market analysis.
What Is the Parabolic SAR Indicator?
The Parabolic SAR (Stop and Reverse), or simply PSAR, is a technical analysis indicator designed by J. Welles Wilder to assist traders in identifying potential trend reversals in financial markets. Calculated based on an acceleration factor and an initial SAR value, the indicator trails the price movement, moving towards the trend.
When the Parabolic SAR crosses the price, it signifies a potential trend reversal, serving as a signal for traders to buy or sell depending on the crossover direction. Widely used to identify trend direction and adjust to market volatility, it is often employed in conjunction with other technical tools to make more informed trading decisions, although traders should be cautious and consider risk management strategies. Also, traders widely use the indicator as a trailing stop mechanism.
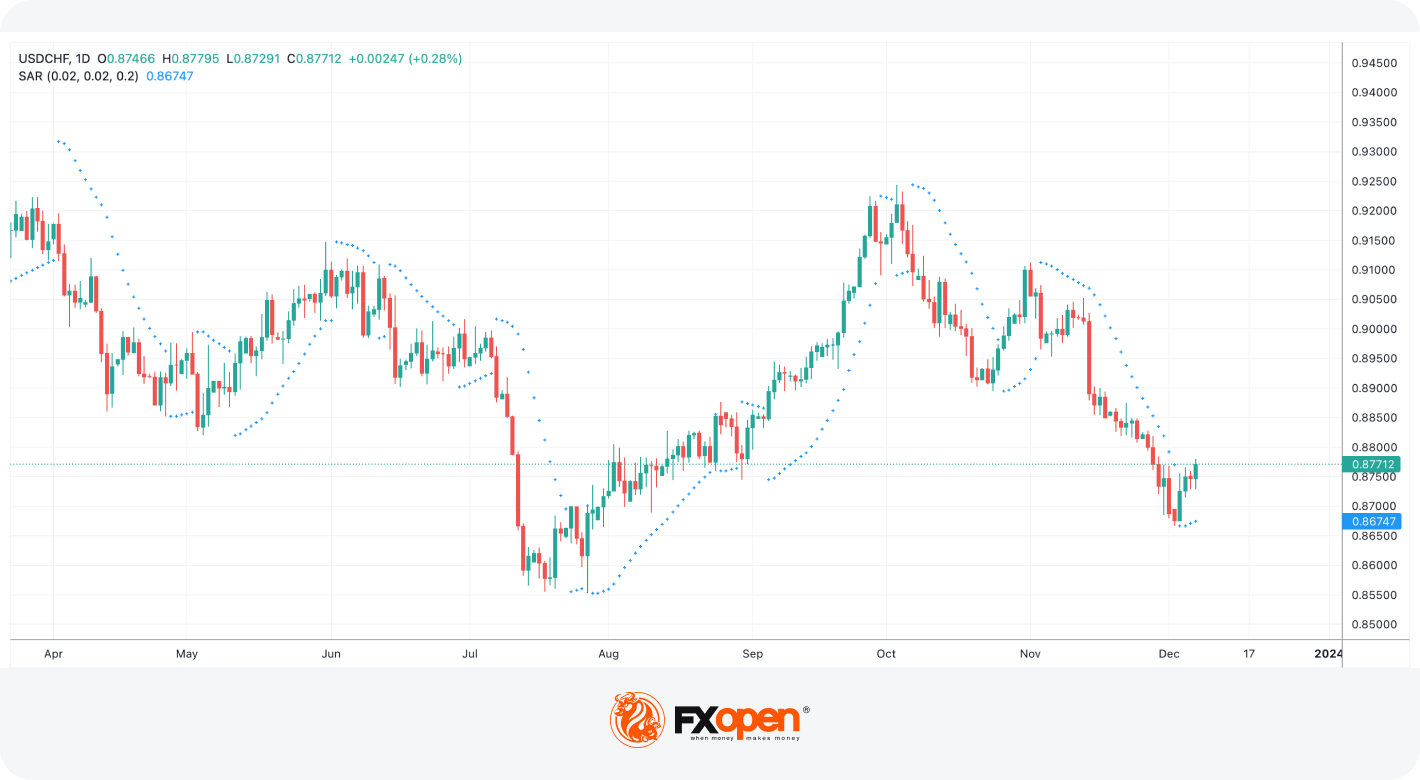
The daily chart of EURUSD on the TickTrader platform by FXOpen shows the parabolic SAR.
Understanding Parabolic SAR Settings
The PSAR has default settings that determine its initial behaviour:
- Step: The default step value is 0.02. This parameter controls the acceleration factor of the indicator as it moves in the direction of the trend.
- Maximum: The default maximum value is 0.2. This is the maximum acceleration factor that the indicator can reach, regardless of the strength of the trend.
Parameters and Their Effects
Adjusting the step and maximum parameters can significantly impact the Stop and Reverse’s sensitivity and signals:
- Step: Increasing the step value accelerates the SAR, making it more sensitive to price changes. On the other hand, a smaller step value results in a slower acceleration, making the SAR less sensitive.
- Maximum: A higher maximum value allows the SAR to accelerate more before reaching its maximum value. This can prevent the PSAR from flipping too quickly, meaning it follows the trend more smoothly. Conversely, a lower maximum value makes the SAR more responsive but increases the chances of premature reversals.
Traders can customise the PSAR based on their trading style:
- Aggressive Traders: A smaller step and lower maximum value can be used for quicker reversals, suitable for short-term and more aggressive trading.
- Conservative Traders: A larger step and higher maximum value might be preferred for a smoother indicator that reacts less to short-term price fluctuations, which is suitable for long-term and conservative trading.
Choosing the Right Settings
To avoid false signals, traders need to choose the correct Parabolic SAR settings. Here are some points to consider:
- Market Conditions: In trending markets, default settings or smaller step values may work well. In choppy or ranging markets, adjusting the parameters for sensitivity might be necessary.
- Timeframes: Shorter timeframes may require more sensitive Parabolic SAR settings for scalping, while longer timeframes might benefit from less sensitive inputs to filter out noise.
- Volatility: Significant market movements may need you to make a few adjustments to the indicator. Higher volatility may require adjustments to lower sensitivity to avoid false signals. Lower volatility might call for more sensitivity.
- Risk Tolerance: Traders with higher risk tolerance might prefer lower settings for potentially earlier signals, while conservative traders may opt for less sensitive settings for confirmation.
Examples of Setting Combinations
Here are a few settings that market participants generally use while trading, including Parabolic SAR settings for intraday strategy:
Trending Market: Step = 0.02, Maximum = 0.2
Choppy Market: Step = 0.01, Maximum = 0.1
Short-Term Trading: Step = 0.01, Maximum = 0.1
Long-Term Trading: Step = 0.02, Maximum = 0.2
The 2 Parabolic SAR, or double Parabolic SAR, strategy is an example that involves employing two distinct timeframes rather than tweaking indicator inputs. Initially, a lengthier timeframe is utilised to ascertain the trend direction by assessing the movement of the indicator. Subsequently, trades are executed on a shorter timeframe, focusing exclusively on the direction aligned with the longer-term trend. This approach aims to synchronise shorter-term trading activities with the broader trend determined by the extended timeframe, providing a comprehensive strategy that integrates short- and long-term market perspectives.
Final Thoughts
A thorough understanding of technical tools is indispensable for making informed decisions in forex and CFD trading. While indicators like the Parabolic SAR, with their ability to identify potential trend reversals, provide valuable insights into market dynamics, it is crucial to integrate them into a broader technical analysis toolkit for signal confirmation. Traders should remain vigilant about market shifts and consistently refine their skills to thrive in the dynamic trading landscape. Remember that there are no best parabolic SAR settings; the best parameters will depend on your trading approach. If you want to test various Parabolic SAR settings on over 600 markets, open an FXOpen account to trade with spreads from 0.0 pips and commissions from $1.50.
This article represents the opinion of the Companies operating under the FXOpen brand only. It is not to be construed as an offer, solicitation, or recommendation with respect to products and services provided by the Companies operating under the FXOpen brand, nor is it to be considered financial advice.
Stay ahead of the market!
Subscribe now to our mailing list and receive the latest market news and insights delivered directly to your inbox.


Latest articles

USD/CAD Rises to a Two-Month High
Today, the USD/CAD currency pair climbed above the 1.3787 level for the first time since late January.
→ Demand for the US dollar is being supported by concerns over escalating tensions in the Middle East. Market participants are favouring

Alphabet (GOOGL) Shares Fall to 2026 Low
As the chart shows, Alphabet (GOOGL) shares have dropped to their lowest level of 2026, with trading closing well below the psychological $300 per share mark.
Why Have Alphabet (GOOGL) Shares Declined?
The bearish move is driven by a combination

FX Market Awaits Macro Data: EUR/USD and GBP/USD Near Range Boundaries
European currencies are trading without a clear direction against the US dollar, remaining in a consolidation phase following the earlier decline driven by USD strength. At the start of the week, both EUR/USD and GBP/USD attempted a recovery,