


LTC and EOS - Breakout seen but increase soon expected
FXOpen

LTC/USD
From Sunday, when the price of Litecoin was sitting at its highest point at $64.84 measured to the lowest point the price has been today which is at $58.572 we have seen a decrease of 9.67%. The price is in a downward trajectory as a breakout has been made from the ascending triangle made from the 26th of October.
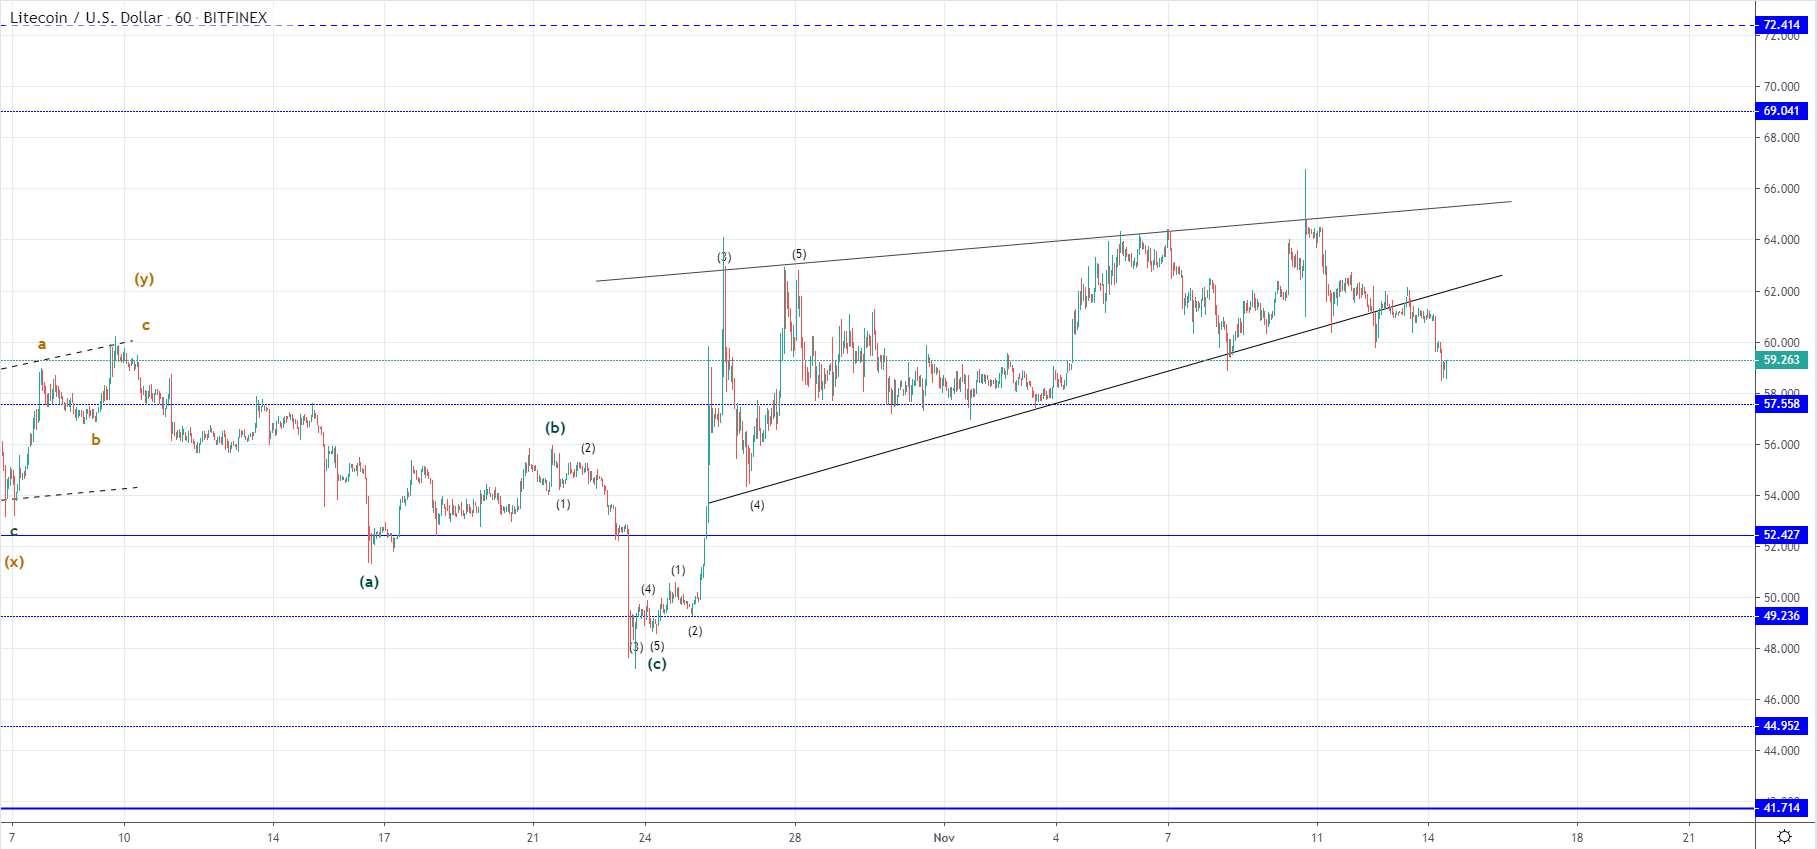 On the hourly chart, you can see that the price of Litecoin has increased impulsively after an interaction with the $49.23 level in a five-wave manner. The triangle which was formed after could be considered corrective and is most likely the 2nd wave out of the starting upside move but it still unclear whether it would be another corrective one or an impulsive one.
Considering the rise we have seen from the 26th of October and the length of the corrective triangle I believe that the second one is more likely, but as a breakout from the triangle was made on the downside a sign of confirmation is needed. This could come in the form of price holding above the $57.558 significant level or above the lower one at around $52.4, but if the price continues moving below the second horizontal level in line it could indicate further lows for Litecoin.
EOS/USD
Similarly, as in the case of Litecoin, the price of EOS has also formed an ascending triangle after an impulsive increase and after reaching $3.61 on Sunday it started declining. The price decreased by 7.44% from there to the lowest point today at $3.34 around which the price is currently being traded and consequently made a breakout to the downside from the triangle.
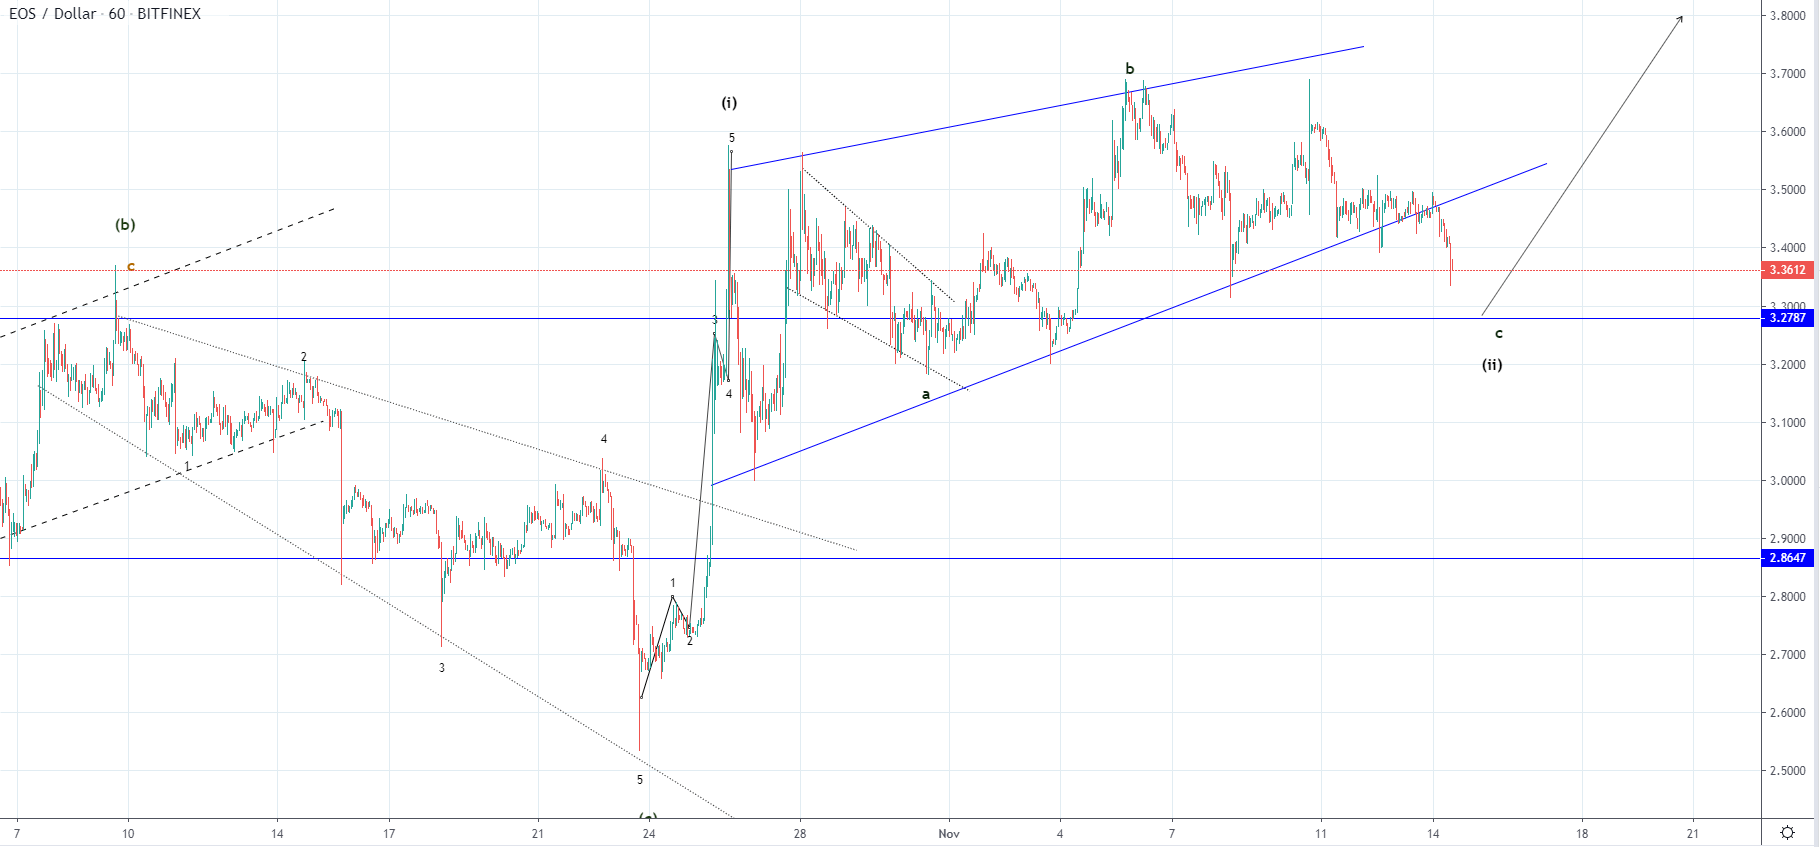 As the triangle’s wave structure looks corrective, its continuation would be expected but not below the $3.27 horizontal level. Inside the triangle, we have seen two corrective structures developing which is why the current one is considered the final one after which the uptrend should continue, but if the price continues moving below the $3.2 level we could see further depreciation before the expected uptrend continuation starts.
The lower horizontal support level on which the corrective depreciation could end is the resistance from the consolidative horizontal range at $3, but the one at $2.8 which served as support in the mentioned range is a more significant one and its retest before the uptrend continuation would look reasonable in the price progression.
In either way, after the downfall ends I will be expecting another increase from which we are to see if this is the start of the higher degree uptrend or not.
FXOpen offers the world's most popular cryptocurrency CFDs*, including Bitcoin and Ethereum. Floating spreads, 1:2 leverage — at your service (additional fees may apply). Open your trading account now or learn more about crypto CFD trading with FXOpen.
*Important: At FXOpen UK, Cryptocurrency trading via CFDs is only available to our Professional clients. They are not available for trading by Retail clients. To find out more information about how this may affect you, please get in touch with our team.
This article represents the opinion of the Companies operating under the FXOpen brand only. It is not to be construed as an offer, solicitation, or recommendation with respect to products and services provided by the Companies operating under the FXOpen brand, nor is it to be considered financial advice.
Stay ahead of the market!
Subscribe now to our mailing list and receive the latest market news and insights delivered directly to your inbox.


Latest articles

EUR/USD and GBP/USD consolidate ahead of the Fed decision
European currencies are showing subdued dynamics, entering a consolidation phase following their previous advance. Earlier, EUR/USD and GBP/USD broke out of their ranges and strengthened; however, the subsequent correction has led both pairs to retest the previously breached

Meta: V-Shaped Recovery Meets Heavy Volume Resistance
The movement in Meta Platforms shares is being driven by two competing narratives. On one hand, advertising revenue is benefiting from AI-based tools: the Advantage+ platform continues to support strong advertiser demand, and the analyst consensus for Q1 2026 revenue

Commodity Currencies Test Key Levels Ahead of Major Macro Data
Commodity-linked currencies are trading near key levels, showing restrained price action as market participants adopt a wait-and-see approach. The fundamental backdrop is shaped by expectations surrounding the release of Australia’s inflation data and the Bank of Canada’s interest