


Although UK-100 Index Is Near All-time Highs, UK Economy Slips into Recession
FXOpen
Technically, a national economic recession is defined as two consecutive quarters of contraction, and yesterday's Office for National Statistics data confirmed that this has happened — UK GDP fell in the third and fourth quarters of 2023 by 0.1% and 0.3% respectively.
The Guardian writes that the recession may be deeper than it seems at first glance:
→ Increased government spending (including for the military) masks a deep and persistent decline in production.
→ The economy is shrinking despite population growth;
→ In the fourth quarter of 2023, the deficit widened to £26.3 billion, or 3.9% of GDP, up £5.9 billion from the third quarter.
→ The big problem is the decline in goods exports. Soaring prices for imported raw materials and energy have played a major role in increasing the cost of producing goods in the UK and making it difficult to sell them abroad.
However, the price of the UK-100 index (or FTSE-100) is near all-time highs. This is because the Bank of England may ease monetary policy to avoid worsening the recession. And this will be a positive factor for the development of the top 100 companies whose shares are included in the index — this expectation is included in the current quote.
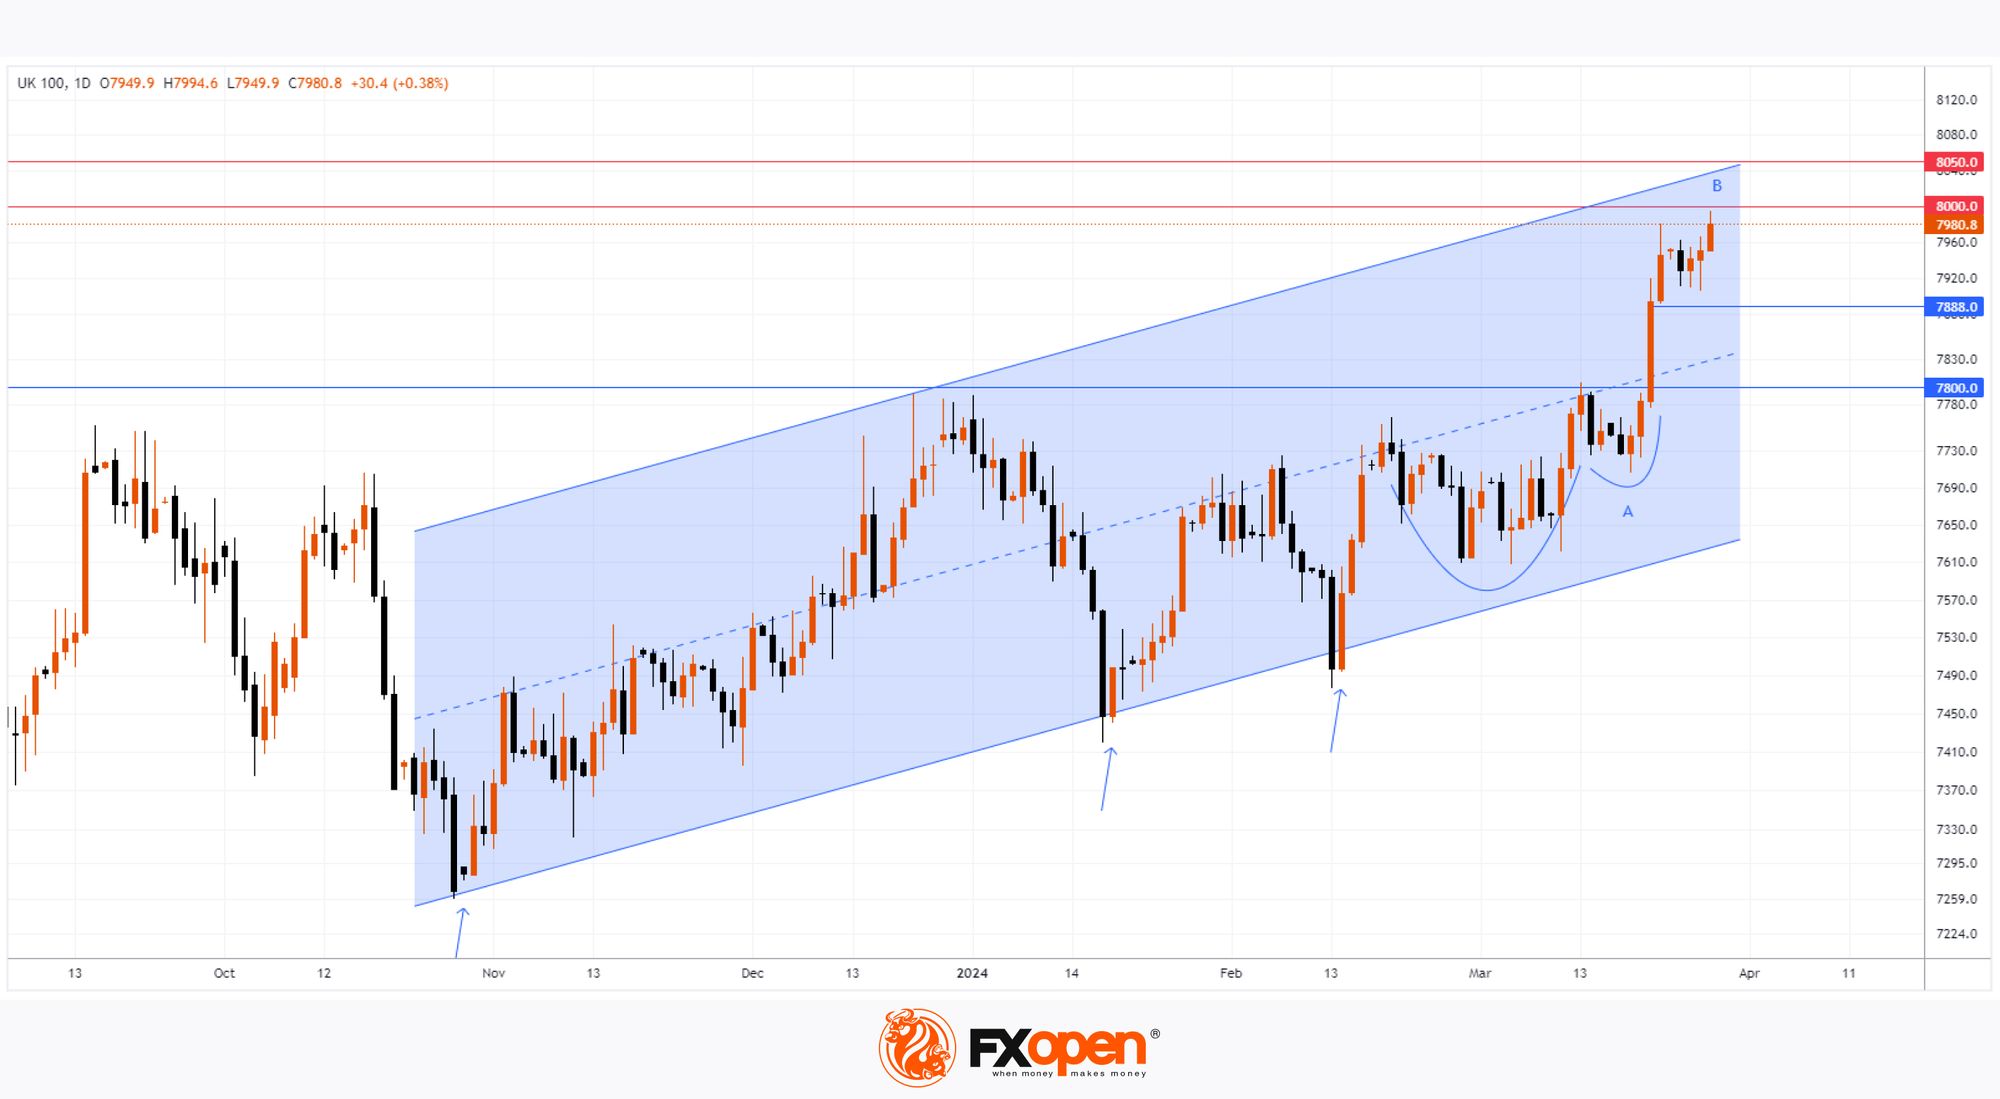
The UK-100 Index chart shows that:
→ today the price of UK-100 is moving within an upward trend (shown by the blue channel);
→ demand forces are active at the lower border of the channel, quickly absorbing all declines (shown by arrows);
→ the bulls confirmed their dominance upon breaking through the 7,800 level, forming a strong cup-and-handle pattern;
→ the psychological level of 8,000 points prevents the bulls from maintaining the growth rate - when approaching it, the bullish candles become narrower. Buyer confidence is waning. This creates difficulties for the price to realize the prospect of reaching the upper boundary of the channel.
It is possible that the upward trend, rooted in the fall of 2023, will continue with the formation of a correction before attempts to overcome the resistance block of 8,000-8,050. In this scenario, support for the UK-100 price may come from:
→ Fibo level 50% rollback from growth impulse A→B;
→ local support formed by intraday price action around the level of 7.888;
→ median line and/or lower border of the blue channel.
Trade global index CFDs with zero commission and tight spreads (additional fees may apply). Open your FXOpen account now or learn more about trading index CFDs with FXOpen.
This article represents the opinion of the Companies operating under the FXOpen brand only. It is not to be construed as an offer, solicitation, or recommendation with respect to products and services provided by the Companies operating under the FXOpen brand, nor is it to be considered financial advice.
Stay ahead of the market!
Subscribe now to our mailing list and receive the latest market news and insights delivered directly to your inbox.


Latest articles

S&P 500: Index Narrows Its Range as the Labour Market Cools
The broad US market index, the S&P 500, has entered July against a backdrop of mixed signals from the labour market. The Bureau of Labor Statistics report released on 2 July showed that just 57,000 jobs were

Ethereum: Has the Recovery Begun?
Ethereum has staged a notable rebound after once again testing the heavily watched psychological zone around 1500$. Since bouncing off this support, ETH/USD has climbed roughly 13%, now trading around the $1,700 mark.
This recovery is being driven

Oil Prices Are Back at Pre-Conflict Levels. Analysts Are Divided
At the start of May, oil markets were still pricing in elevated geopolitical risk and expectations of sustained supply disruption.
But easing tensions between Washington and Tehran, along with improving supply expectations, have rapidly shifted sentiment back toward fundamentals.
📉 Brent