


Market Analysis: Google Report Crashes Stock Price
FXOpen
Shares of GOOG and GOOGL fell about 9.5% on Wednesday, wiping Google's parent company's market value by USD 166.64 billion, the fifth-largest decline in capitalization history, according to Dow Jones Market Data.
It is noteworthy that the drop occurred as a result of the publication of a report that turned out to be better than expected:
→ earnings per share: actual = USD 1.55, forecast = USD 1.45;
→ gross income: actual = USD 76.69 billion; forecast = USD 75.95.
Why did Google's stock price collapse? Among the reasons may be the fact that revenue from cloud-based services has shown a decline. It amounted to USD 8.41 billion, which is about 2% below expectations of USD 8.6 billion, although in the same quarter last year it was equal to USD 6.87 billion, that is, an increase of 22% over the year.
However, Dan Ives of Wedbush Securities said the stock's negative reaction was "overblown." And according to analysts at Mizuho Americas, the decline in cloud revenue will be "temporary," based on what they've seen in rival Amazon's cloud business.
If the price decline continues, how deep can it be?
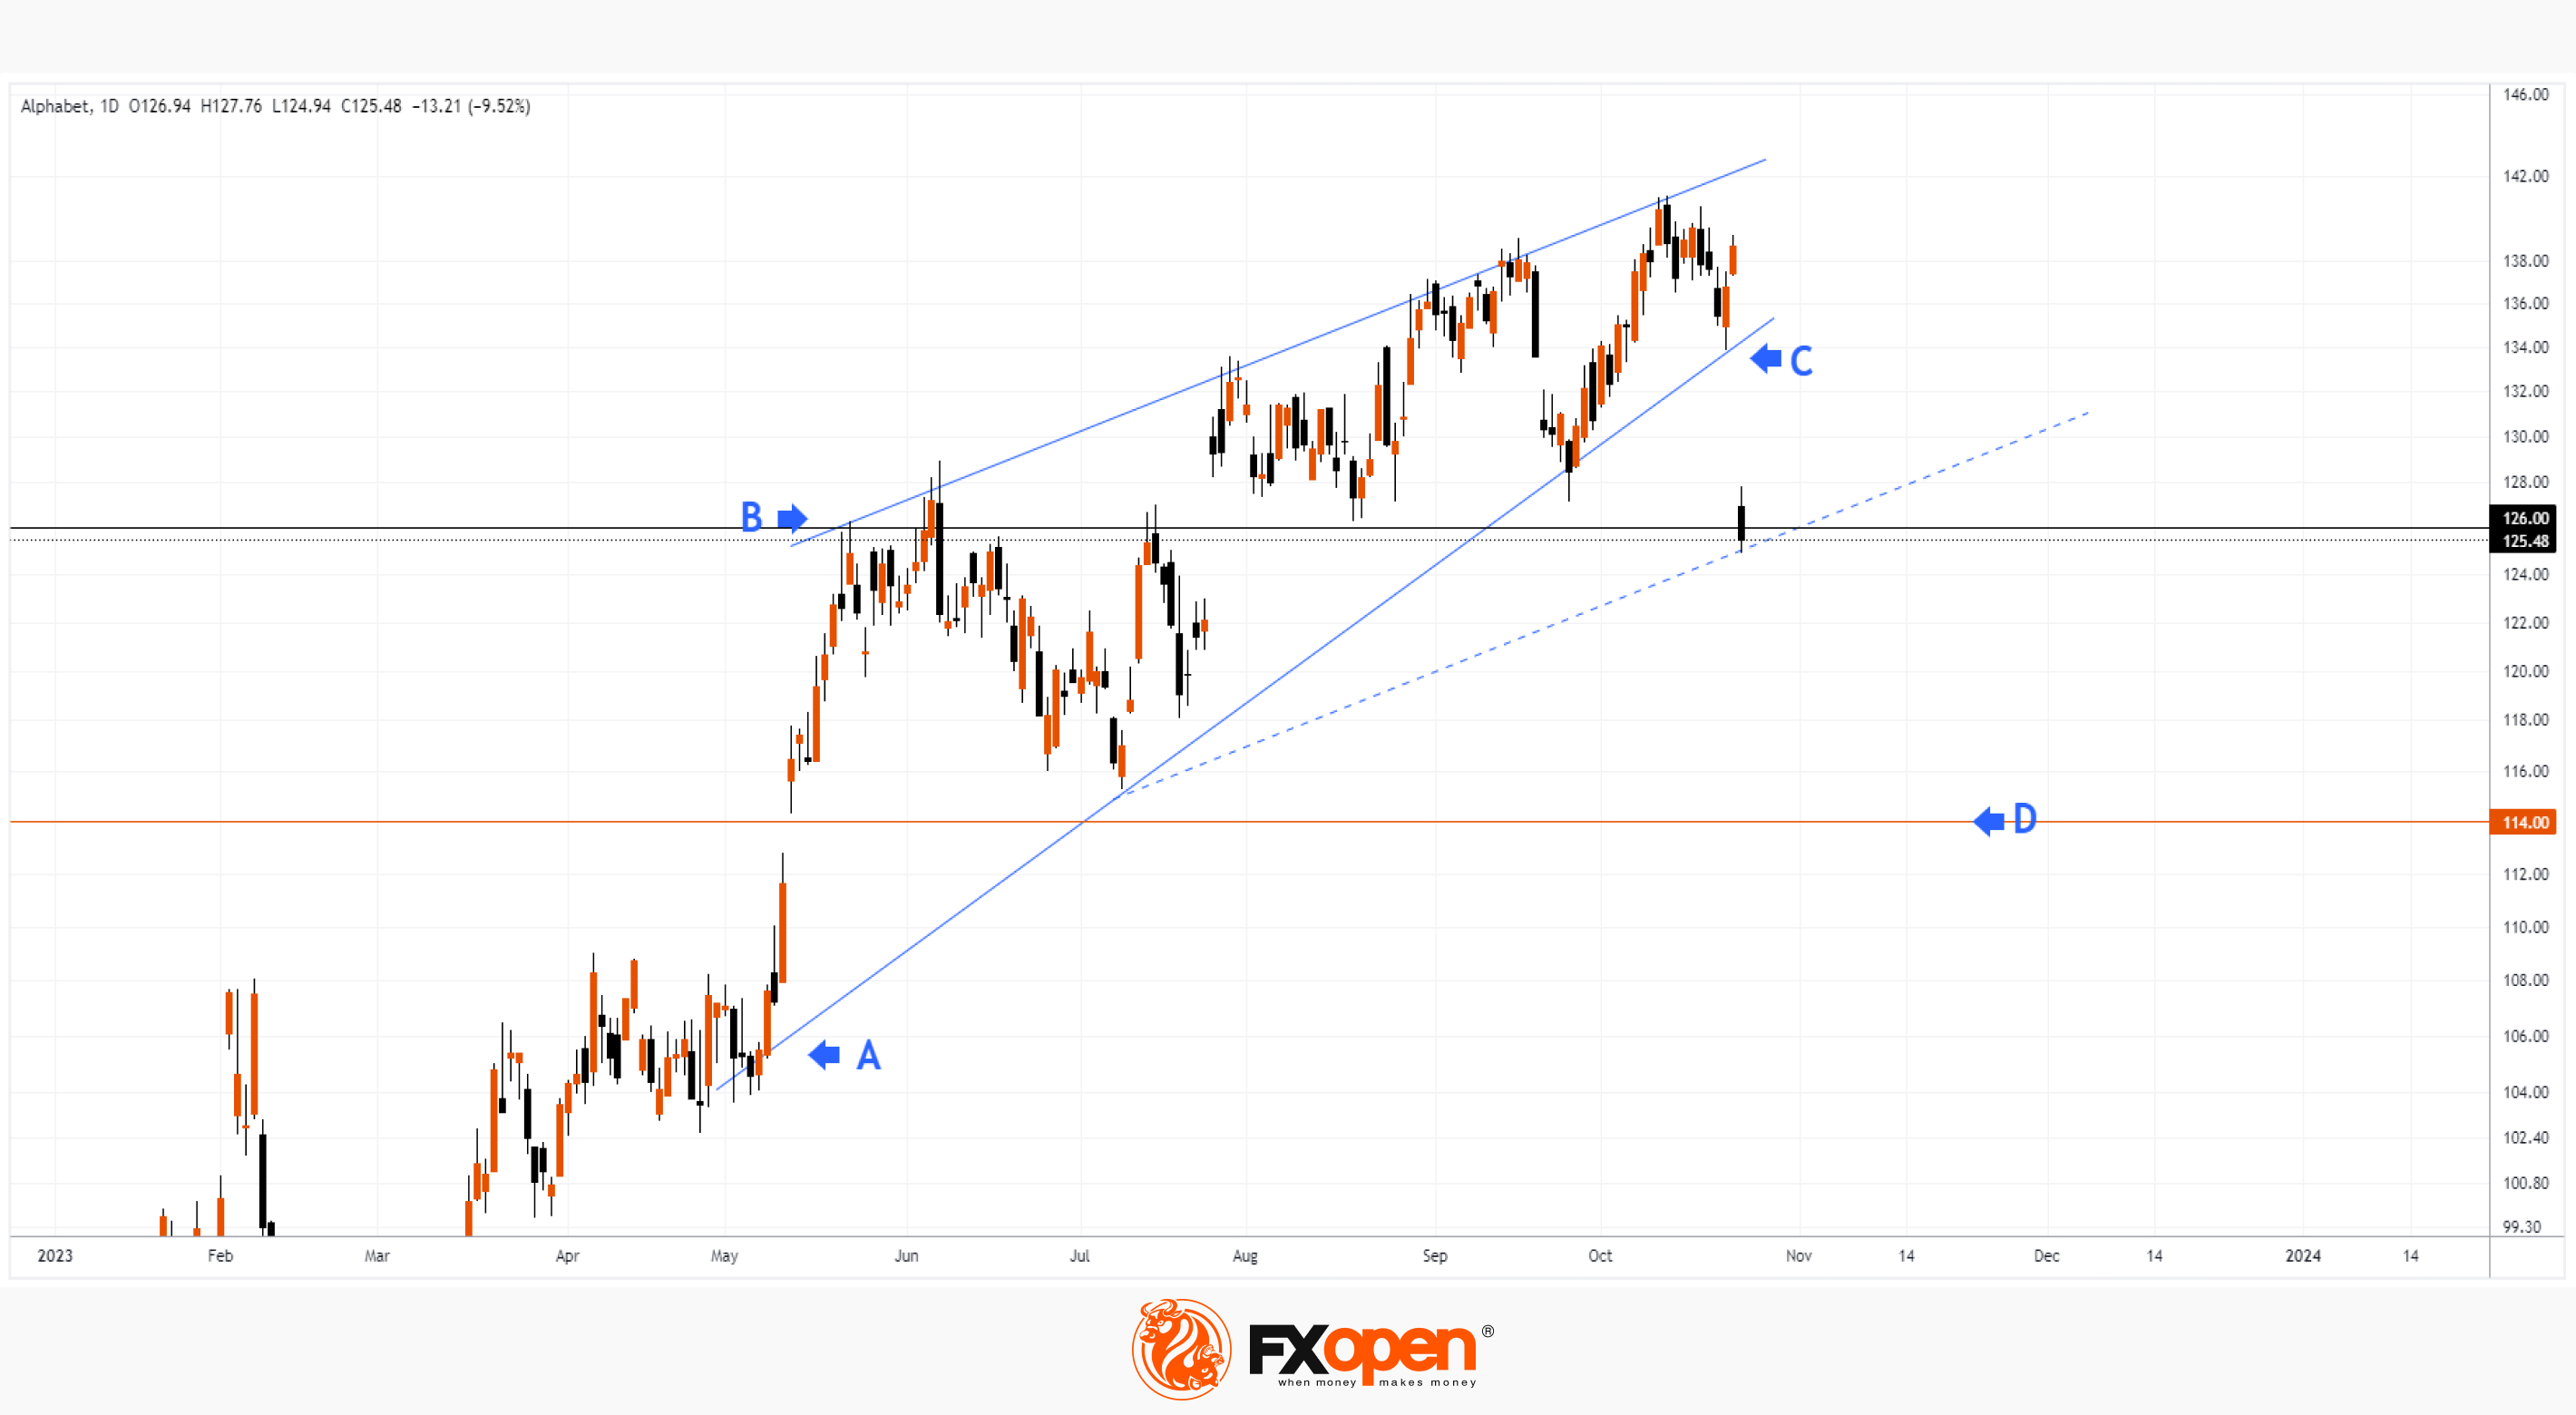
From a technical analysis perspective, there has been a bearish breakout of the contracting triangle (bearish wedge pattern, shown in blue lines). Having estimated the width of the wedge at points A and B, approximately = USD 126 - USD 106 = USD 20, we can plot this distance down from the breakout point C to get a guideline for point D = USD 134 - USD 20 = USD 114. That is, presumably, the price is aimed at the May gap zone.
However, to reach this level, the bears will have to overcome support around the USD 126 level, where the price now lies, having found support during yesterday's history-making decline. This support comes from a line (shown as a dotted line) parallel to the upper boundary of the bearish wedge, as well as from the $126 horizontal, which has interacted significantly with the stock price in the past. It is possible that the bears will be helped by a negative political and geopolitical background.
Buy and sell stocks of the world's biggest publicly-listed companies with CFDs on FXOpen’s trading platform. Open your FXOpen account now or learn more about trading share CFDs with FXOpen.
This article represents the opinion of the Companies operating under the FXOpen brand only. It is not to be construed as an offer, solicitation, or recommendation with respect to products and services provided by the Companies operating under the FXOpen brand, nor is it to be considered financial advice.
Stay ahead of the market!
Subscribe now to our mailing list and receive the latest market news and insights delivered directly to your inbox.


Latest articles

AI Valuations Are Back in the Spotlight
Artificial intelligence remains the dominant investment theme of 2026, but investors are increasingly questioning whether AI stock valuations are keeping pace with reality.
💰 Big Tech continues to invest at an unprecedented scale, with hyperscaler AI spending projected to exceed $800

AUD/CAD: Months of Indecision — Is a Breakout Finally Coming?
The Australian dollar has clawed back most of its end-of-June losses, when it touched three-month lows against the greenback amid escalating Middle East tensions. Since then, sentiment has improved: the RBA's Assistant Governor Sarah Hunter signalled the board stands ready

USD/JPY: Battling at the Top of the Triangle
On 3 July, Japan's Finance Minister, Satsuki Katayama, stated that the Ministry of Finance remains in close contact with US authorities regarding developments in USD/JPY as the yen traded near its weakest level in almost 40 years. Similar verbal