


FXOpen

In our analysis of the price of WTI oil dated November 8, we wrote that the price could recover to the level of USD 80 per barrel.
After the price failed to reach the round level of USD 80 by only 36 cents (the median line of the descending channel prevented this from happening) on November 14, the bears again seized the initiative. The result of their pressure was a reduction in the price to a new autumn low on November 14 at the level of USD 73 per barrel, after which the price recovered again to the median line.
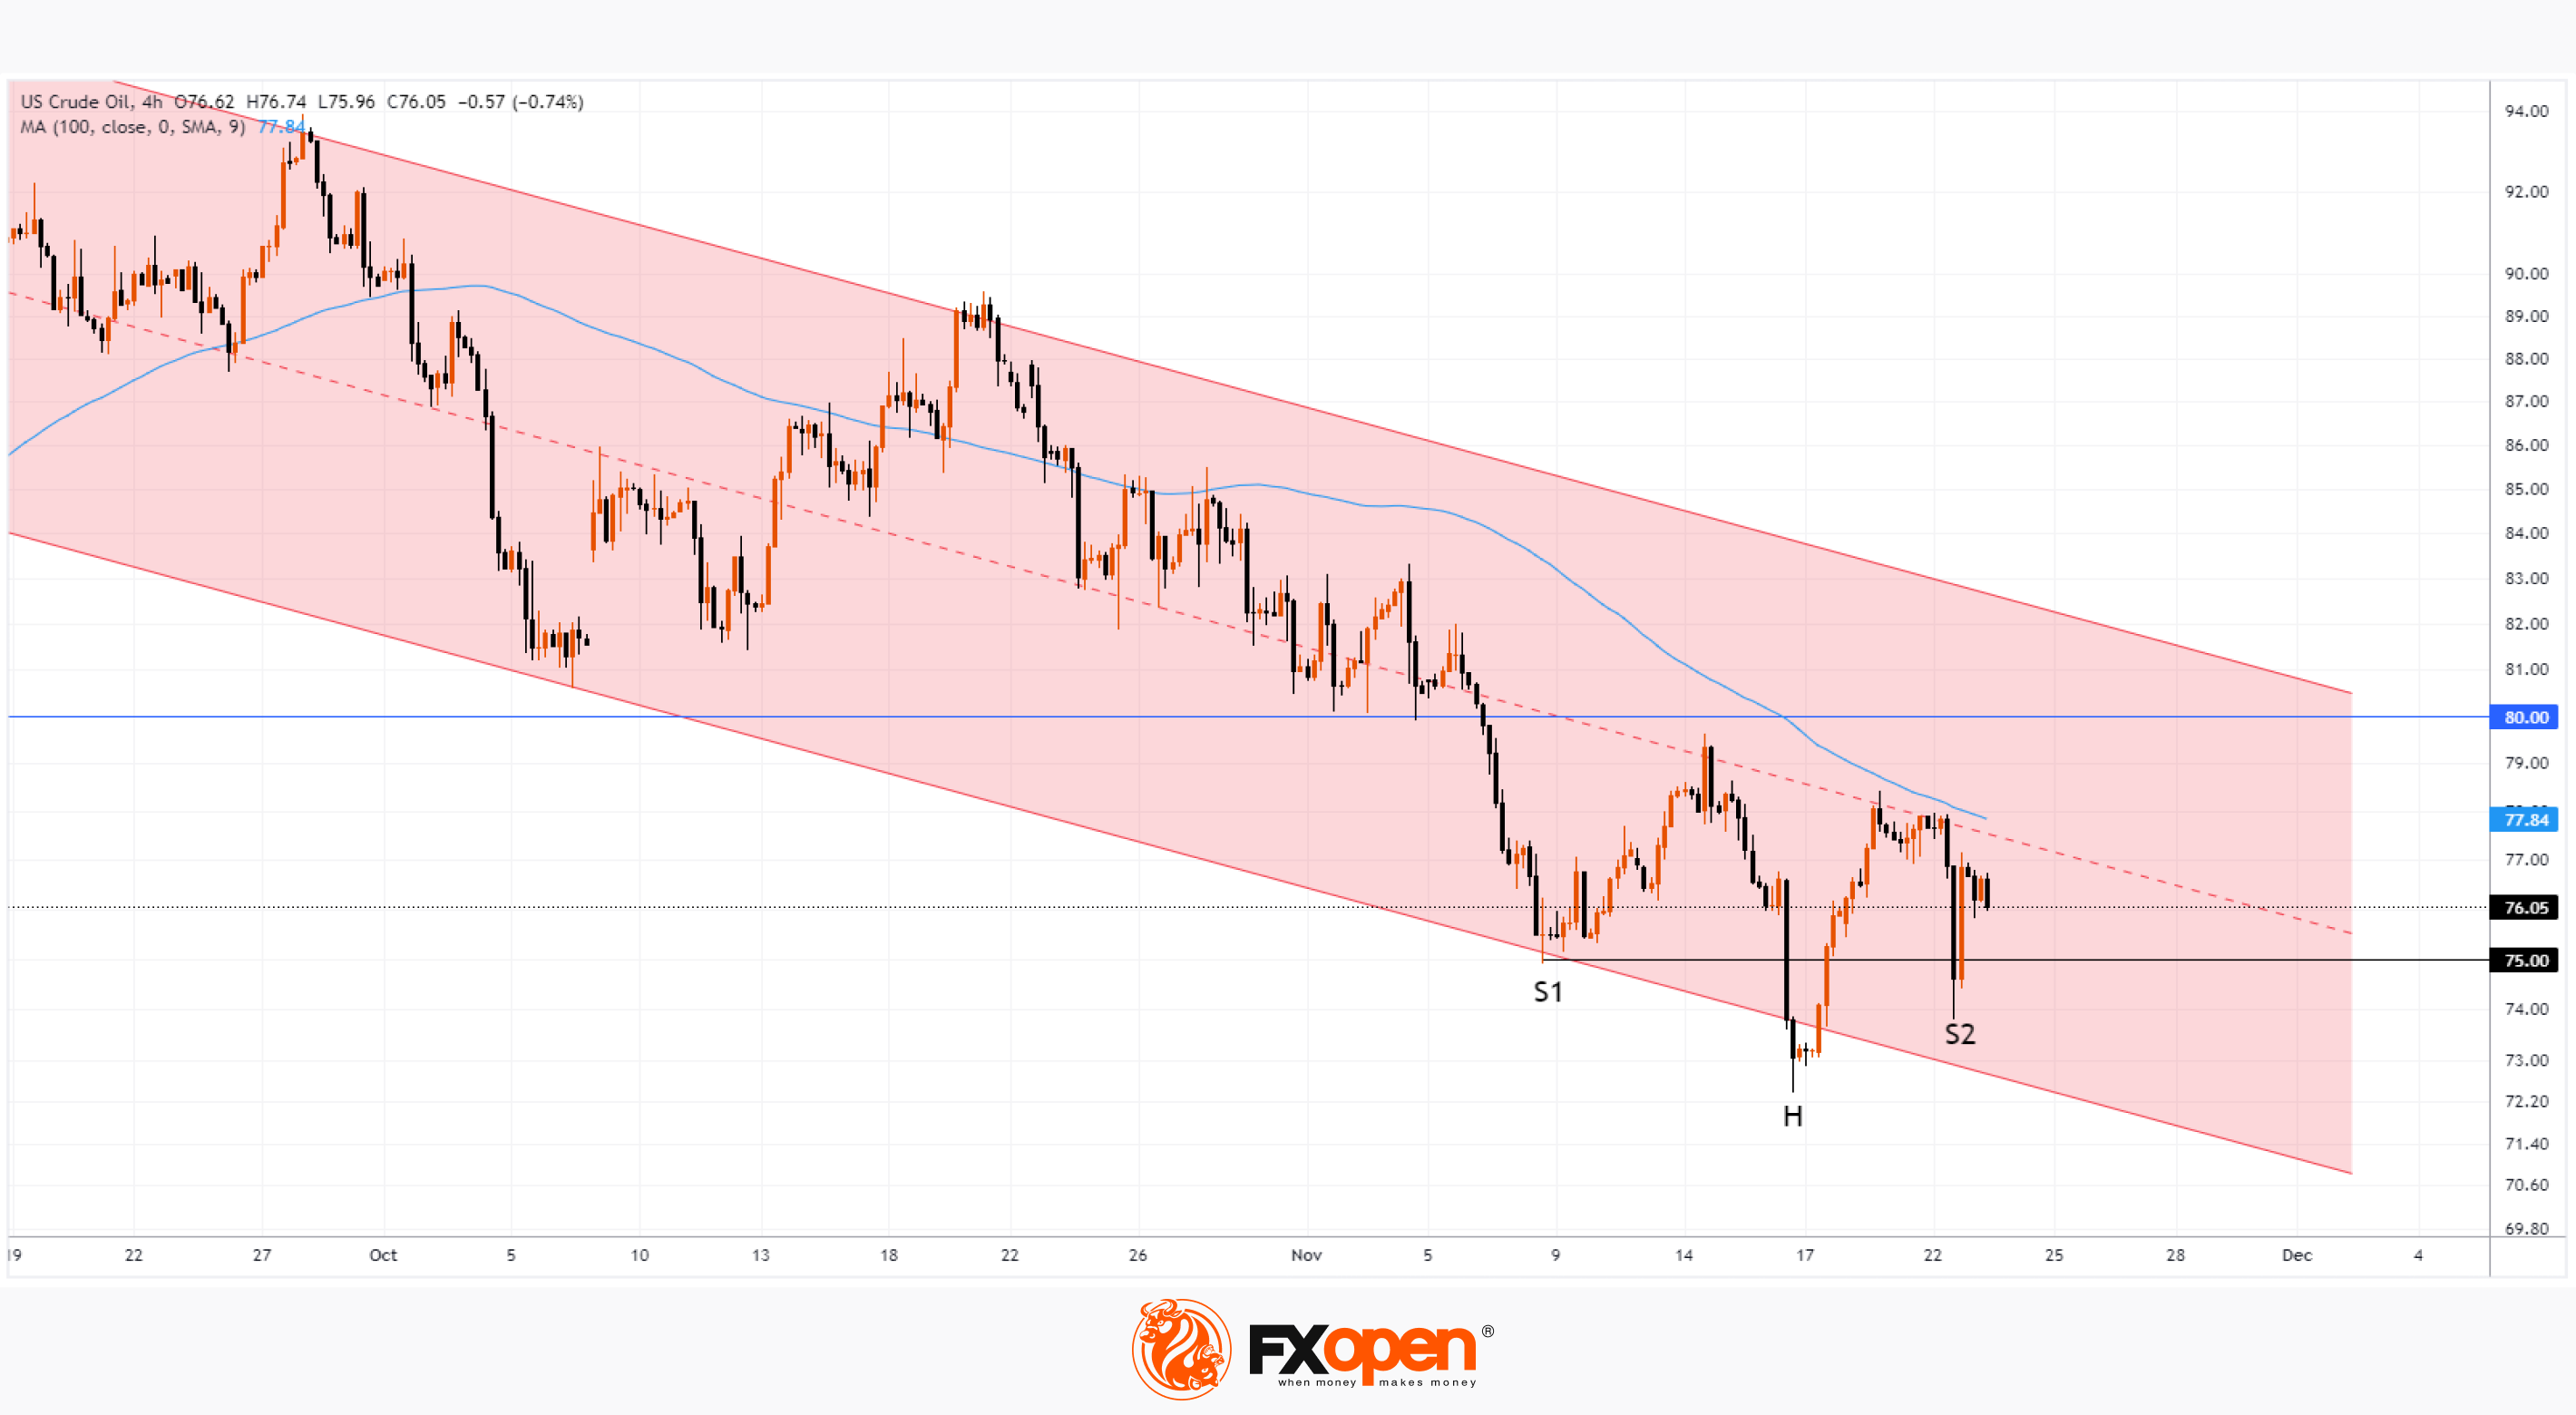
A new attempt by the bears to push the price down from the median line occurred on November 22, but note how quickly the price of oil recovered after falling below USD 75 per barrel. This is evidence of bull aggression and the strength of demand.
At the same time, the price forms an inverted head-and-shoulders reversal pattern, as a result of which a bullish breakdown of the current descending channel may occur, although if this event occurs, it is unlikely in the near future, since first the bulls need to overcome the resistance from the median line. Also, the bulls will have psychological resistance at USD 80 and, possibly, the SMA (100), directed downwards.
Market participants are focusing on the OPEC+ meeting, which was postponed to November 30. It is reported that some members of the bloc of oil-producing countries are dissatisfied with the current policy of cutting production, as attempts to maintain world oil prices by reducing market supply do not allow them to achieve budgetary goals.
It is possible that by the end of the month we will see spikes in volatility against the backdrop of news related to OPEC+.
Start trading commodity CFDs with tight spreads (additional fees may apply). Open your trading account now or learn more about trading commodity CFDs with FXOpen.
This article represents the opinion of the Companies operating under the FXOpen brand only. It is not to be construed as an offer, solicitation, or recommendation with respect to products and services provided by the Companies operating under the FXOpen brand, nor is it to be considered financial advice.
Stay ahead of the market!
Subscribe now to our mailing list and receive the latest market news and insights delivered directly to your inbox.


Latest articles

Tesla (TSLA) Shares Surge Following Musk’s Announcements
According to the chart, Tesla (TSLA) shares had been under significant pressure since the start of 2026: from their December high, they had lost around 25% of their value. The main bearish drivers included:
→ Intense competition from Chinese automakers, particularly

XTI/USD Analysis: WTI Oil Prices Under Pressure from Trump’s Statements
Yesterday, following a false bullish breakout above the psychological $100 level, WTI crude prices fell sharply towards the $85 area. The primary driver of this rapid decline was comments made by the US President.
According to Donald Trump:
→ the United
