


META Analysis: Musk vs Zuckerberg
FXOpen

Since the beginning of 2021, META and TSLA shares have seemingly been in competition with each other. Either the price of META is higher than the price of TSLA, or vice versa. The turn has come to the rivalry of the CEOs, in the literal sense.
It started when Zuckerberg announced the idea to create a competitor to Twitter. Musk probably didn’t like it, and in response he offered to fight. Zuckerberg accepted the challenge, asking him to name a venue. Musk chose an arena in Vegas as the venue for the fight.
Musk has a size advantage, and according to him, he has experience in tough street fights in South Africa. Zuckerberg has an age advantage as well as a jiu-jitsu belt.
In anticipation of the battle of billionaires, it is worth paying attention to the META stock chart.
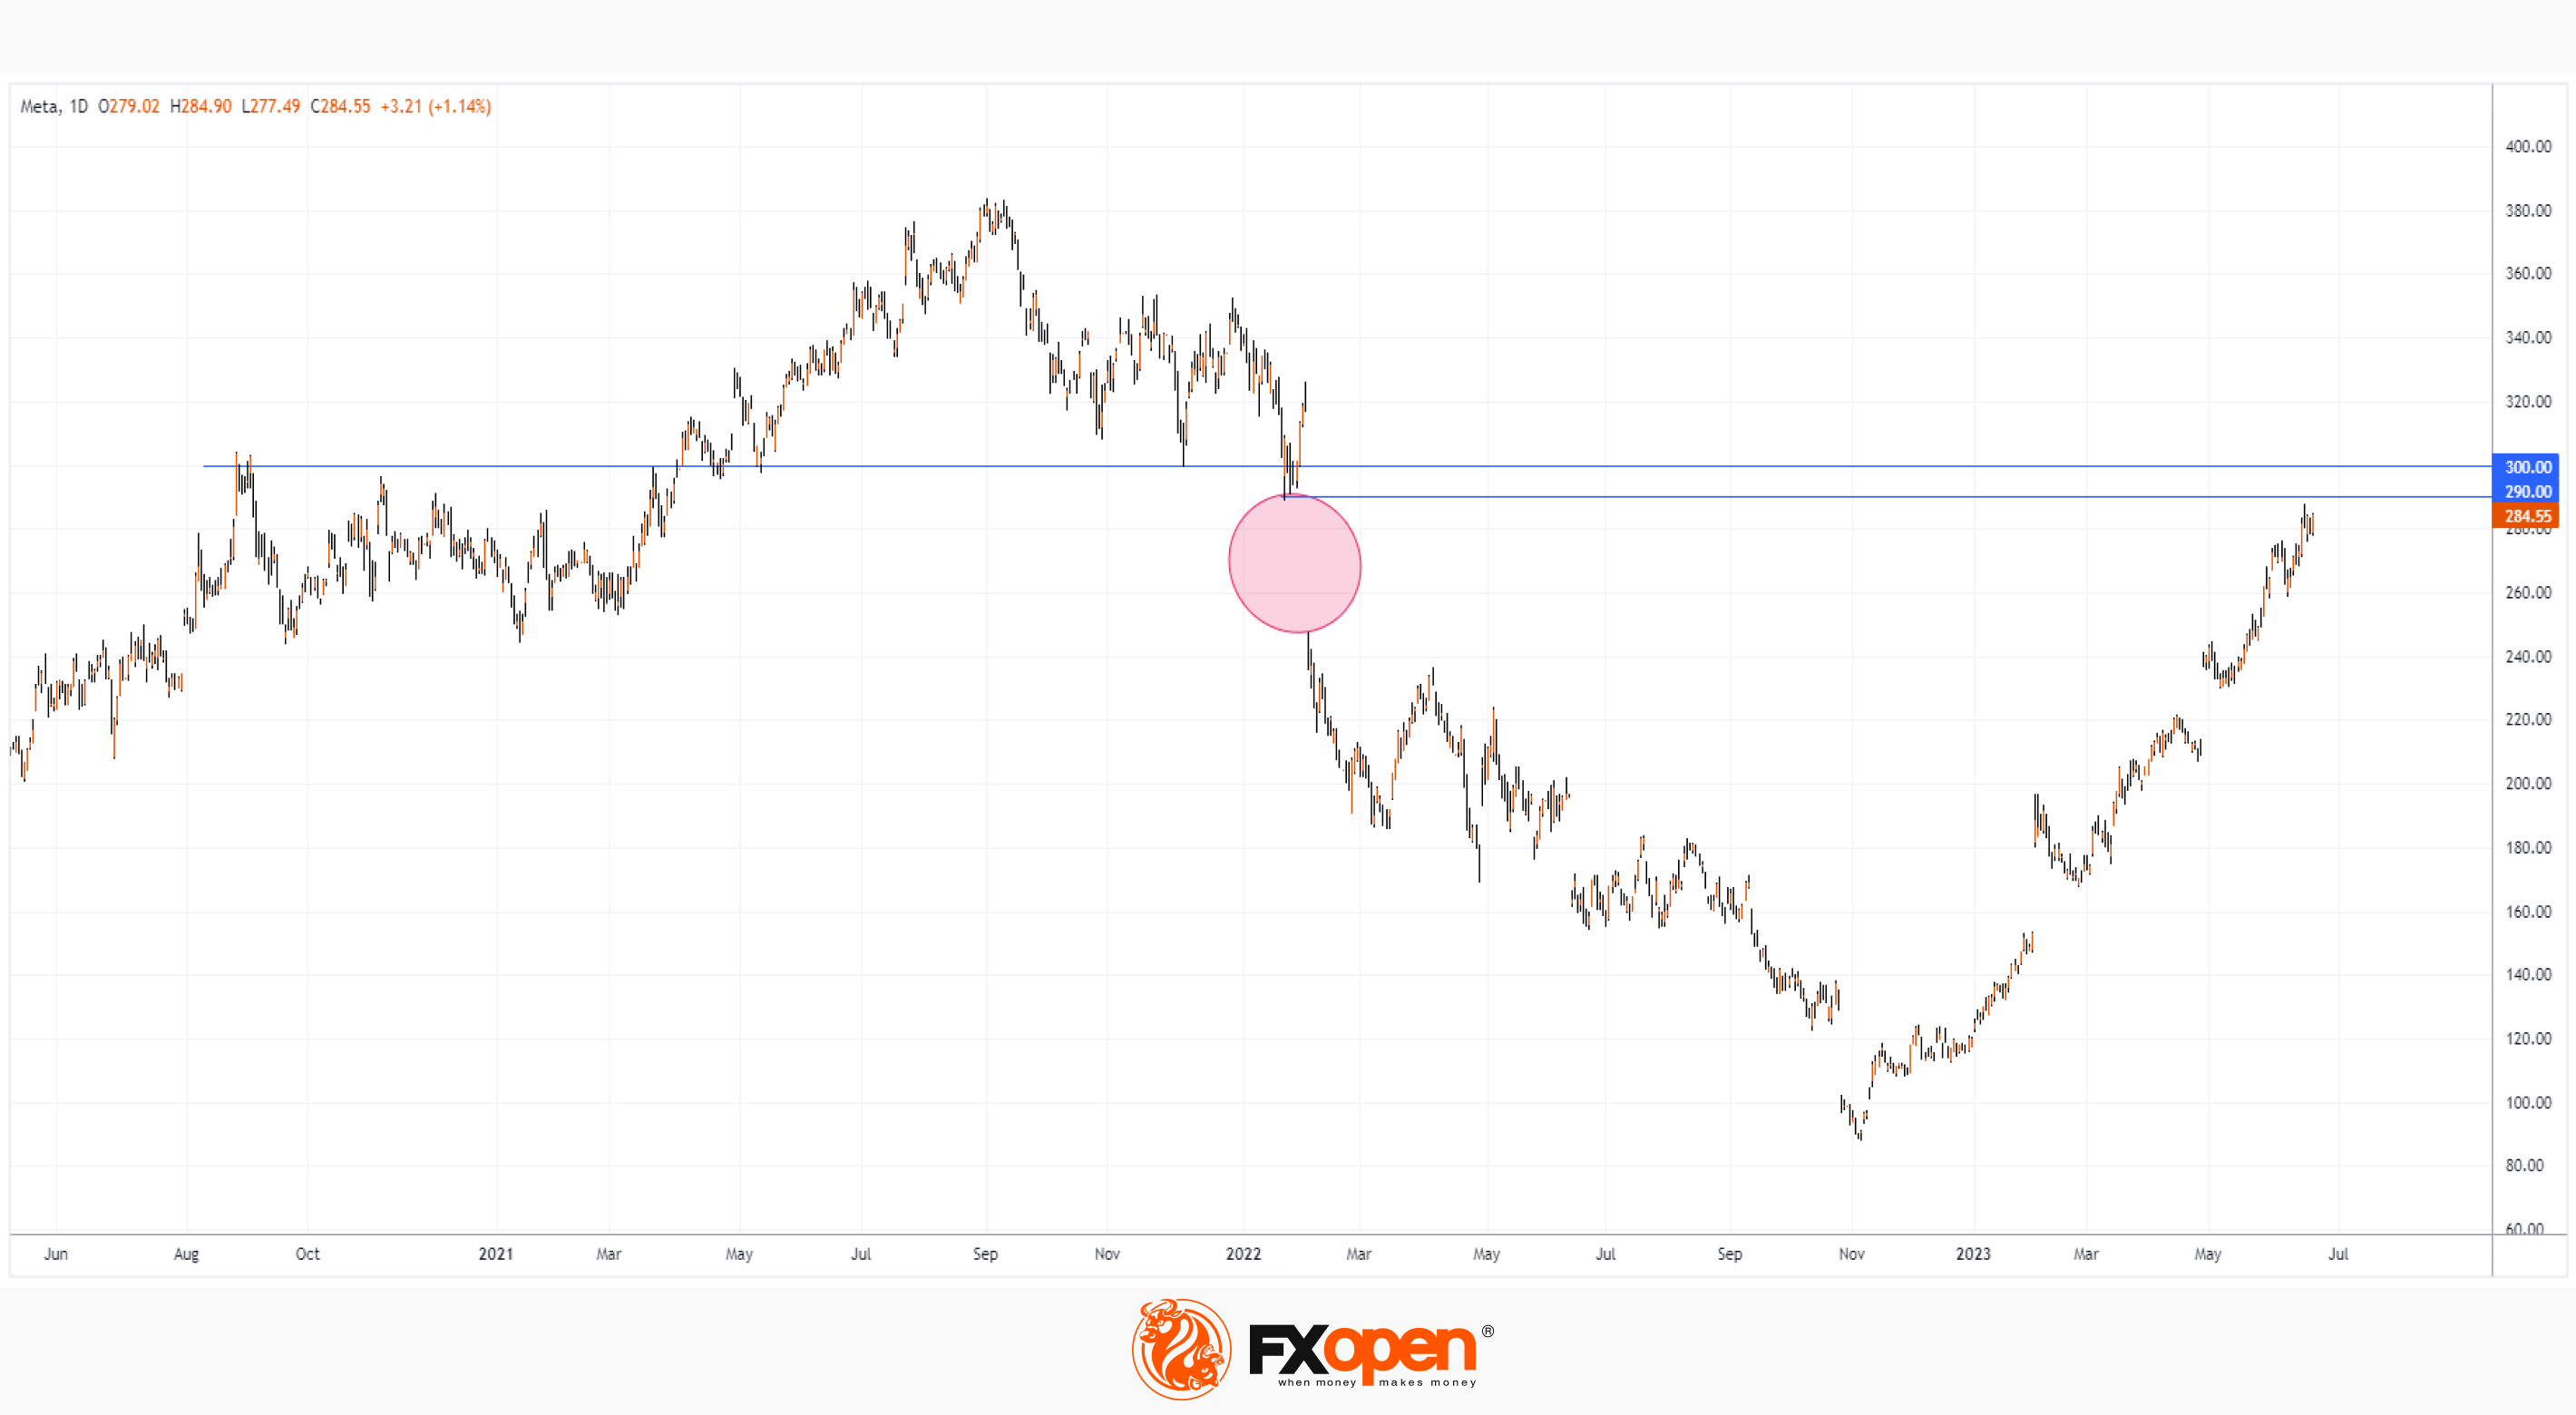
The price of META is near the level of USD 290 per share, which practically means the closing of the gap that formed in 2022. Also, the price of META shares is near the psychological mark of USD 300 – it has influenced the price more than once since 2021. So the 290-300 resistance area may well contribute to the start of a correction for the META share price, which has risen by more than 140% since the beginning of the year.
Buy and sell stocks of the world's biggest publicly-listed companies with CFDs on FXOpen’s trading platform. Open your FXOpen account now or learn more about trading share CFDs with FXOpen.
This article represents the opinion of the Companies operating under the FXOpen brand only. It is not to be construed as an offer, solicitation, or recommendation with respect to products and services provided by the Companies operating under the FXOpen brand, nor is it to be considered financial advice.
Stay ahead of the market!
Subscribe now to our mailing list and receive the latest market news and insights delivered directly to your inbox.


Latest articles

Meta: V-Shaped Recovery Meets Heavy Volume Resistance
The movement in Meta Platforms shares is being driven by two competing narratives. On one hand, advertising revenue is benefiting from AI-based tools: the Advantage+ platform continues to support strong advertiser demand, and the analyst consensus for Q1 2026 revenue

Commodity Currencies Test Key Levels Ahead of Major Macro Data
Commodity-linked currencies are trading near key levels, showing restrained price action as market participants adopt a wait-and-see approach. The fundamental backdrop is shaped by expectations surrounding the release of Australia’s inflation data and the Bank of Canada’s interest

Microsoft Shares Two Days Ahead of Earnings Release
In January, Microsoft shares came under pressure following the company’s earnings report. Although both revenue and earnings per share exceeded analysts’ expectations, growth in the Azure cloud platform slowed to 39% year-on-year from 40% in the previous quarter—enough