


FXOpen

The stock market is eagerly awaiting the start of the quarterly earnings season. Traditionally, it kicks off with reports from major players in the financial sector, including Morgan Stanley (MS). The bank's earnings report is scheduled for tomorrow, Thursday, before the opening of the main trading session.
According to Yahoo Finance, analysts expect:
→ Earnings per share (EPS) to be $1.62, indicating a 43.4% increase compared to the previous year;
→ Revenue to reach $14.8 billion, reflecting a 14.7% rise year-on-year.
Meanwhile, MS’s share price may also be influenced by internal organisational changes at Morgan Stanley. The bank has created a new division to enhance client relations and appointed a new head of wealth management.
MarketWatch notes that the upcoming earnings season could be the strongest in three years (based on FactSet data), with the financial sector likely to be the largest contributor to profits this season. Furthermore, a technical analysis of Morgan Stanley’s (MS) stock chart suggests that market participants are optimistic.
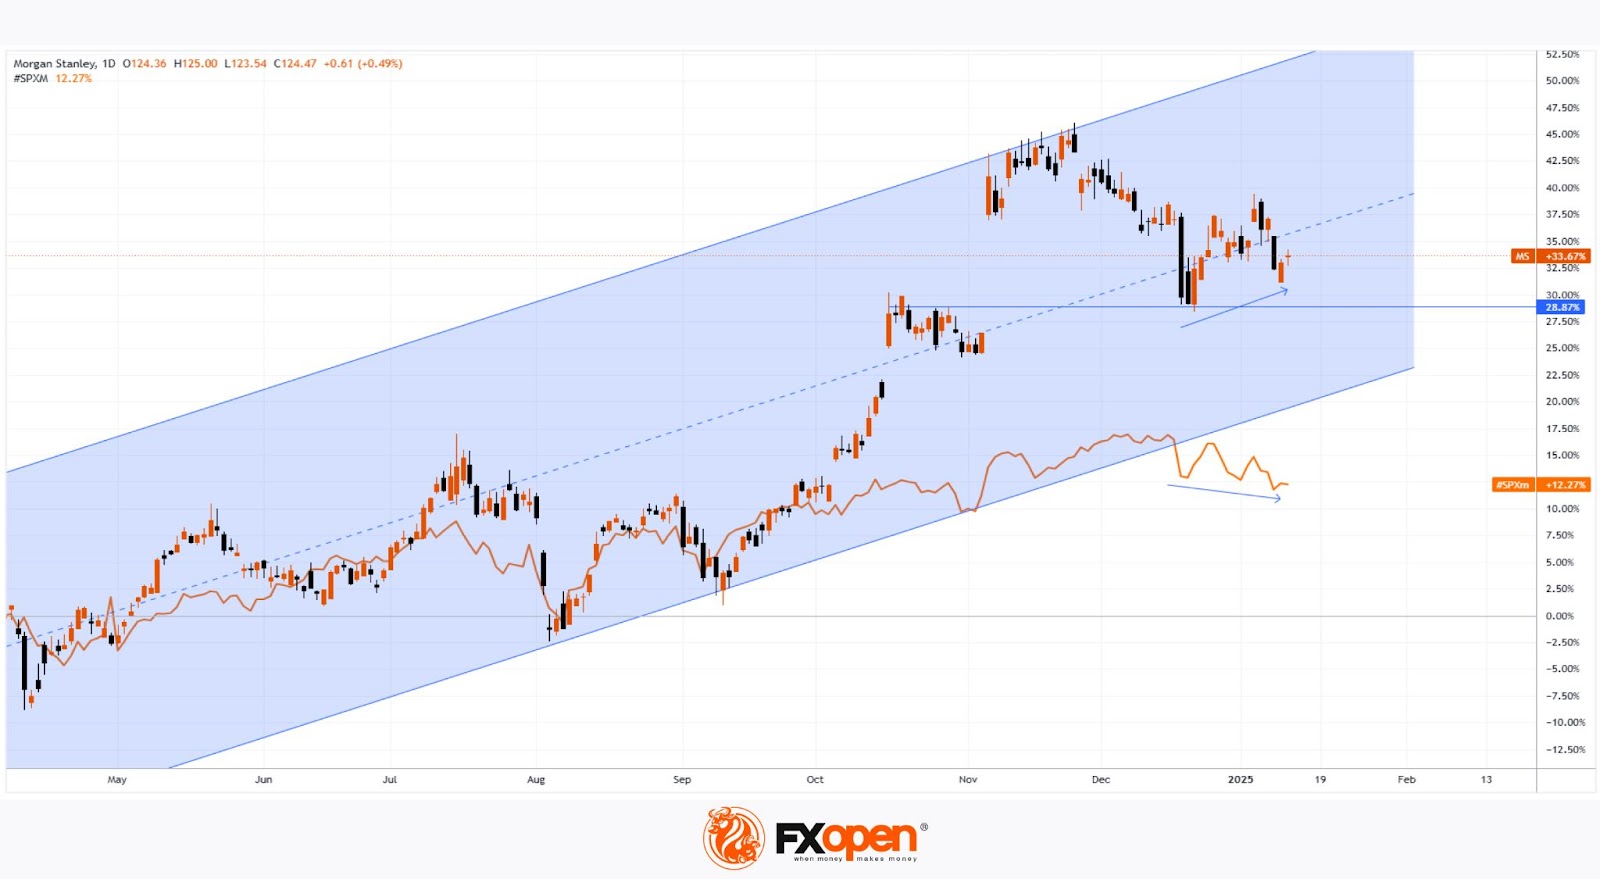
Indeed:
→ Price fluctuations have formed an upward channel (marked in blue), with the share price stabilising around its median line—likely in anticipation of corporate news;
→ During the stock market decline in early 2025, MS’s share price fell less than the S&P 500 index (US SPX 500 mini on FXOpen), as indicated by arrows;
→ The $120 level appears to be a significant support zone.
It’s possible that today’s earnings reports from banks such as JPMorgan (JPM), Wells Fargo & Co. (WFC), Goldman Sachs Group Inc. (GS), and Citigroup Inc. (C) may offer clues about how MS’s stock price might move next.
Buy and sell stocks of the world's biggest publicly-listed companies with CFDs on FXOpen’s trading platform. Open your FXOpen account now or learn more about trading share CFDs with FXOpen.
This article represents the opinion of the Companies operating under the FXOpen brand only. It is not to be construed as an offer, solicitation, or recommendation with respect to products and services provided by the Companies operating under the FXOpen brand, nor is it to be considered financial advice.
Stay ahead of the market!
Subscribe now to our mailing list and receive the latest market news and insights delivered directly to your inbox.


Latest articles

Weak Data Weigh on the Dollar: Market Awaits Trend Confirmation
The US dollar is retreating from recent highs, moving into a moderate correction after a prolonged period of gains. Pressure on the currency is building amid weaker-than-expected macroeconomic data, while market participants adopt a wait-and-see approach ahead of key labour

Market Analysis: EUR/USD Aims Recovery While USD/JPY Gives Back Recent Gains
EUR/USD is recovering losses from 1.1450. USD/JPY is correcting gains from 160.50 and might decline further below 158.00.
Important Takeaways for EUR/USD and USD/JPY Analysis Today
· The Euro struggled to stay in a

European Currencies Decline: Pound Hits New Lows, Euro Under Pressure
European currencies continue to weaken against the US dollar amid rising geopolitical tensions and increased demand for safe-haven and liquid assets. Market participants are reducing exposure to riskier instruments, putting pressure on both the euro and the pound. Additional support