


FXOpen

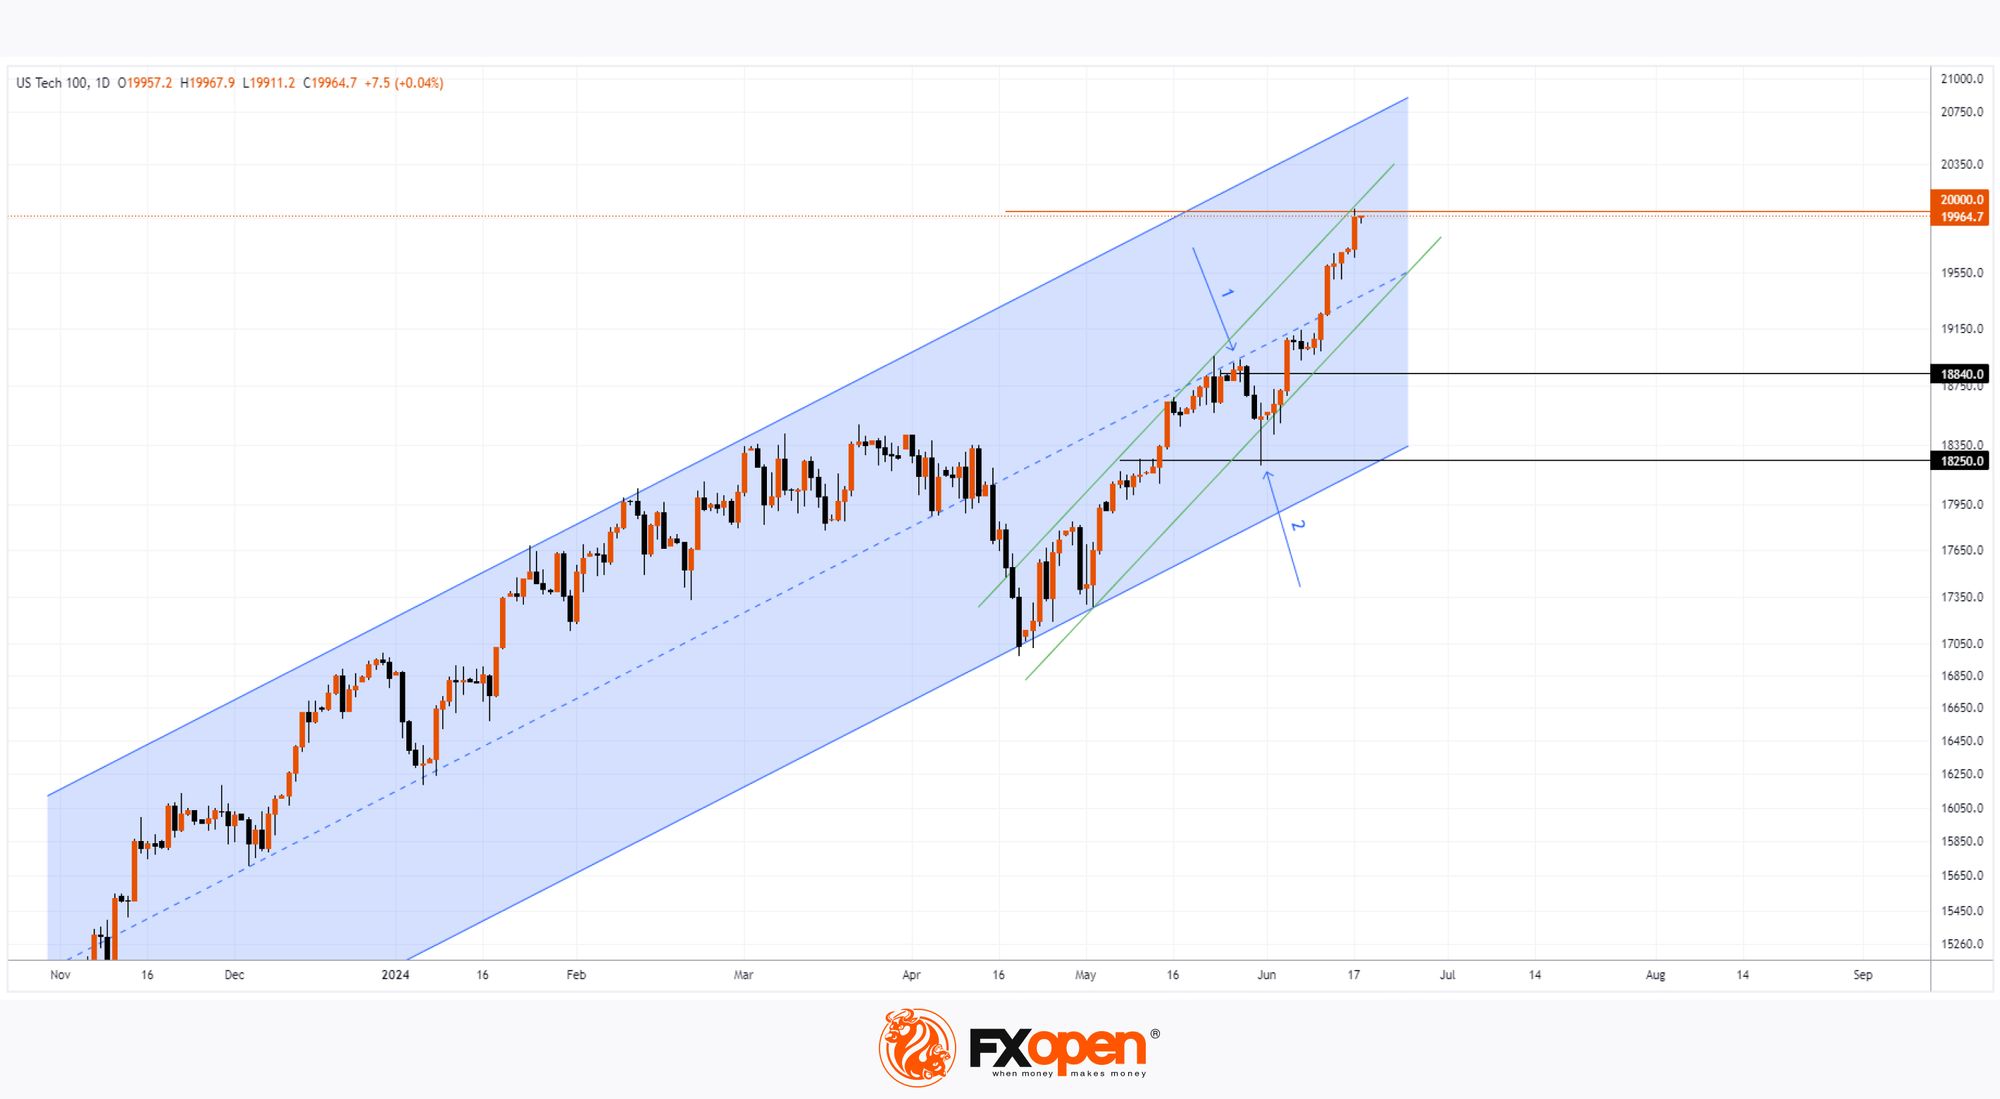
On 30 May, we noted some uncertainty in the price behaviour of the Nasdaq 100 (US Tech 100 mini on FXOpen) near the resistance level of 18,840, as shown by arrow #1.
Following this, the price declined and tested the former resistance at 18,250 (indicated by arrow #2) – the long lower shadow on the candle indicated aggressive demand (more details in the article on the Hammer pattern).
This test gave the bulls confidence to break through the 18,840 resistance.
In June, the price continued to rally within the ascending channel (shown in green), which is part of a larger ascending channel (shown in blue), driven by:
→ prospects for AI implementation;
→ prospects of Fed rate cuts.
Yesterday, the Nasdaq 100 (US Tech 100 mini on FXOpen) rose by approximately 1.2%, reaching the psychological level of 20,000 points. This record was supported by influential analysts raising their forecasts for US stock markets. For example:
→ Goldman Sachs raised the year-end 2024 target for the S&P 500 (US SPX 500 mini on FXOpen) from 5200 to 5600;
→ Evercore ISI increased its forecast for the same index from 4750 to 6000.
Market sentiment was also buoyed by the anticipation of several comments from FOMC members scheduled for this week. These might confirm the Fed's intention to cut rates as early as September this year.
Technical analysis of the Nasdaq 100 (US Tech 100 mini on FXOpen) shows that:
→ The price is in the upper half of the blue channel, with its median line potentially serving as support.
→ The price is near the upper boundary of the green channel, which can be considered resistance. This suggests that the price might retreat from the psychological level of 20k towards the lower boundary of the green channel.
It is possible that the current bullish drivers will remain relevant until September, allowing the Nasdaq 100 (US Tech 100 mini on FXOpen) to continue rising towards the upper boundary of the blue channel.
Trade global index CFDs with zero commission and tight spreads (additional fees may apply). Open your FXOpen account now or learn more about trading index CFDs with FXOpen.
This article represents the opinion of the Companies operating under the FXOpen brand only. It is not to be construed as an offer, solicitation, or recommendation with respect to products and services provided by the Companies operating under the FXOpen brand, nor is it to be considered financial advice.
Stay ahead of the market!
Subscribe now to our mailing list and receive the latest market news and insights delivered directly to your inbox.


Latest articles

Market Analysis: GBP/USD Dips Further As EUR/GBP Regains Traction
GBP/USD failed to climb above 1.3500 and corrected some gains. EUR/GBP started a decent increase and might aim for more gains above 0.8700.
Important Takeaways for GBP/USD and EUR/GBP Analysis Today
· The British Pound


Market Insights with Gary Thomson: Oil, US Retail Sales & NFP in Focus
In this video, we’ll explore the key economic events and market trends, shaping the financial landscape. Get ready for insights into financial markets to help you navigate the week ahead. Let’s dive in!
In this episode of Market