


S&P 500 Analysis: Best Week of the Year, Despite Bad News from Labour Market
FXOpen
According to Friday's data, in the US:
→ the unemployment rate rose to 3.9% (expected = 3.8%). The last time the level was this high was in February 2022.
→ the number of workers employed in the non-agricultural sector increased over the month by only 150k (+178k expected). The last time the figure was below 150k was in February 2021.
Published negative data clearly indicate a cooling of the labour market. Why then did the E-mini S&P-500 futures price end the week up about 5.5%, marking the best week of 2023?
The point is that market participants are increasingly convinced that the Fed will no longer tighten monetary policy. That is, interest rates have peaked, the next step should be to ease them, which will allow companies to grow.
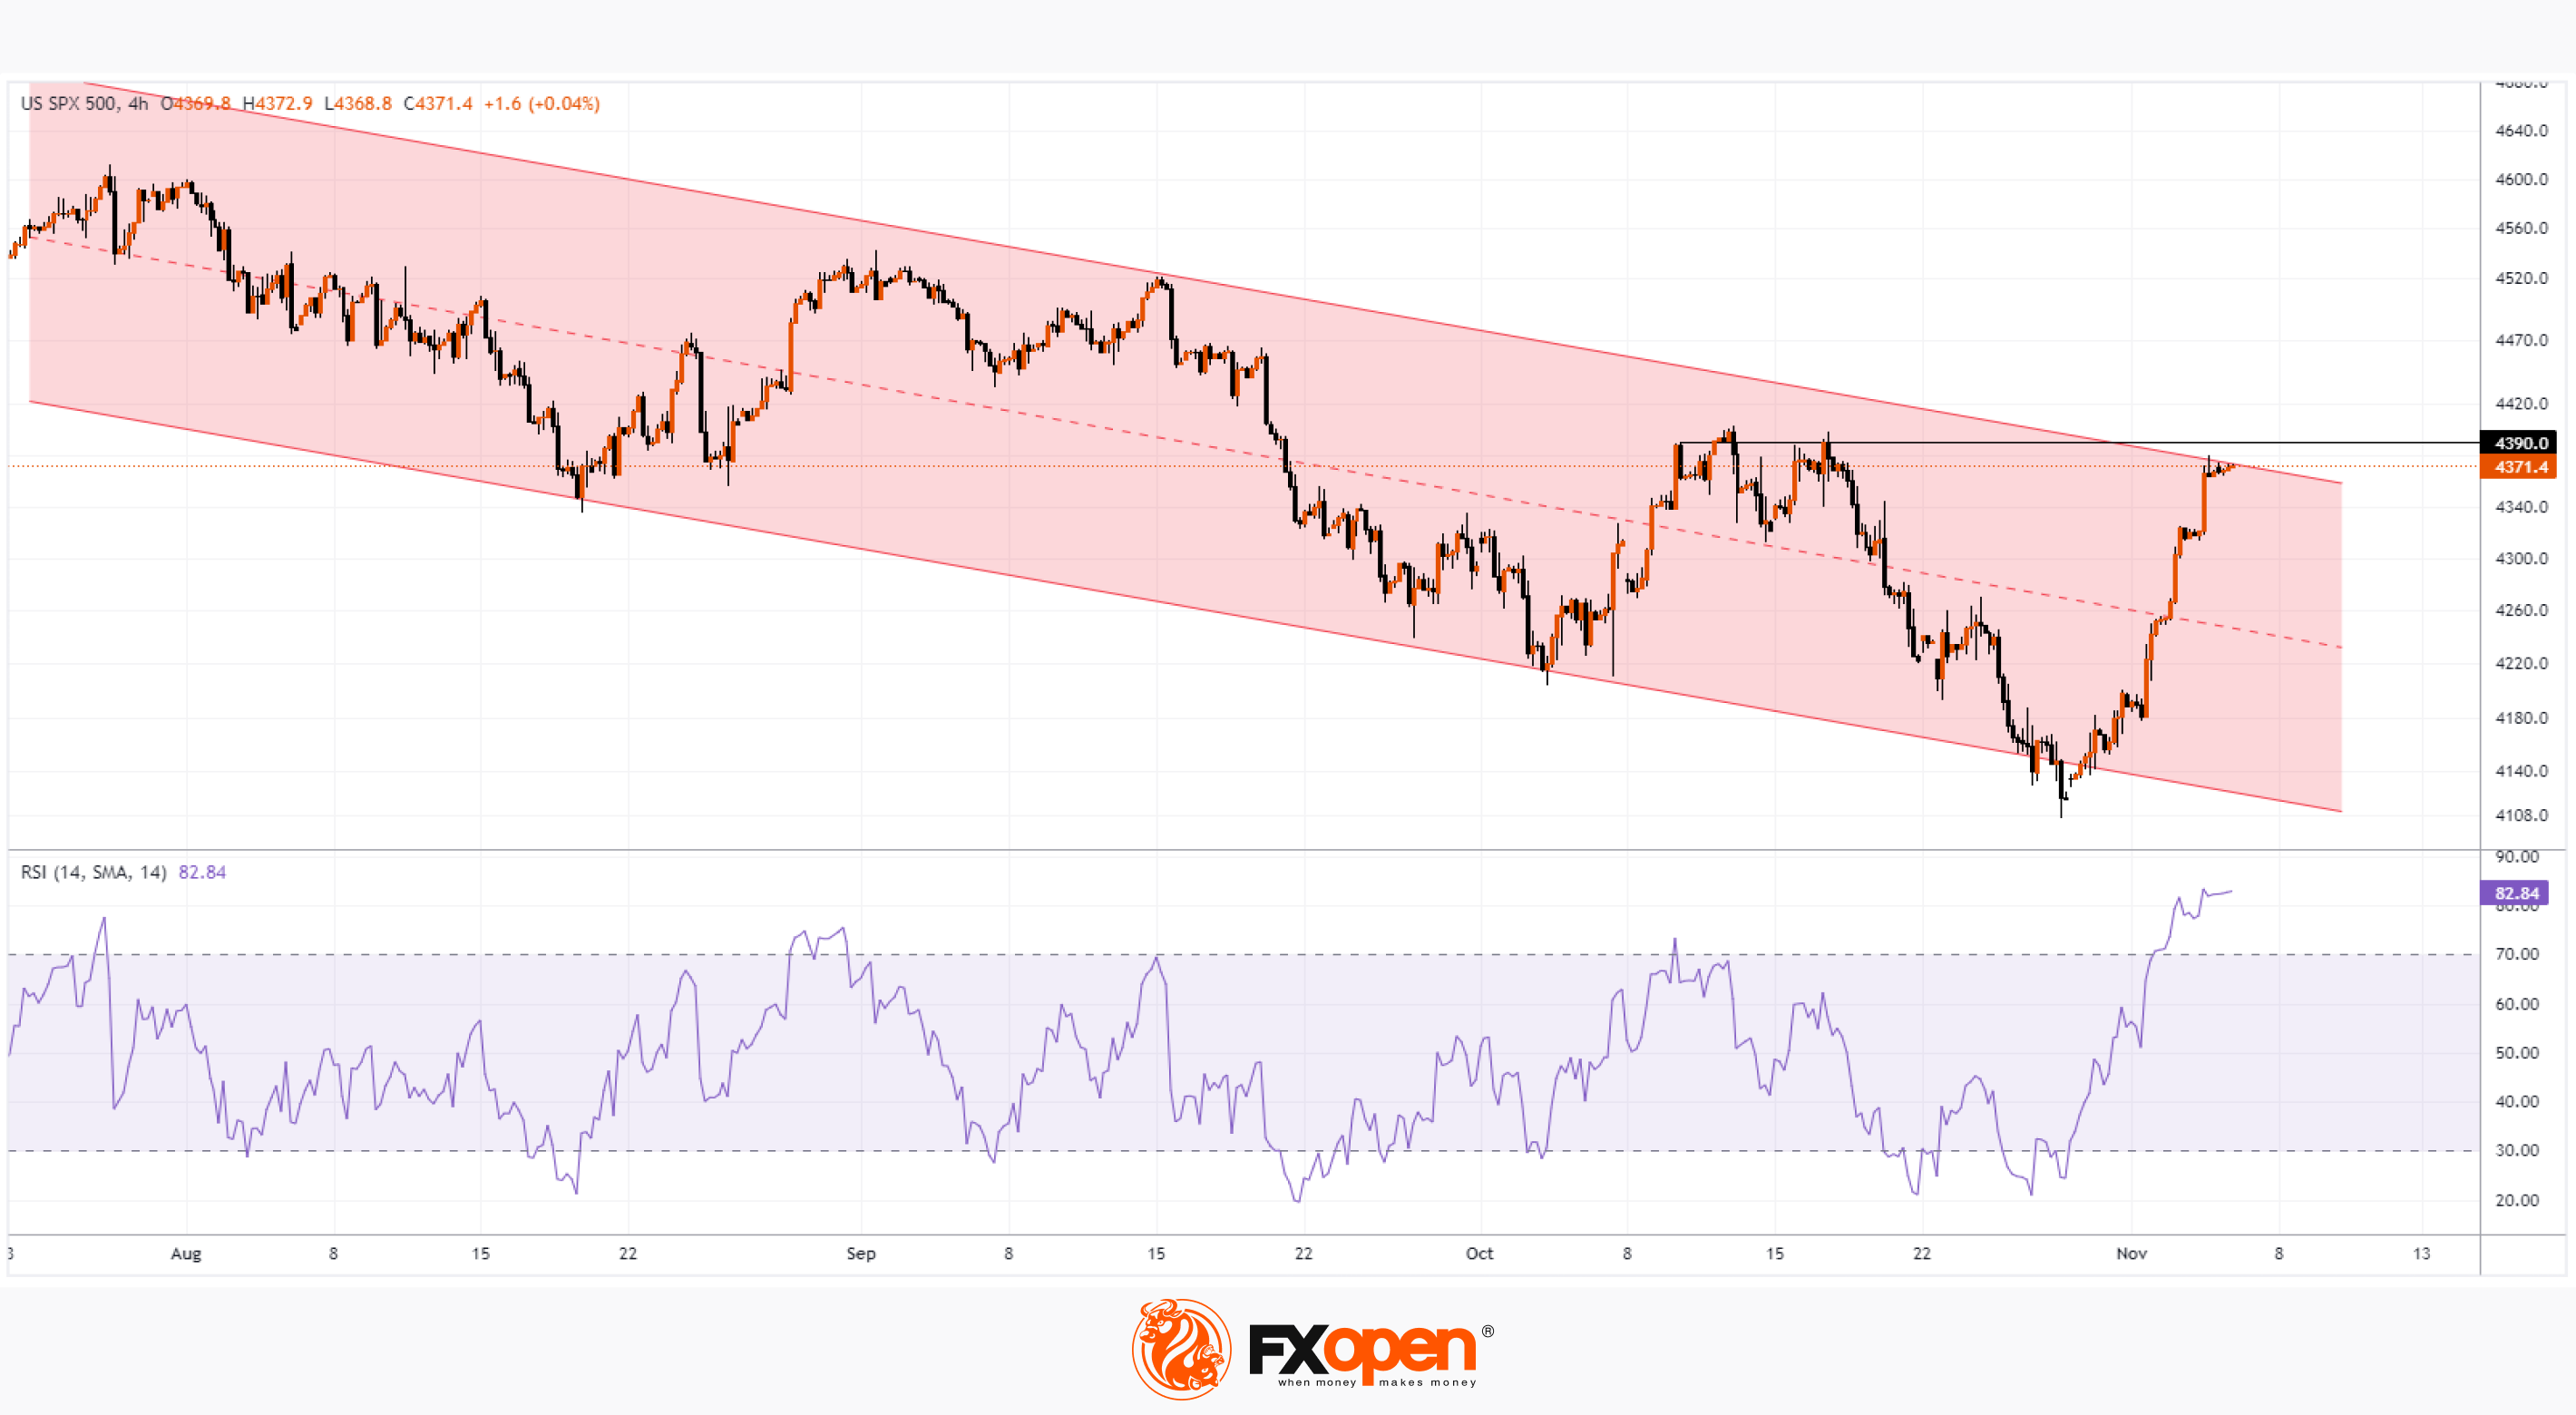
The 4-hour chart of the S&P 500 shows that the index price:
→ has reached the upper border of the descending channel, above which there is a resistance line from the October highs;
→ the RSI indicates severe overbought.
That is, the market is in a vulnerable position for the formation of a rollback from current price levels. If the price goes into a pullback, it will be an important test for the current positive interpretations of statistical data — is rising unemployment really a good thing for the stock market?
Trade global index CFDs with zero commission and tight spreads (additional fees may apply). Open your FXOpen account now or learn more about trading index CFDs with FXOpen.
This article represents the opinion of the Companies operating under the FXOpen brand only. It is not to be construed as an offer, solicitation, or recommendation with respect to products and services provided by the Companies operating under the FXOpen brand, nor is it to be considered financial advice.
Stay ahead of the market!
Subscribe now to our mailing list and receive the latest market news and insights delivered directly to your inbox.


Latest articles

Dow Jones (DJIA): Consolidation Beyond the Trend
Federal Reserve Chair Kevin Warsh testified before Congress on 14–15 July, reaffirming the Fed's commitment to bringing inflation back to target while providing no clear guidance on the future path of interest rates. Meanwhile, June inflation data came in

European Currencies Strengthen Ahead of Key Macroeconomic Releases
EUR/USD and GBP/USD continue to recover moderately following the recent weakening of the US dollar. European currencies have been supported by expectations that US inflationary pressures will continue to ease after softer-than-expected CPI and PPI data, reinforcing market

Brent Crude Oil: From Ceasefire to Crossfire — What's Next?
Just weeks ago, traders were pricing in peace. Now they're pricing in war again—and that reversal says everything about how fragile the current Middle East calm really is.
Brent crude has surged to $86 a barrel, its highest level