


The Share Price of Alibaba (BABA) Has Reached Its Yearly High
FXOpen

On 14 May, Alibaba released its first-quarter performance report:
→ Earnings per share: actual = $1.404, expected = $1.421;
→ Gross income: actual = $30.716 billion, expected = $30.502 billion.
The fact that earnings per share were slightly below expectations did not disappoint investors much, as on 16 May, Alibaba's share price (BABA) reached a yearly high, exceeding $86, forming a wide bullish candlestick with a close near the top (a sign of strong demand).
Positive sentiments were also driven by:
→ Another Chinese company, JD.com, released a report that exceeded expectations;
→ US regulators published information that well-known investor Michael Burry invested in Alibaba shares. David Tepper, head of the hedge fund Appaloosa Management, also holds a bullish outlook;
→ According to a note published on X (Twitter) by Citron Research analysts, Alibaba's share price could rise to $100.
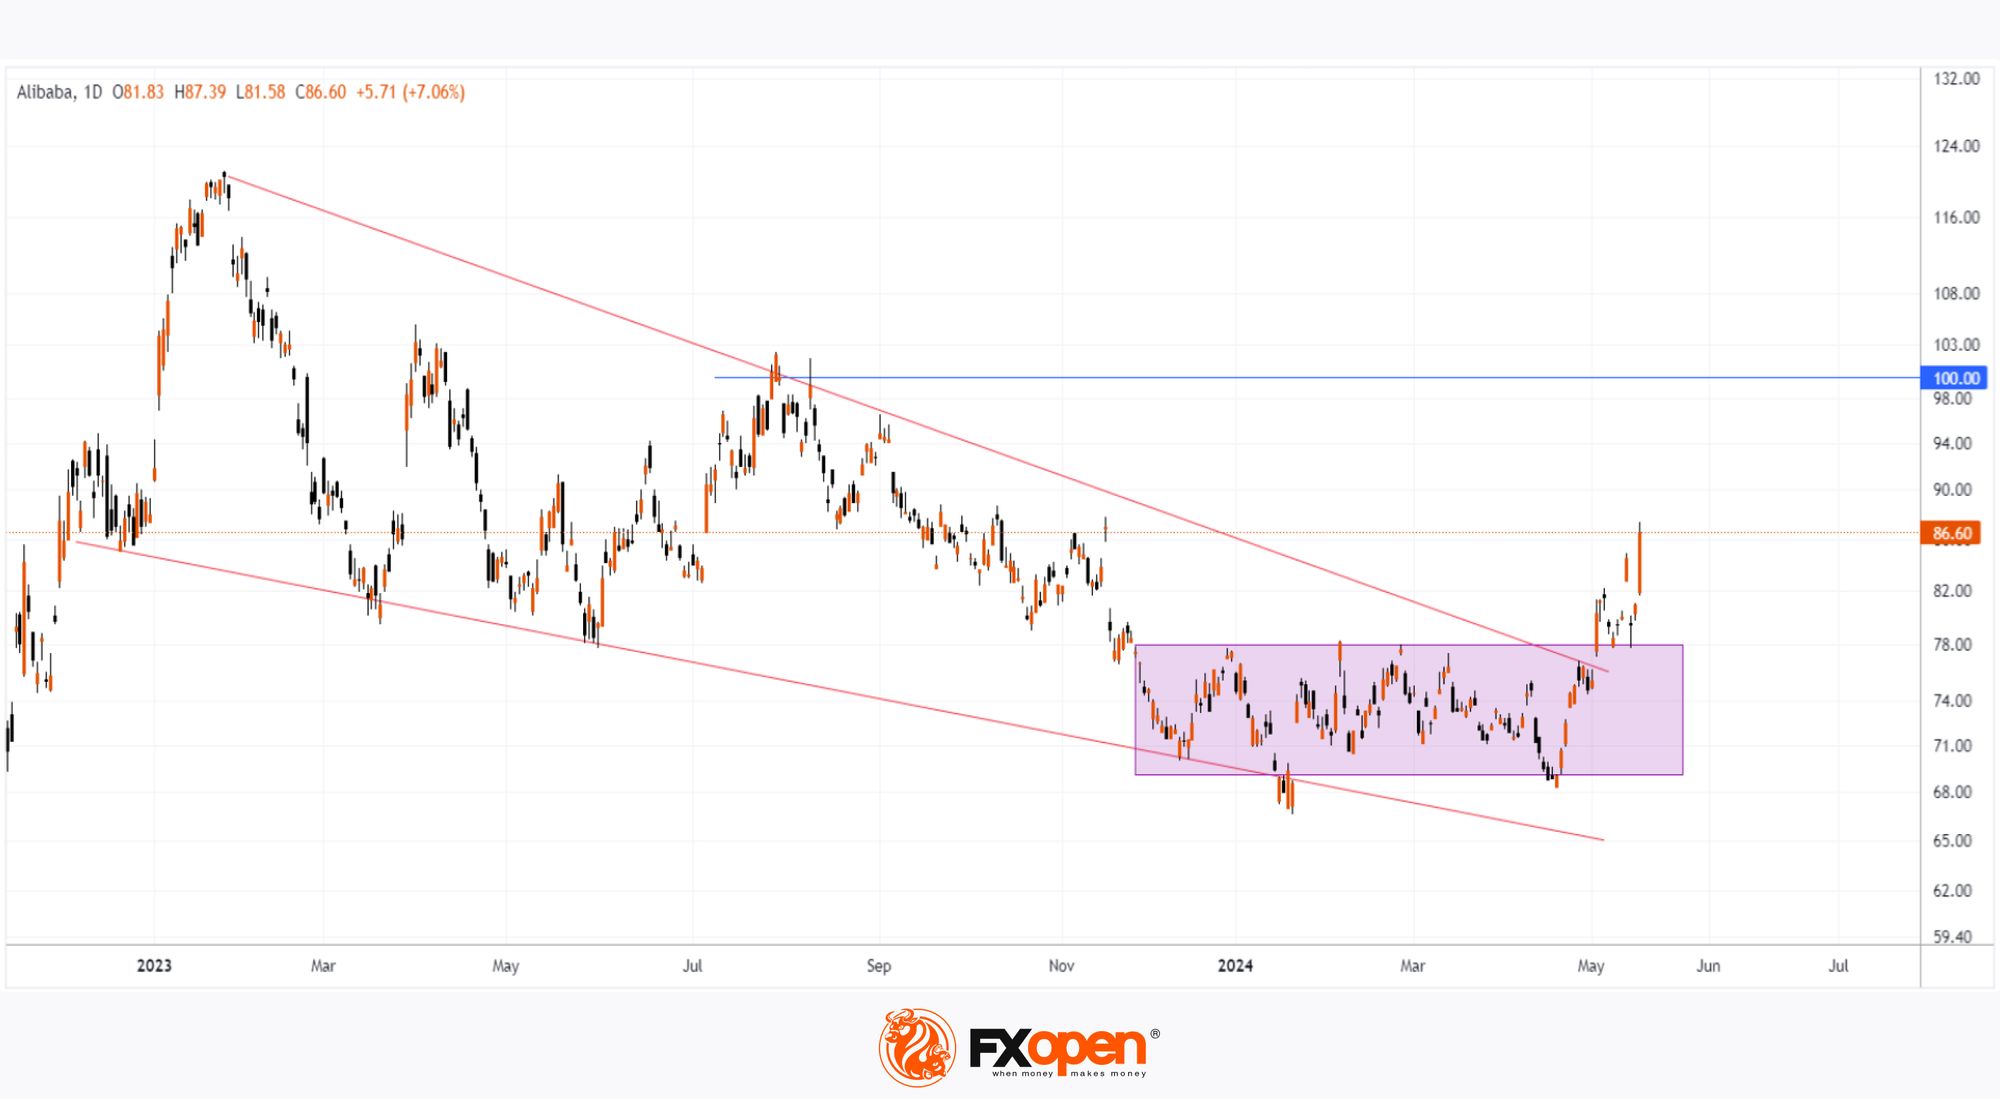
According to the technical analysis of the BABA share chart:
→ The price broke upwards from a narrowing triangle (shown in red lines) – this is a bullish sign;
→ In April, the price did not reach the lower boundary of the triangle at its lowest point – this confirms strong demand;
→ The purple rectangle can be seen as the range in which large hedge funds accumulated BABA shares;
→ Extending the height of the rectangle upwards from its upper boundary, we get a resistance level of $87, which is where the current quotation is located.
It is also worth noting that the psychological level of $100 per BABA share acted as resistance last summer.
Given the above, it is reasonable to assume that BABA's share price could form a significant rally in the long-term with short-term corrections.
According to TipRanks, the average forecasted price for BABA shares in 12 months is $105.13.
Buy and sell stocks of the world's biggest publicly-listed companies with CFDs on FXOpen’s trading platform. Open your FXOpen account now or learn more about trading share CFDs with FXOpen.
This article represents the opinion of the Companies operating under the FXOpen brand only. It is not to be construed as an offer, solicitation, or recommendation with respect to products and services provided by the Companies operating under the FXOpen brand, nor is it to be considered financial advice.
Stay ahead of the market!
Subscribe now to our mailing list and receive the latest market news and insights delivered directly to your inbox.


Latest articles

Ethereum: Has the Recovery Begun?
Ethereum has staged a notable rebound after once again testing the heavily watched psychological zone around 1500$. Since bouncing off this support, ETH/USD has climbed roughly 13%, now trading around the $1,700 mark.
This recovery is being driven

Oil Prices Are Back at Pre-Conflict Levels. Analysts Are Divided
At the start of May, oil markets were still pricing in elevated geopolitical risk and expectations of sustained supply disruption.
But easing tensions between Washington and Tehran, along with improving supply expectations, have rapidly shifted sentiment back toward fundamentals.
📉 Brent

The Dollar Awaits the Week’s Key Report: AUD/USD and NZD/USD at Crucial Technical Levels
Following mixed performance by the US dollar earlier this week, investors are now fully focused on the June Nonfarm Payrolls report, which will be released on Thursday rather than Friday. The schedule has been brought forward as US financial markets