


What Is a Megaphone Pattern and How Can You Trade It?
FXOpen
Chart patterns have been used to analyse financial markets for a long time. One popular formation in forex and other markets is the Megaphone. In this text by FXOpen, we'll explain what the setup is and how to trade using it.
What Is a Megaphone Pattern?
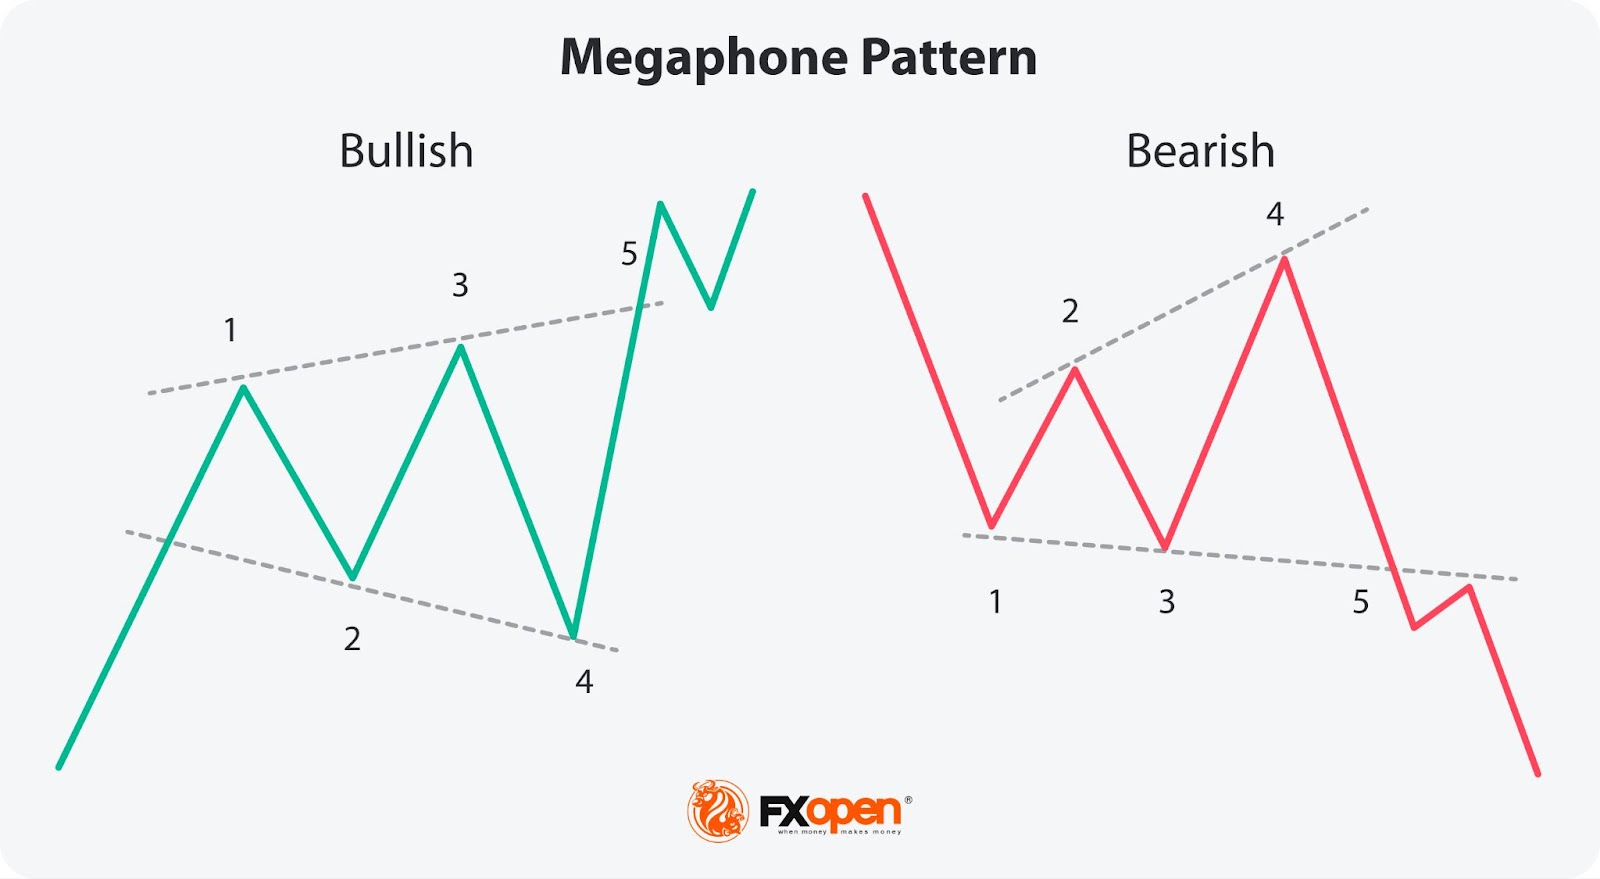
The Megaphone trading pattern, also known as a Broadening Wedge, Inverted Symmetrical Triangle, or Broadening Formation, is a chart pattern characterised by its distinct shape resembling a megaphone or a cone. It consists of two diverging trendlines, where the highs are getting higher, and the lows are getting lower, creating a widening range over time. This formation typically indicates increasing volatility and uncertainty in the market.
How to Spot a Megaphone in a Chart
The Megaphone can provide both reversal and continuation signals.
- Appearance within a trend: The Megaphone pattern may occur during a prolonged trend, indicating that the market will continue moving within the established trend.
- A reversal scenario: While the Megaphone formation can provide both continuation and reversal signals, it's more commonly associated with a reversal. In a bullish trend, a Megaphone becomes bearish and indicates a potential reversal to the downside, while in a bearish trend, the pattern becomes bullish and suggests a reversal to the upside.
- Timeframes: Megaphone patterns can be observed on various timeframes, from intraday charts to weekly or even monthly ones. However, they tend to be more reliable on longer timeframes as they encompass more price action and provide a clearer picture of market dynamics. Shorter timeframes may show more noise and false signals.
Traders often combine the Megaphone pattern with other technical indicators or chart patterns to confirm their analysis before making trading decisions. While there's no one-size-fits-all answer, traders often use technical indicators like the Relative Strength Index (RSI), Moving Averages, or Volume indicators alongside the formation to confirm signals and gauge the strength of breakouts.
Market participants sometimes combine the formation with fundamental analysis to gain a comprehensive overview of the market. Fundamental factors such as economic data releases, geopolitical events, and central bank decisions can influence price movements and add context to the interpretation of the setup.
How to Trade the Megaphone Pattern
There are two major approaches when trading the broadening Megaphone pattern. The first trading strategy is to get involved in swing trading, while the other approach is to trade breakouts.
These two approaches to trading the Megaphone pattern make it potentially easier for traders to identify opportunities and make the most of them.
Trading Swings
Swing trading is a widely used approach to catch fluctuation within the pattern. Traders start by recognising the Megaphone pattern on the chart. When trading a swing from the upper boundary, they consider shorting the asset, anticipating a reversal from the higher highs. Conversely, for a swing from a lower boundary, they look to buy, expecting a reversal from the lower lows. They usually set profit targets on the opposite trendline of the pattern and consider placing stop-loss orders beyond the trendline from where the price rebounds. This may help mitigate potential losses if the price breaks out of the formation.
Trading Breakouts
Trading the breakout of the Megaphone pattern involves waiting for the price to break the trendline after completing at least the fifth swing and closing outside the pattern for confirmation. This breakout can occur in either direction, depending on market conditions and the pattern's position on the chart.
In a bullish pattern, traders may enter long positions when the price closes above the upper trendline, anticipating new higher highs. Conversely, in a bearish pattern, traders may consider shorting the asset when the price closes below the lower trendline.
Traders often calculate the distance between the trendlines and take profits partially or fully when the price reaches around 60% of that distance. They may also use the closest support and resistance levels for their exit. Fibonacci levels can provide additional clues for setting target levels and identifying potential support and resistance levels within the pattern.
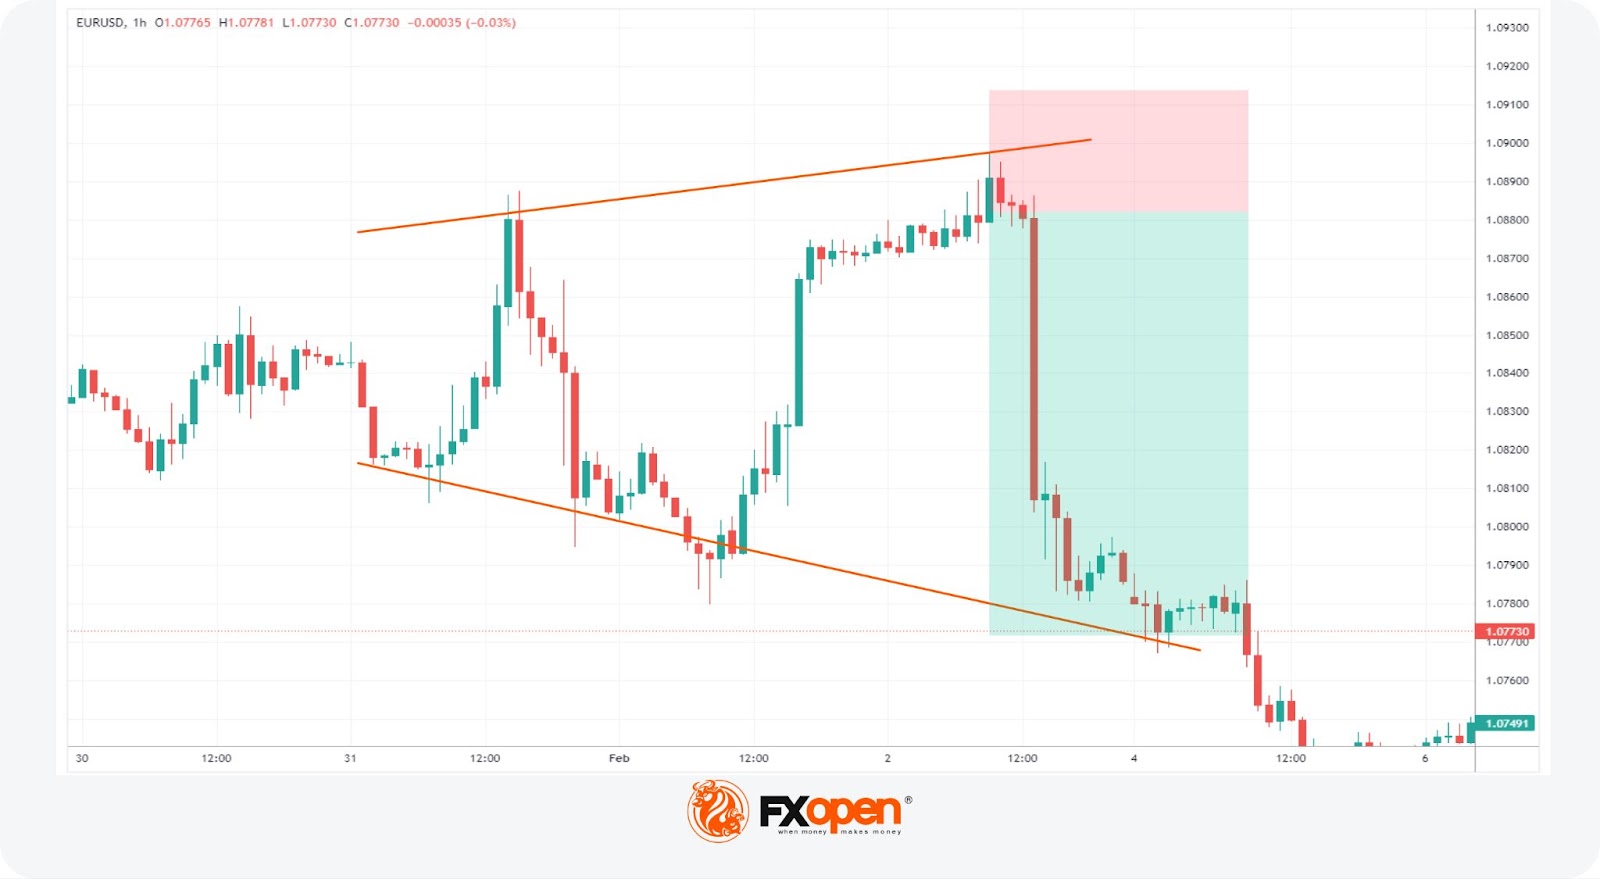
Live Market Example: 1
Let's look at a live example of swing trading within the Megaphone pattern. The trader shorts the EURUSD pair when the price reaches the top of the trendline. Their take profit is at the opposite trendline with the stop loss above the upper trendline, in accordance with the risk-reward ratio.
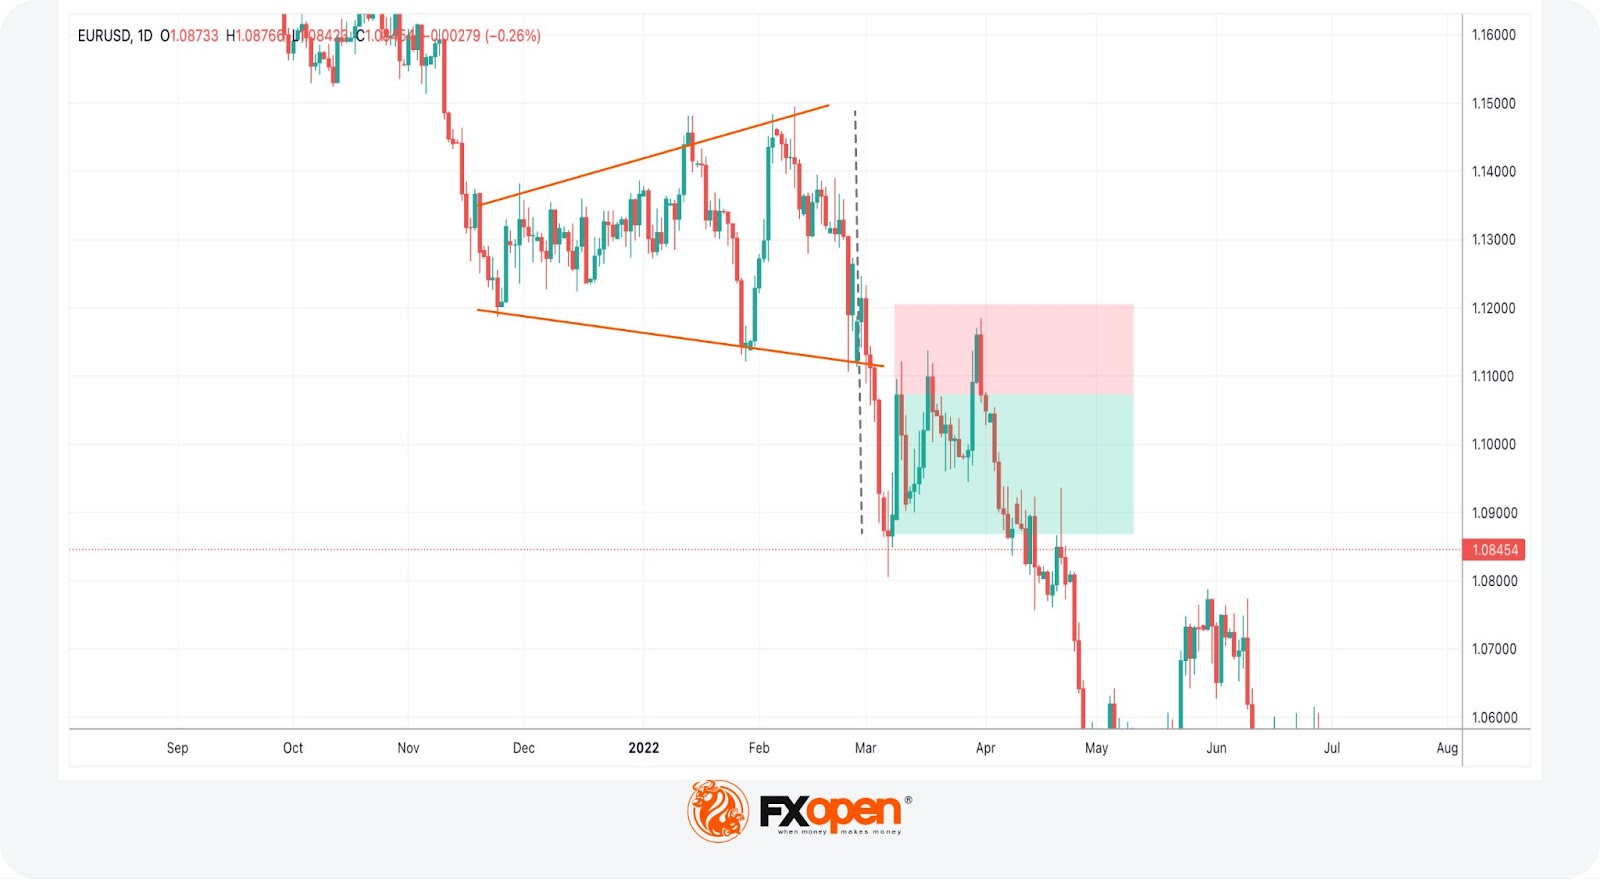
Live Market Example: 2
Let’s consider the breakout trading example with the Megaphone pattern. A trader goes short after the price breaks below the lower trendline at the close of the breakout candlestick. The take-profit target is placed at a distance equal to 60% of the Megaphone’s width. The stop-loss level is placed in accordance with the 1:2 risk/reward ratio.
Final Thoughts
By understanding how to spot and trade the Megaphone formation, traders can potentially capitalise on market reversals and widening price ranges. However, as with any technical analysis tool, it's essential to use risk management techniques and combine them with other forms of analysis for confirmation. As you get comfortable with this setup, you may open an FXOpen account to trade it on the live markets.
FAQs
Is the Megaphone Pattern Bullish or Bearish?
You can find both a bullish Megaphone pattern and a bearish Megaphone pattern depending on the market conditions. It is considered bullish when the price breaks above the upper trendline of the pattern with increasing volume, signalling an upward trend. It can be bearish when the price breaks below the lower trendline of the pattern with increasing volume, indicating a downward trend.
How Do You Trade Megaphone Patterns Intraday?
To trade Megaphone patterns intraday, traders start by identifying the formation on shorter timeframes like 15-minute or hourly charts. The theory states that traders wait for a breakout above the upper trendline or a breakdown below the lower trendline, accompanied by increased volume for confirmation. You may enter trades in the direction of the breakout or breakdown, placing stop-loss orders beyond the opposite boundary of the pattern. Take-profit targets may be based on the width of the Megaphone pattern, but traders prefer to use additional technical indicators for confirmation. You may implement risk management techniques to potentially lower risks and remain flexible in adjusting your strategy based on real-time market conditions.
What Does a Long-Term Megaphone Pattern Mean?
A long-term Megaphone typically indicates increased volatility and uncertainty in the market over an extended period. It reflects that price swings are widening, with alternating higher highs and lower lows. Traders often interpret a long-term setup as a sign of indecision among market participants, potentially leading to significant price movements in the future.
This article represents the opinion of the Companies operating under the FXOpen brand only. It is not to be construed as an offer, solicitation, or recommendation with respect to products and services provided by the Companies operating under the FXOpen brand, nor is it to be considered financial advice.
Stay ahead of the market!
Subscribe now to our mailing list and receive the latest market news and insights delivered directly to your inbox.


Latest articles

Dow Jones (DJIA): Consolidation Beyond the Trend
Federal Reserve Chair Kevin Warsh testified before Congress on 14–15 July, reaffirming the Fed's commitment to bringing inflation back to target while providing no clear guidance on the future path of interest rates. Meanwhile, June inflation data came in

European Currencies Strengthen Ahead of Key Macroeconomic Releases
EUR/USD and GBP/USD continue to recover moderately following the recent weakening of the US dollar. European currencies have been supported by expectations that US inflationary pressures will continue to ease after softer-than-expected CPI and PPI data, reinforcing market

Brent Crude Oil: From Ceasefire to Crossfire — What's Next?
Just weeks ago, traders were pricing in peace. Now they're pricing in war again—and that reversal says everything about how fragile the current Middle East calm really is.
Brent crude has surged to $86 a barrel, its highest level