


FXOpen
Understanding market volatility is essential for effective trading, and one of the most valuable tools for measuring it is standard deviation. This gauge quantifies the dispersion of asset prices around their mean and provides insights into the variability and potential risk associated with a financial instrument.
This article delves into what standard deviation is, its calculation, interpretation, practical implementation, and its limitations.
What Is Standard Deviation?
Standard deviation is a statistical measure that quantifies the dispersion or variability of a set of data points relative to their mean. In trading, it is used to assess the volatility of a financial instrument. A higher standard deviation indicates greater variability in prices, suggesting more significant swings, while a lower value suggests smaller price fluctuations.
For instance, consider two stocks: Stock A and Stock B. If Stock A’s standard deviation is 5 and Stock B’s is 15, Stock B exhibits more price variability. This means that Stock B fluctuates more widely around the mean compared to Stock A, and its volatility level is higher.
Understanding the standard deviation of a stock or other asset helps traders evaluate its associated value. Assets with high standard deviations are considered riskier as their prices are hardly analysed, whereas assets with low deviations might be seen as potentially safer.
Volatility vs Standard Deviation
While both terms are related, volatility refers to the degree of variation in an asset's price over time, whereas standard deviation quantifies this variation statistically. The former is the broader concept, encompassing the overall fluctuations, while the latter provides a precise numerical measure of these fluctuations, offering traders a clearer understanding of market behaviour and risk.
Calculating Standard Deviation
Calculating standard deviation involves a series of straightforward steps. Here's how traders can calculate it using a set of price data:
1.Gather Data: Collect the closing prices of the asset over a specified period. For example, use the closing prices for the past 10 days.
2.Calculate the Mean: Add up all the closing prices and divide by the number of prices to find the average (mean) price.
- Mean = ∑ Price /Number of Prices
3.Determine the Deviations: Subtract the mean from each closing price to find the deviation of each price from the mean.
- Deviation = Price − Mean
4.Square the Deviations: Square each deviation to ensure all values are positive.
- Squared Deviation = (Price − Mean)^2
5.Calculate the Average of Squared Deviations: Add up all the squared deviations and divide by the number of prices minus one (this adjustment, known as Bessel's correction, is used for a sample).
- Variance = (∑(Price − Mean)^2) / (Number of Prices − 1)
6.Take the Square Root: Find the square root of the variance to get the standard deviation.
- Standard Deviation = √Variance
Example Calculation
Assume we have the closing prices for a stock over 5 days: $20, $22, $21, $23, and $22.
1.Mean: (20 + 22 + 21 + 23 + 22) / 5 = 21.6
2. Deviations: −1.6, 0.4, −0.6, 1.4, 0.4
3. Squared Deviations: 2.56, 0.16, 0.36, 1.96, 0.16
4. Variance: (2.56 +0.16 +0.36 + 1.96 + 0.16) / 4 = 1.3
5. Stock’s Standard Deviation: √1.3 ≈1.14
Interpreting Standard Deviation in Trading
Standard deviation in trading offers deep insights into the statistical behaviour of asset prices, aiding traders in making informed decisions.
Volatility Analysis
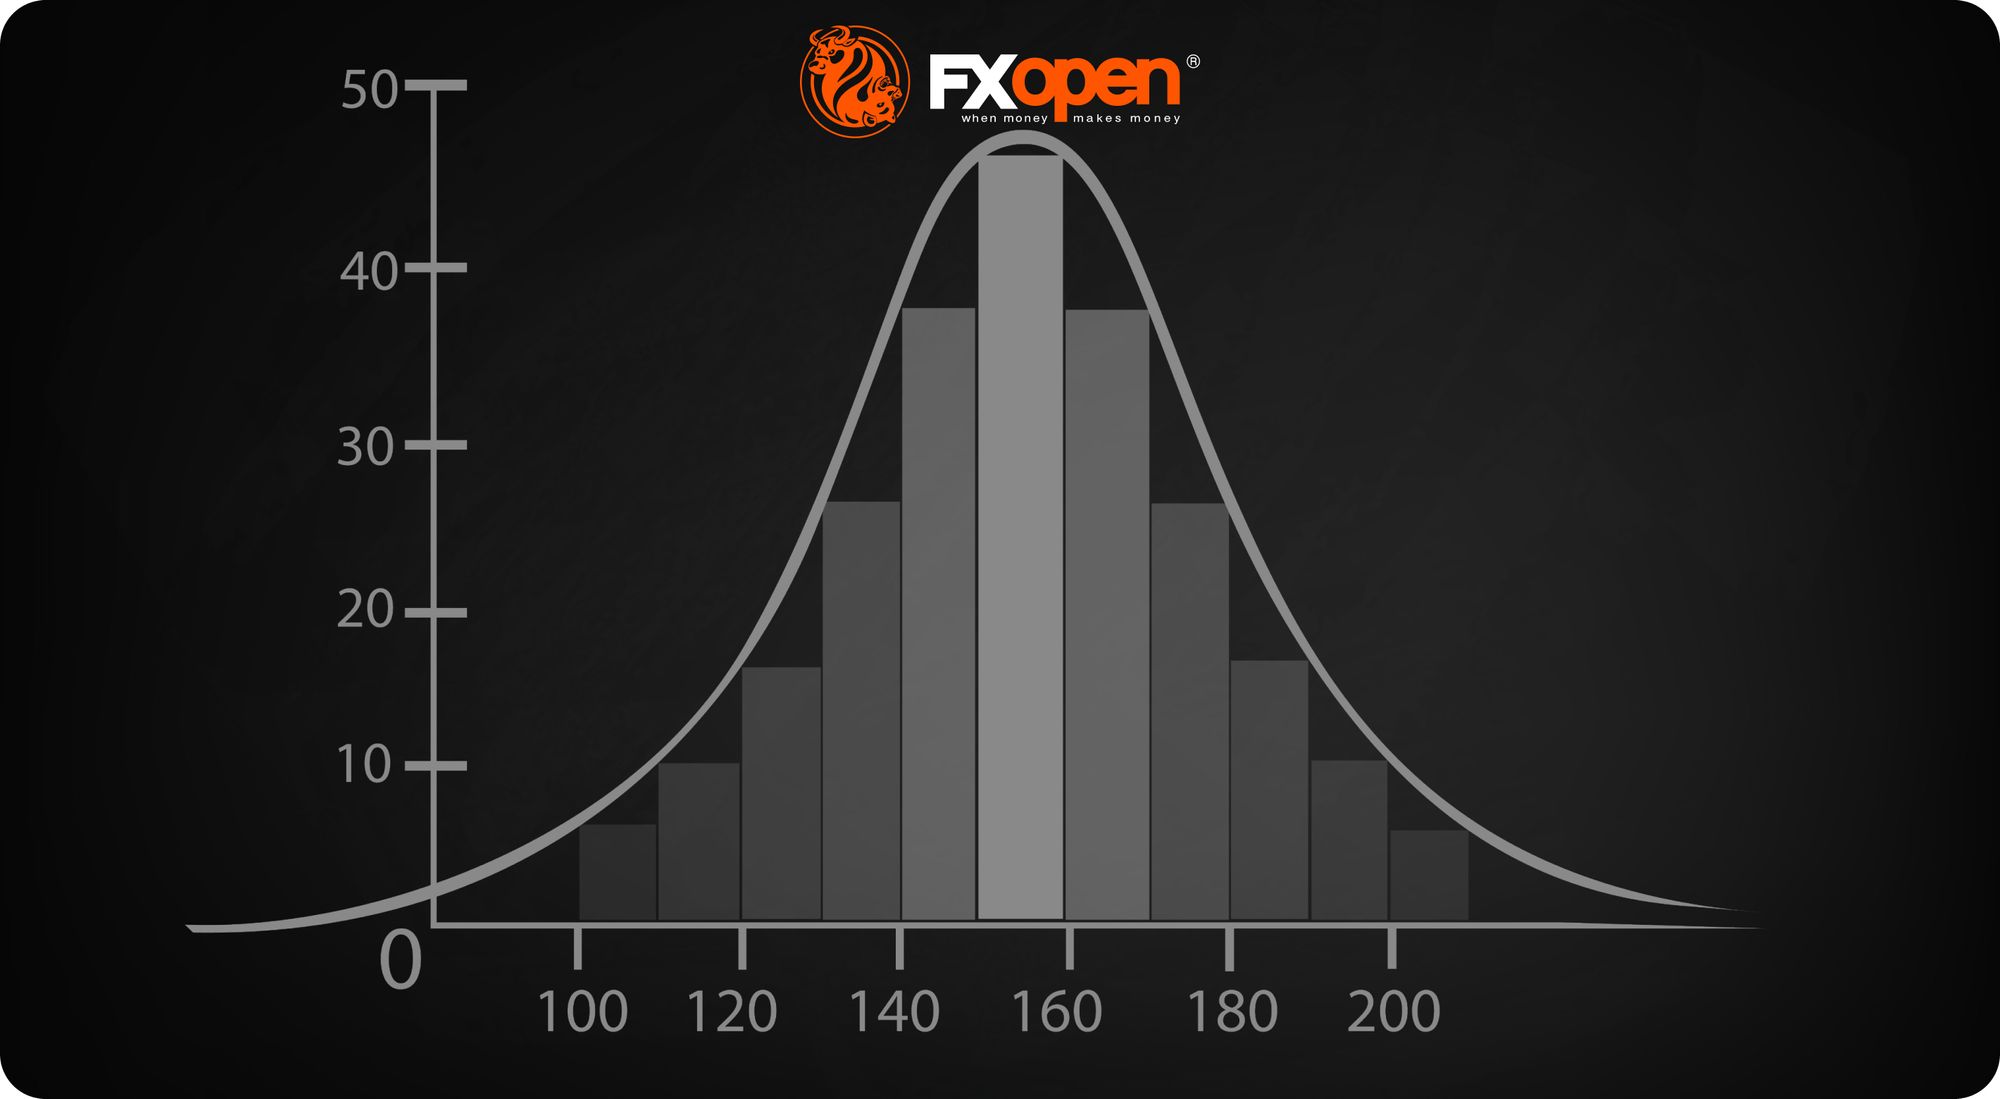
- Normal Distribution: A normal distribution, also known as a bell curve, is a common statistical pattern where most data points cluster around the mean, with fewer occurrences as you move away from the mean. Within a normal distribution, roughly 68% of data should be within one standard deviation of the mean, 95% inside of two standard deviations, and 99.7% inside of three standard deviations.
- Trading Insight: By observing this measure, traders can estimate the likelihood of movements within certain ranges. For instance, if a stock’s daily return has a mean of 0.5% and a deviation of 2%, traders can expect that around 68% of the time, the stock’s daily return will be between -1.5% and 2.5%.
Market Sentiment
- Rising: An increasing standard deviation can signal growing uncertainty or a transition period in the market. It might precede major news events, economic changes, or market corrections. Traders often watch for rising volatility as a precursor to market shifts, adjusting their positions accordingly.
- Falling: A decreasing standard deviation can indicate calming markets or consolidation phases, where prices move around a mean. This might suggest that the market is absorbing recent volatility, leading to potential trend formation. Traders may see this as a period to prepare for future directional moves.
Risk Assessment
- Portfolio Management: The measure helps in assessing the risk level of an asset or portfolio. A higher value in a portfolio suggests greater overall risk, prompting traders to diversify or adjust their holdings to manage exposure.
- Comparative Analysis: By comparing the standard deviation of different assets, traders can identify which securities align with their risk tolerance. For instance, a conservative trader might prefer assets with lower standard deviations for their smaller price fluctuations.
Performance Evaluation
- Sharpe Ratio: Standard deviation is a key component in calculating the Sharpe Ratio, which measures risk-adjusted returns. A lower figure, in conjunction with a high return, indicates better performance on a risk-adjusted basis. Traders use this to compare the efficiency of different investments.
Indicators Using Standard Deviation
Standard deviation is a fundamental tool in trading, utilised in various indicators to assess volatility and inform strategies. To explore the indicators discussed below and apply them to live charts, head over to FXOpen’s free TickTrader platform.
Standard Deviation Indicator
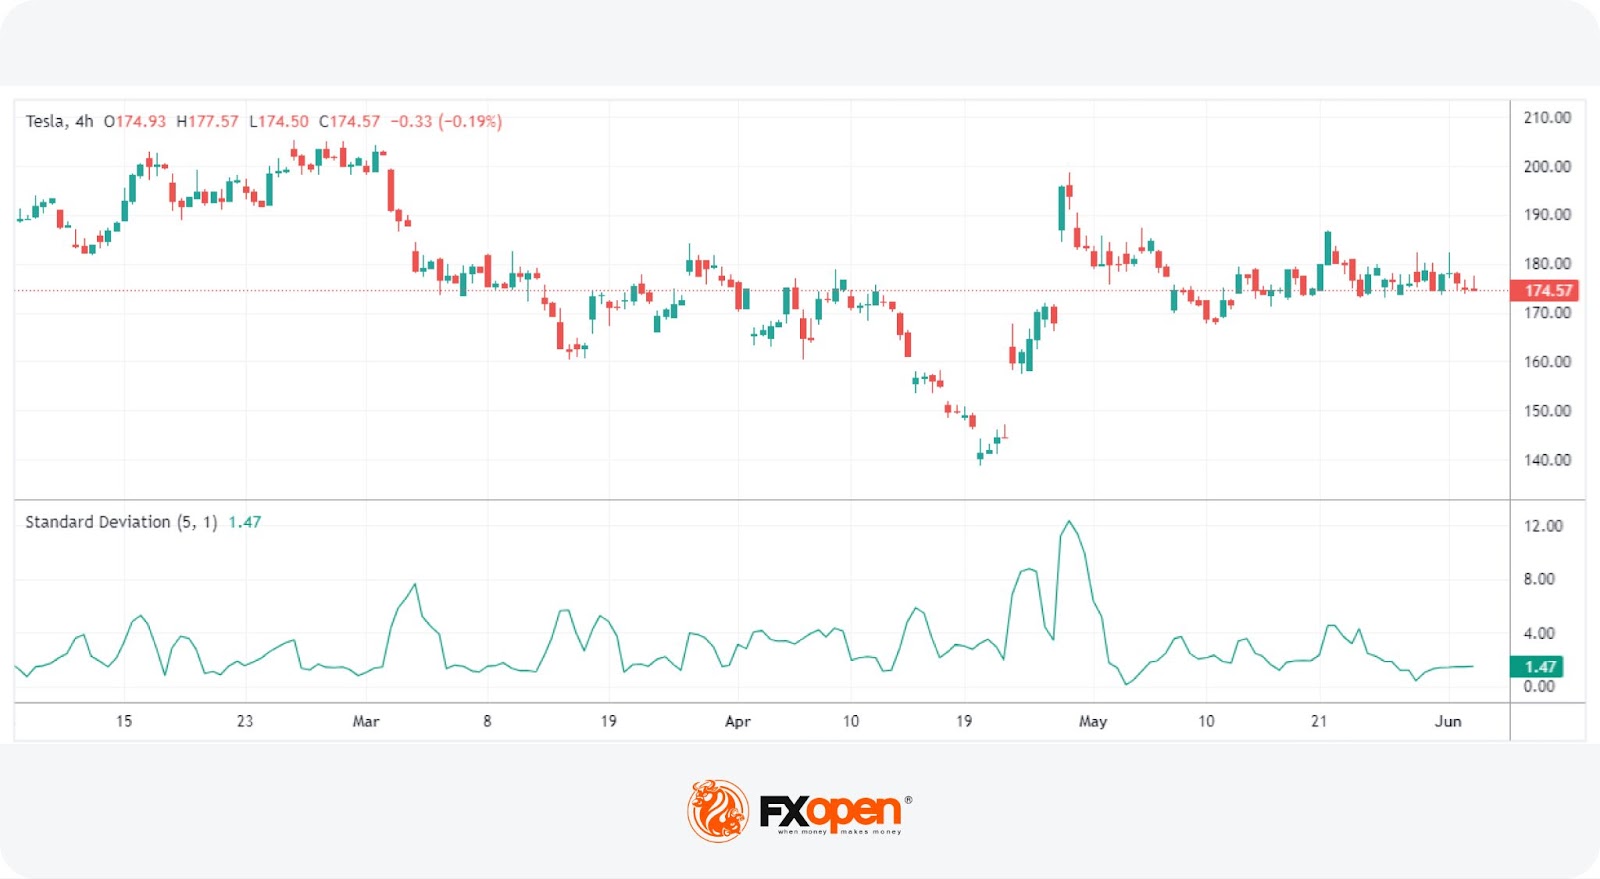
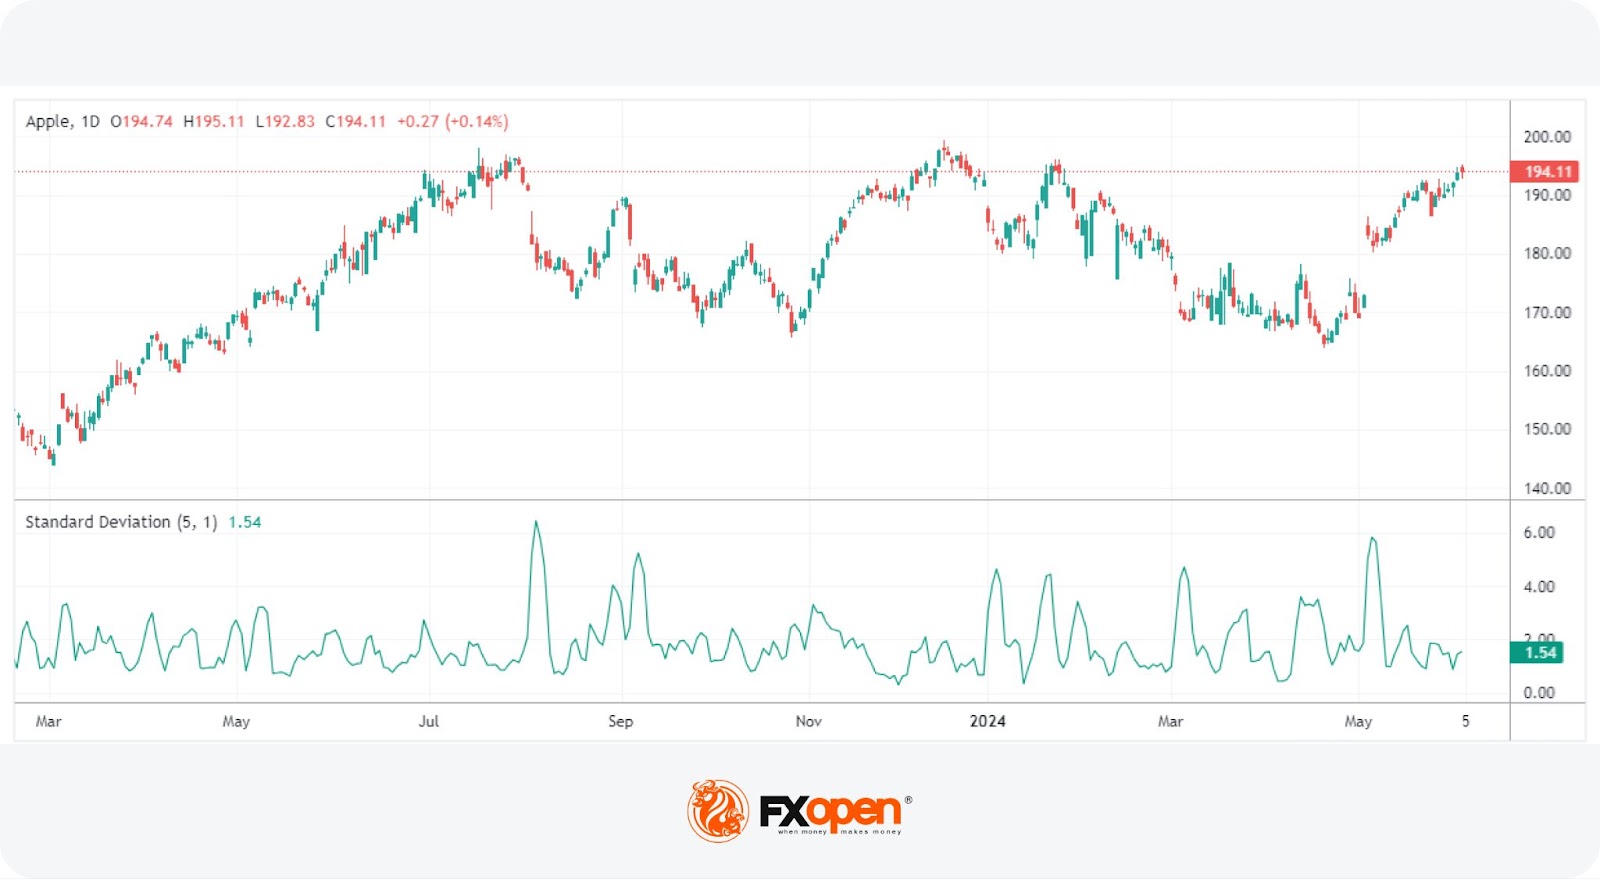
- Description: The standard deviation indicator directly displays an asset’s standard deviation on a chart. It visually represents the deviation of the asset over a specified period.
- Interpretation: When the value is high, the market is experiencing more significant swings. Conversely, a low deviation suggests a market with less fluctuation. Traders often use this indicator to gauge the current volatility and adjust their strategies accordingly.
Bollinger Bands
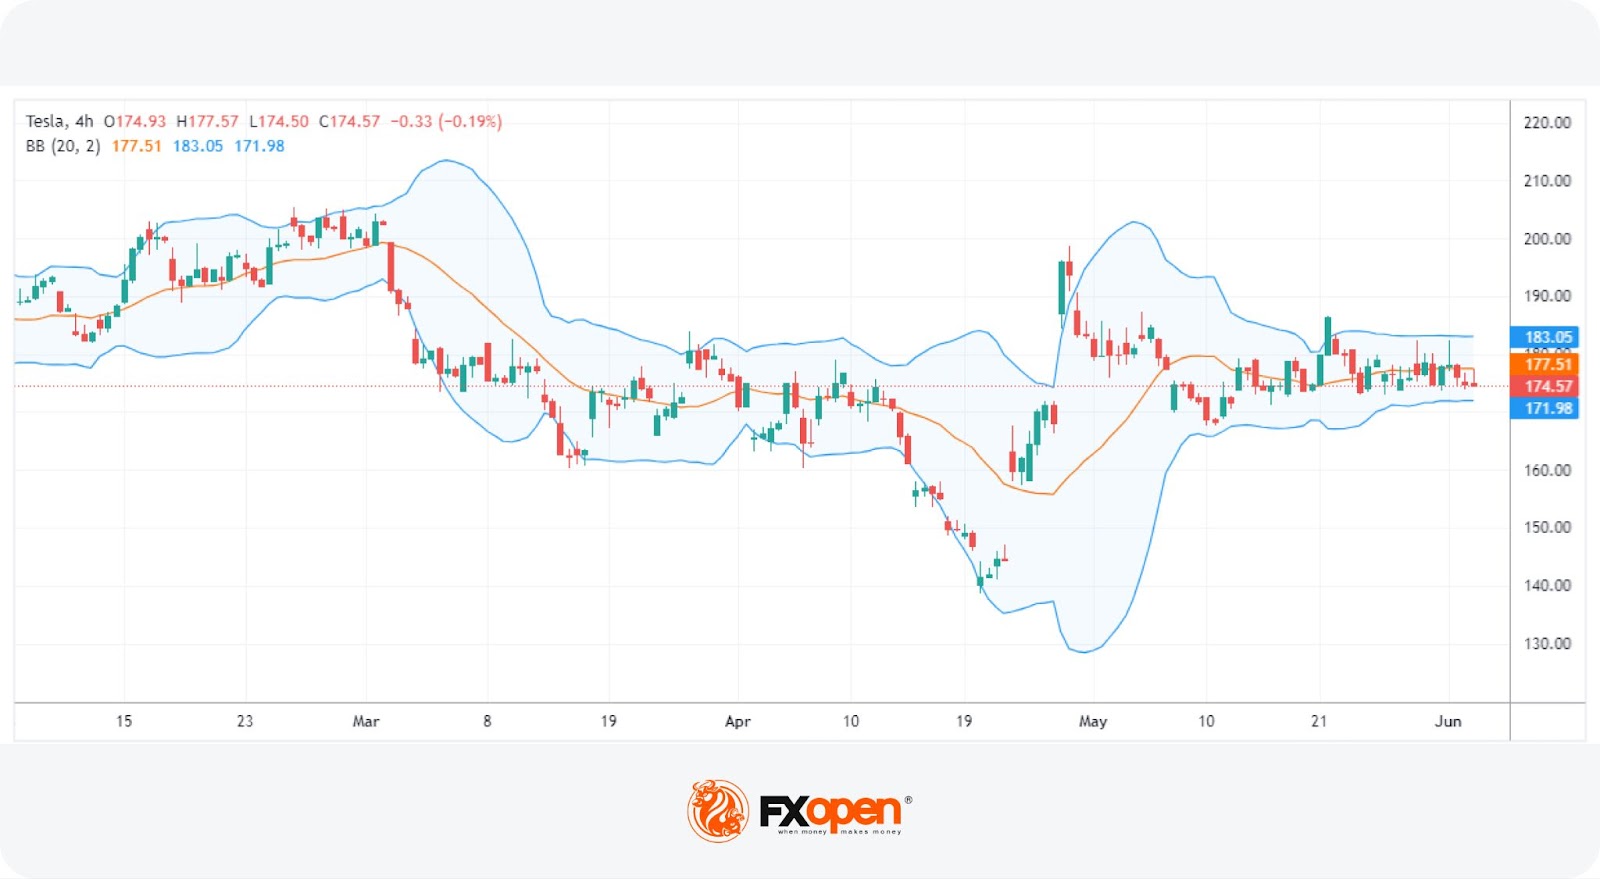
- Description: Bollinger Bands consist of three lines: a simple moving average (SMA) in the middle and two standard deviation lines (one above and one below the SMA).
- Interpretation: The width of the bands reflects volatility. When the bands widen, it indicates increased volatility, while narrowing bands suggest the opposite. Bollinger Bands are commonly used to identify overbought or oversold conditions. Prices touching the upper band may signal an overbought market, while prices touching the lower band may indicate an oversold market. Traders use this information to make decisions about potential entry or exit points.
Relative Volatility Index
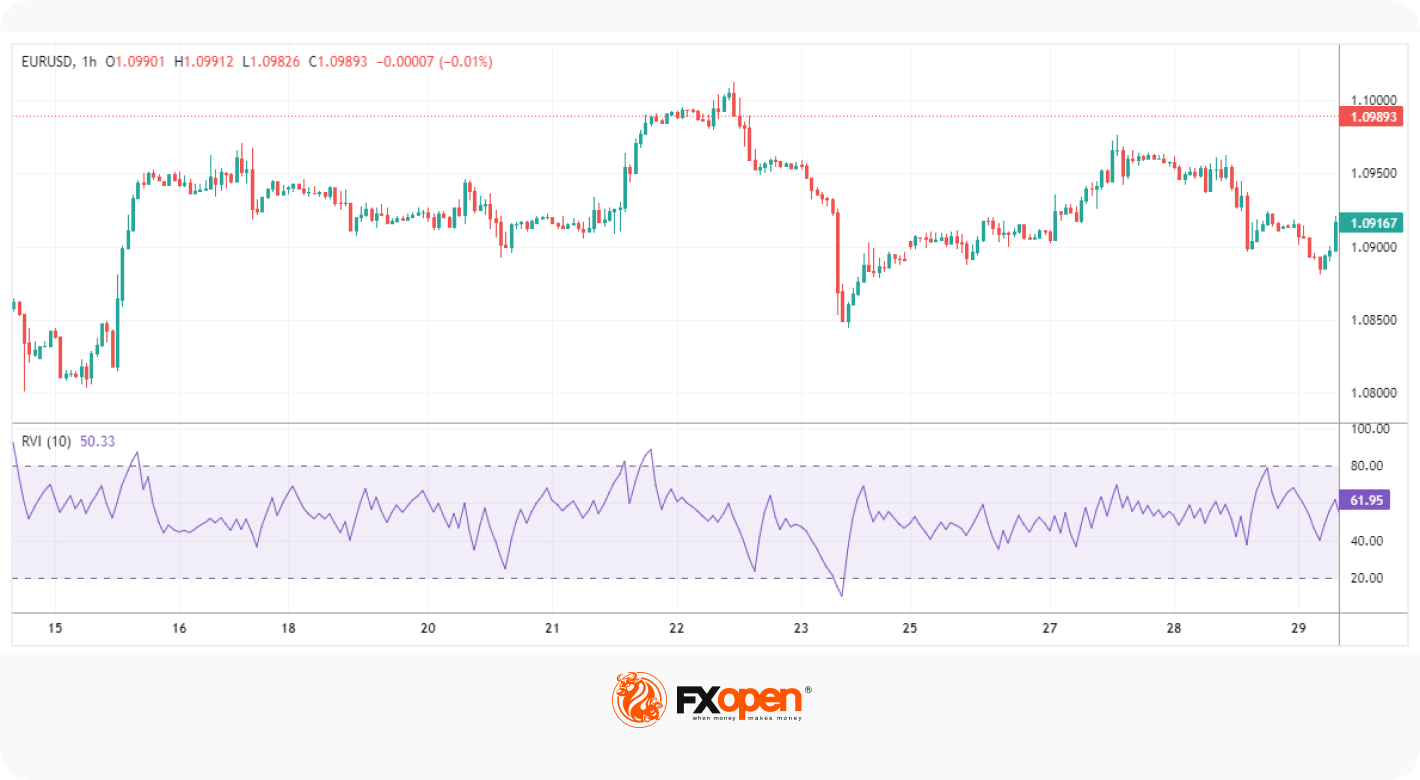
- Description: The Relative Volatility Index (RVI) uses the standard deviation of high and low prices over a specified period to measure volatility.
- Interpretation: The RVI is used to measure the volatility of a financial instrument, comparing price changes to price ranges over a specified period. It helps traders identify potential trend reversals or continuations by signalling periods of heightened or diminished market activity.
Practical Implementation of Standard Deviation in Trading
Traders utilise this statistical measure for several practical applications to enhance their trading strategies and risk management.
Risk Management
It helps in setting price targets and stop-loss levels. By understanding the typical price range, traders can place stop-loss orders beyond the expected range to avoid premature exits. For example, if the expected deviation is $2, a stop-loss might be set at $4 away from the entry level to account for typical fluctuations.
On the other hand, a trader may extend or tighten their profit target based on the market’s standard deviation. If it indicates volatility is low, they might prefer to set a target closer to the current price vs in a highly volatile market.
Evaluating Positions
When choosing or evaluating a potential position, traders might consider this measure to gauge expected volatility. A higher value signals higher potential market swings, indicating more risk. This may help in aligning trades with individual risk tolerance levels.
Identifying Extreme Price Movements
Bollinger Bands are particularly useful here. These bands are set at a distance of two or three standard deviations from a moving average. Movements outside these bands indicate extreme values. For instance, a spike beyond three standard deviations occurs only 0.03% of the time in a normal distribution, suggesting a strong signal. Traders might view a breach above the upper band as a potential selling point and a breach below the lower band as a buying opportunity.
Limitations of Standard Deviation
While standard deviation is a valuable tool in trading, it has certain limitations:
- Assumes Normal Distribution: It presumes data follows a normal distribution, which isn't always true in financial markets where extreme events can occur more frequently.
- Historical Data Dependence: It relies on historical data to define future volatility, potentially missing unforeseen market changes.
- Ignores Direction: It reflects volatility but doesn't indicate the direction of market movements, making it less useful for trend analysis.
- Sensitivity to Outliers: Extreme values can skew the measure, leading to inaccurate volatility assessments.
- Not a Standalone Tool: It should be used alongside other indicators and analysis techniques to provide a comprehensive market view.
The Bottom Line
Understanding and utilising standard deviation is vital for effective trading and risk management. By incorporating this measure, traders can better analyse volatility and make informed decisions. To apply these insights in real-world trading, open an FXOpen account and start leveraging advanced tools and strategies today.
FAQs
Is Volatility the Same as Standard Deviation?
Volatility and standard deviation are related but not identical. Volatility relates to how much variation exists in an asset’s price over a period of time. Standard deviation is a statistical measure used to quantify this volatility. Essentially, it provides a numeric value for volatility, indicating how much an asset's price deviates from its average.
How to Calculate the Volatility of a Stock?
To calculate stock volatility, traders determine the standard deviation of its returns over a specific period. They collect the daily closing prices, calculate the daily returns, and then compute the standard deviation of these returns. This gives the annualised volatility, reflecting the stock's fluctuation rate.
What Is a Good Standard Deviation for a Stock?
A "good" standard deviation depends on the trader’s risk tolerance and strategy. Lower values might suggest potentially less risk and less market fluctuation, suitable for conservative traders. Higher values indicate greater risk and potential reward, appealing to risk-tolerant traders. Generally, it’s best to seek a balance.
This article represents the opinion of the Companies operating under the FXOpen brand only. It is not to be construed as an offer, solicitation, or recommendation with respect to products and services provided by the Companies operating under the FXOpen brand, nor is it to be considered financial advice.
Stay ahead of the market!
Subscribe now to our mailing list and receive the latest market news and insights delivered directly to your inbox.


Latest articles


Market Insights with Gary Thomson: Oil, US Retail Sales & NFP in Focus
In this video, we’ll explore the key economic events and market trends, shaping the financial landscape. Get ready for insights into financial markets to help you navigate the week ahead. Let’s dive in!
In this episode of Market

Geopolitics Fuels Volatility: AUD/USD and USD/CAD Near Key Levels
Commodity-linked currencies continue to weaken amid rising geopolitical tensions, which are boosting demand for safe-haven assets and increasing volatility across both FX and commodity markets. The US dollar is gaining support from demand for liquid and defensive assets, while currencies