FXOpen
In the complex world of trading, tools that can help traders gauge the strength of price movements are invaluable. One indicator favoured for this ability is the force index, and today, we’ll be taking a closer look at how it works, how it’s calculated, and where it’s best applied.
What Is the Force Index?
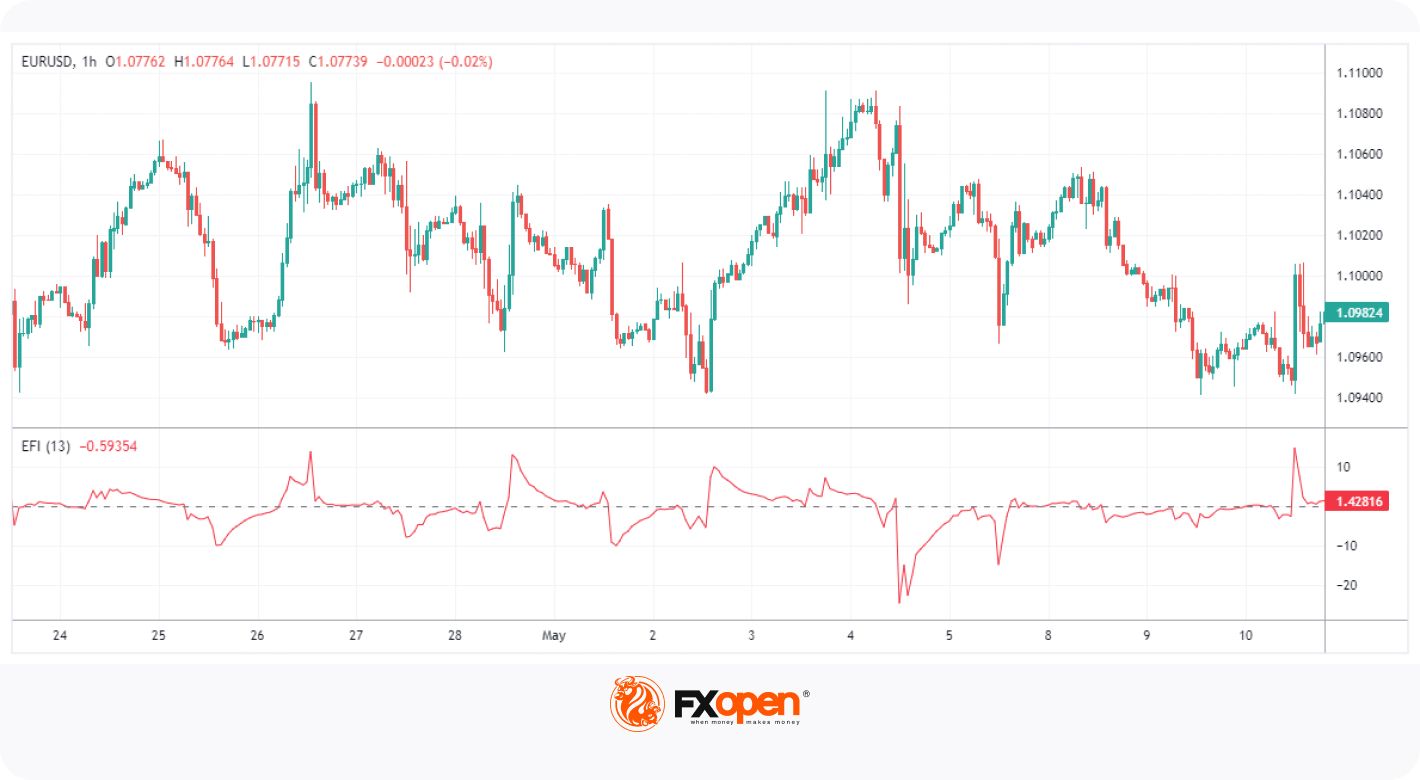
The force index indicator, sometimes called the Elder force index, is a momentum indicator created by renowned trader and author Dr Alexander Elder. It considers both price and volume to measure the direction and magnitude of a price change, oscillating around a zero line.
As the name suggests, the force indicator represents the ‘force’ of a given price movement. If you’ve ever wondered, “How do you find the force of a stock?” then the force index might be what you’re looking for. When a move is followed by a spike in the indicator, it typically suggests there is strength behind the price change.
Calculating the Force Index
To calculate the force index, three key components are needed: the current close price (CCP), the prior close price (PCP), and the current trading volume (V).
Its formula is as follows:
FI(1) = (CCP - PCP) * V
This is the calculation for a single-period force index. The resulting value reflects a price change from one period to the next and the volume of the current period.
The force index is often smoothed using a 13-period exponential moving average (EMA) to reduce fluctuations. This secondary calculation is as follows:
FI(13) = 13-Period EMA of FI(1)
The EMA produces a smoother plot, making it easier to identify extreme force without the noise of a 1-period index.
The resulting value moves above and below the midpoint (zero-line). Positive values reflect bullish activity, while negative values indicate bearishness. High readings in either direction suggest strong buying or selling pressure, supported by large price changes and significant volume. Sizeable price movements with a lacklustre movement in the indicator can mean that it lacks conviction and may not be a true breakout or trend continuation.
It’s also worth noting that the force index is unbounded, meaning it can theoretically rise infinitely. This contrasts with other momentum oscillators, such as the relative strength index (RSI). As a result, traders need to assess the indicator relative to its prior values, making its signals somewhat subjective.
How to Use the Force Index Indicator
The force index is a versatile trading tool capable of complementing any trader’s strategy. Its application can be divided into four categories: trend following, divergences, breakouts, and early entry/exit signals.
If you’d like to see how it works, hop on to FXOpen’s free TickTrader platform. You’ll find the force index and dozens of other handy trading tools there.
Using the Force Index in a Trend-Following Strategy
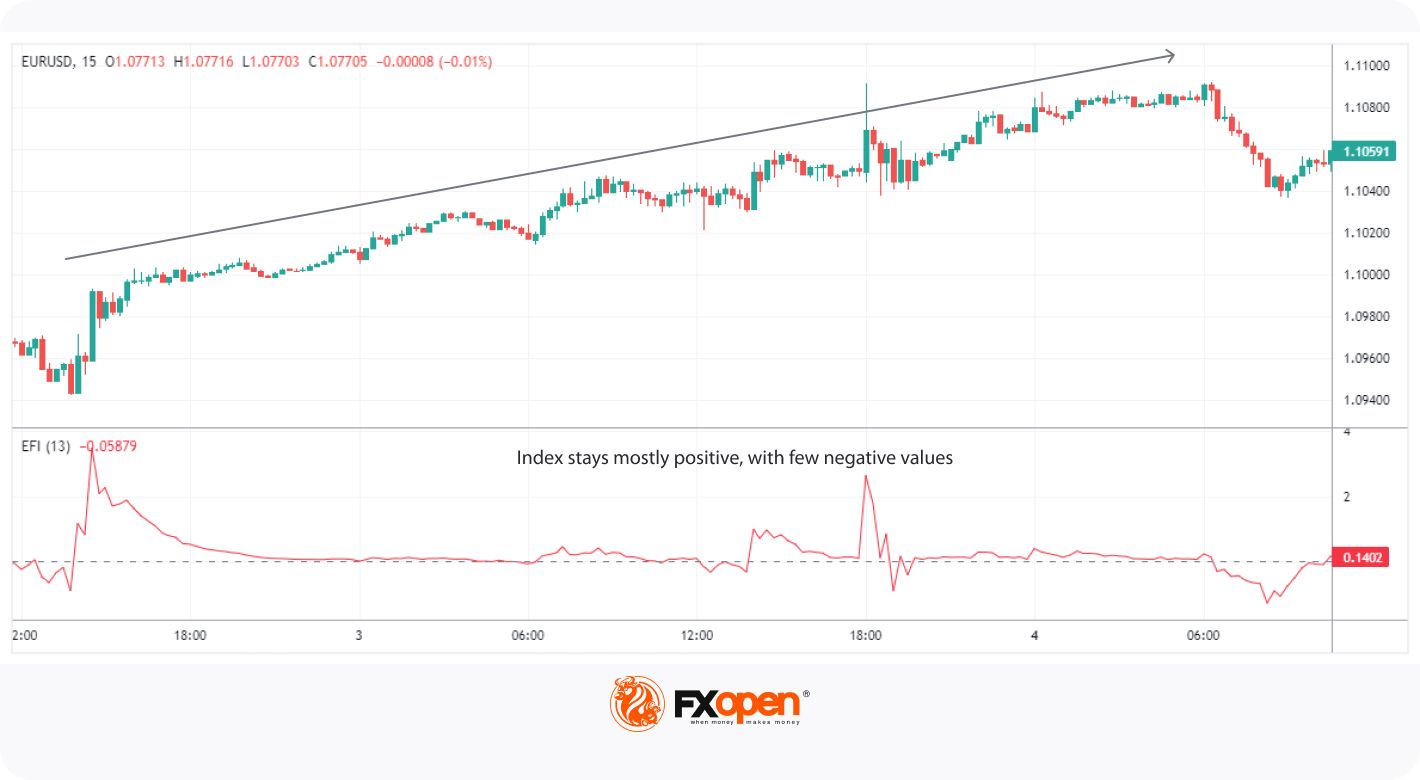
A popular use of the force index is in a trend-following strategy. Here, traders use the indicator to identify the continuation of a trend.
The index’s value helps confirm the direction of a trend. For example, let's say you identify an existing bullish trend denoted by higher highs and higher lows. If the trend is supported by consistent positive values – indicating both large price changes and high volume - then you can be confident that the trend will continue. This is especially true if moves below 0 are brief and relatively small.
However, pairing the force index with other technical analysis tools, like chart patterns or a leading indicator, is crucial to confirm a trend-following entry. Given its lagging nature, it can be easy to jump on a trend too late or get confused by its choppiness.
Using the Force Index to Spot Divergences
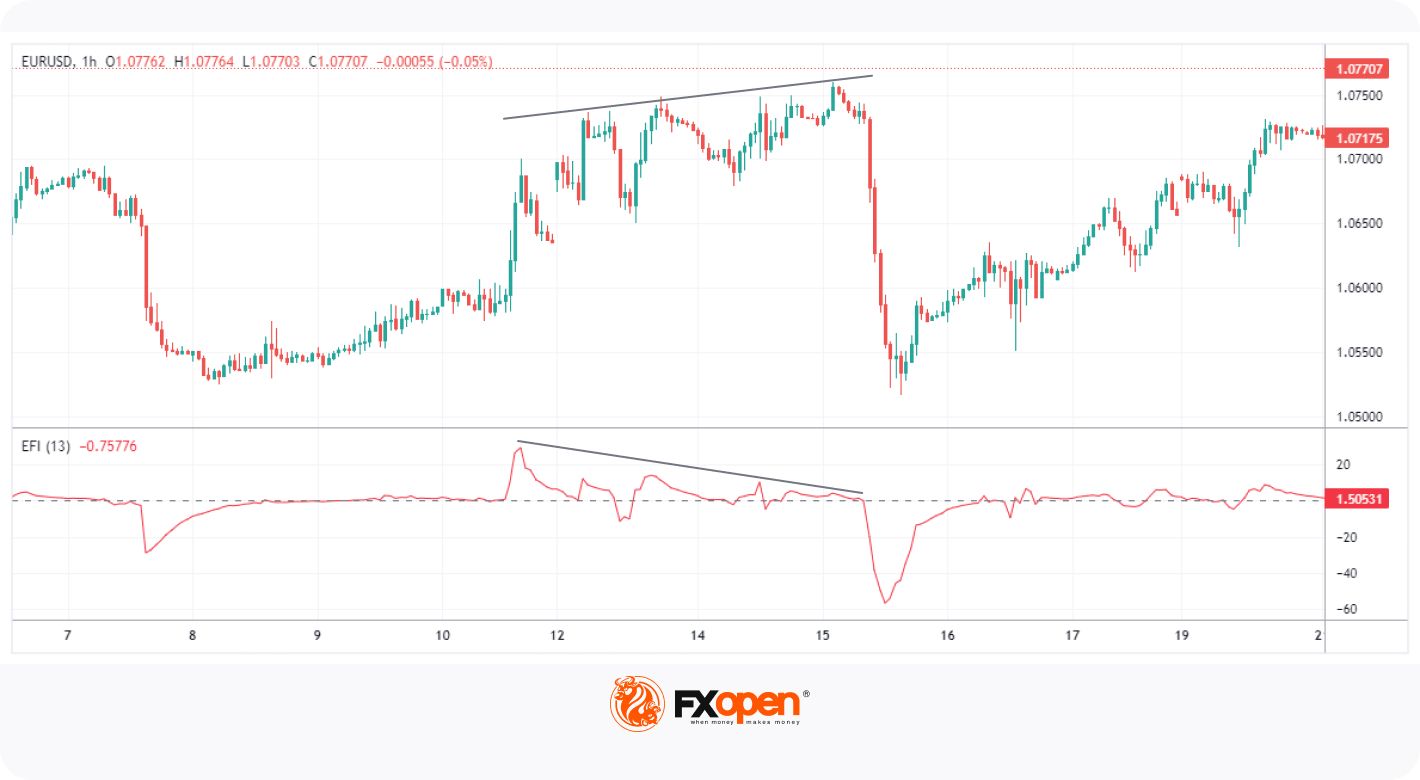
Another useful application of the force index is in divergence trading. A divergence occurs when the price of an asset moves in the opposite direction of a technical indicator and can signal a potential market reversal.
For instance, if an asset’s price creates higher highs while the force index is making lower highs, this is known as a bearish divergence. A bullish divergence is seen when the price makes lower lows, and the tool forms higher lows. Both signal that the current trend is losing momentum and may be due to reverse.
These divergences have a better chance of working when they occur at significant support/resistance levels or are confirmed with other tools.
Using the Force Index to Confirm Breakouts
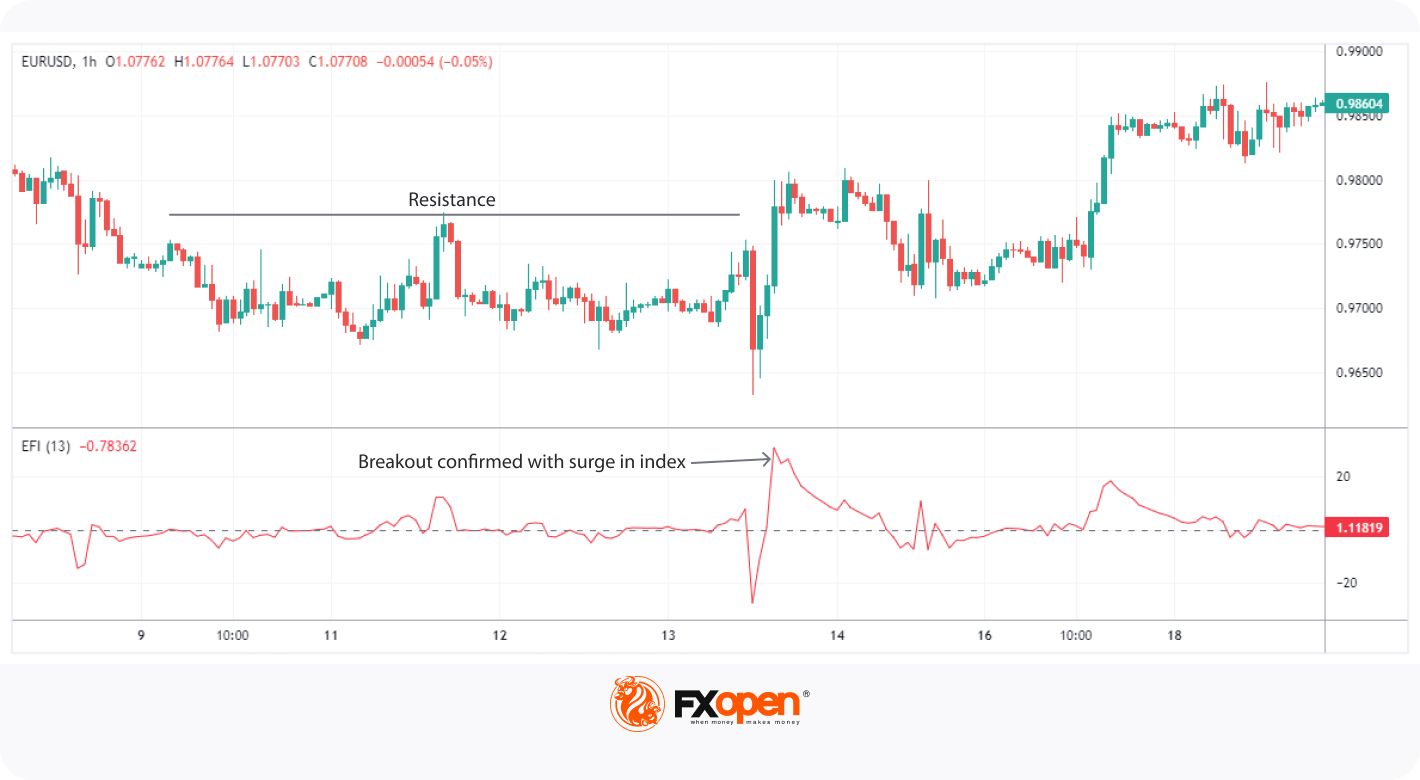
The force index can make an excellent addition to a breakout trading strategy. Here, a “breakout” refers to a sustained move above a resistance level or below a support level, typically following a range.
One thing breakout traders look for is for the break to occur on high volume. This makes the force index a potent tool for breakout trading. A strong reading in the direction of the breakout can be taken as confirmation. For instance, the price moving above a resistance level, accompanied by the indicator surging into positive values, can confirm a bullish breakout.
As discussed, interpreting the force index is subjective. To get around this, you can look for the breakout reading to exceed its highest or lowest value during the range. This way, you’ll know if there’s truly something notable about the potential breakout.
Finding Early Entry and Exit Signals

Finally, the force index may also provide early entry and exit signals. This can be useful in a well-rounded strategy where you want confirmation to get in or out of a trade.
When the indicator crosses above zero, it can be an early signal to enter a long position or close a short position, as it might indicate that buying pressure is starting to increase. The opposite can be true when it crosses below zero.
It’s not uncommon for the indicator to whipsaw above and below zero, so some traders may prefer to set specific boundaries. For example, they may enter a short position only if the Force indicator value falls below 0.5.
The Bottom Line
In summary, the force index is a valuable tool for traders looking to confirm price movements. It provides significant insights into the market’s direction and strength, from trends and divergences to breakouts. Ready to apply your force index trading strategy? You can open an FXOpen account to gain access to over 600+ markets and benefit from a partnership with Traders Union’s Most Innovative Broker of 2022. Happy trading!
This article represents the opinion of the Companies operating under the FXOpen brand only. It is not to be construed as an offer, solicitation, or recommendation with respect to products and services provided by the Companies operating under the FXOpen brand, nor is it to be considered financial advice.
Stay ahead of the market!
Subscribe now to our mailing list and receive the latest market news and insights delivered directly to your inbox.


