


A Guide to Trading Ascending and Descending Triangles
FXOpen

Belonging to classic technical analysis patterns, ascending and descending triangles are great patterns to use on the currency market. They have many advantages, such as being visible and easy to spot and interpret.
What is a Triangle in Forex?
Before presenting a short guide to trading such triangles, it is essential to understand what a triangle is. Shortly, it is a consolidation, as the currency market spends a lot of time in consolidation.
In fact, if there is one pattern to expect when the markets are likely to consolidate, expect a triangle to form. Triangles, therefore, are the favorite way for the currency market to consume time.
Many types of triangles exist. From contracting to expanding and horizontal to running variations, technical analysis is full of them, each having a different interpretation. For ascending or descending triangles, we talk about contracting triangles that form against horizontal support or resistance.
How to Trade Ascending and Descending Triangles
Ascending and descending triangles are continuation patterns. It means that during a bullish trend, the market pauses for a while, looking for direction.
The first sign that a continuation triangle forms is that the price action is capped at a horizontal level that acts as a resistance. Furthermore, the market forms a series of higher lows until the horizontal base is literally broken.
In the case of a descending triangle, the market does precisely the opposite.
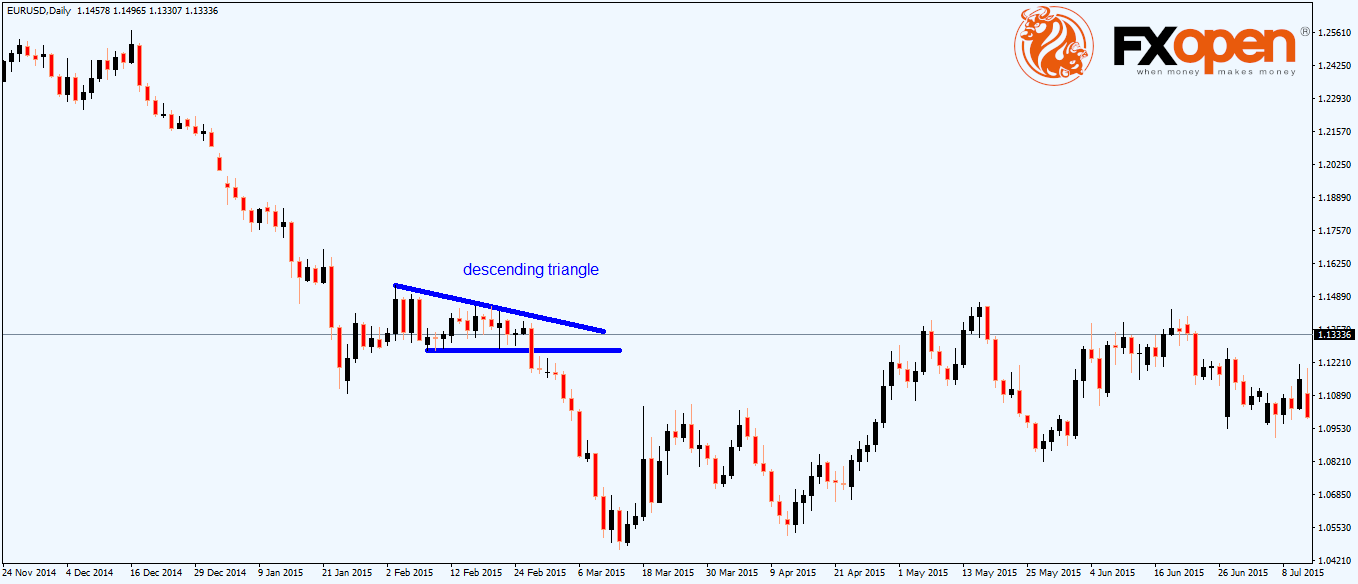
The EURUSD daily chart from above formed a descending triangle on its move lower to almost hitting the parity level. It took some time for the market to consolidate around a horizontal base, but eventually, it broke lower.
The moment the horizontal base is broken, traders go short (in the case of a descending triangle) or long (in the case of an ascending triangle), as the trend resumes. During a triangle of this type, the longest leg of the triangle gives the measured move, but a better way to trade it is to trail the stop as the trend resumes, to make the most of the continuation pattern.

As the image above shows, the descending triangle acted as a continuation pattern, with the trigger being the moment when the price broke the horizontal support. It is mandatory that a bearish trend exists, highlighting the continuation pattern and providing the direction after the triangle breaks.
Another way to make the most of such triangles is to label them using the Elliott Wave Theory rules. According to Elliott, a triangle has five segments labeled with letters and the b-d trendline’s break marks the end of the triangular consolidation. Once broken, the trend resumes.
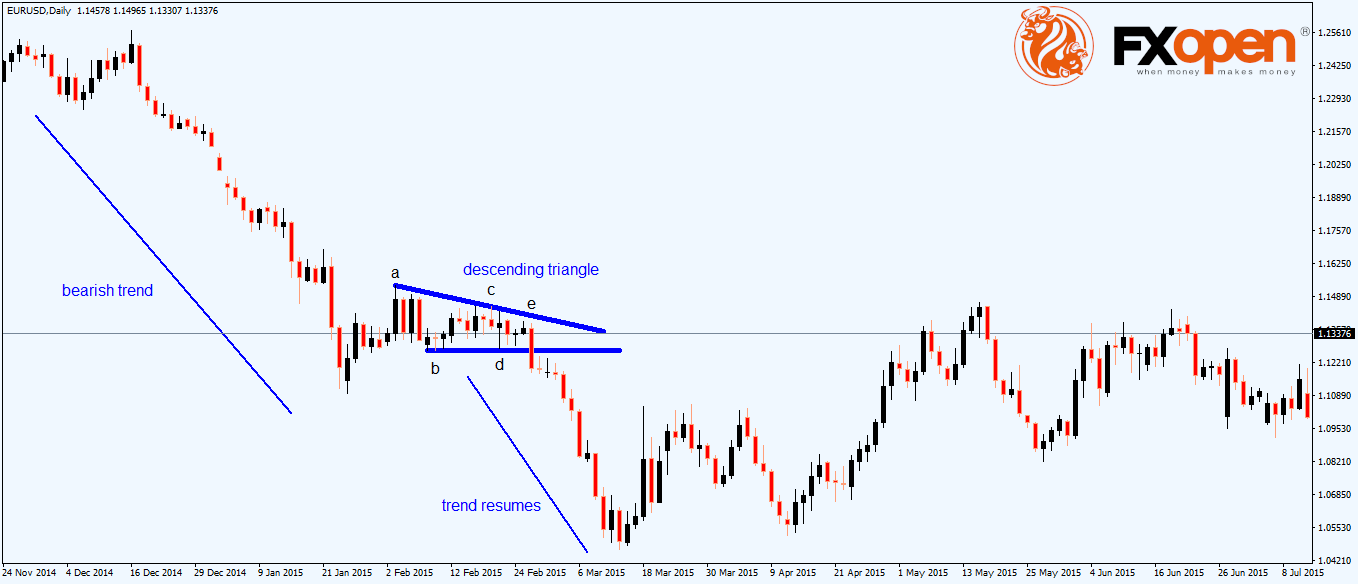
A great place to enter the market is to wait for the price to retest the b-d trendline, as it is typically rejected. The stop-loss must be at the end of the e-wave, and traders using proper risk-reward ratios multiply the risk two or three times to set the appropriate reward.
Conclusion
Ascending and descending triangles form often. Usually, the market seems to form a triple top or bottom, suggesting a reversal pattern. But if the price action keeps the series of higher lows (in an ascending triangle) or lower highs (in a descending triangle), the triple top or bottom will not hold, and the reversal pattern will be invalidated.
This article represents the opinion of the Companies operating under the FXOpen brand only. It is not to be construed as an offer, solicitation, or recommendation with respect to products and services provided by the Companies operating under the FXOpen brand, nor is it to be considered financial advice.
Stay ahead of the market!
Subscribe now to our mailing list and receive the latest market news and insights delivered directly to your inbox.

Latest articles

US Dollar Strengthens Amid Equity Market Weakness and Hawkish Fed Rhetoric
The US dollar continues to hold firm near multi-year highs as sentiment across equity markets deteriorates and investors increasingly expect the Federal Reserve to maintain a restrictive monetary policy stance for longer. The US economy remains resilient, while inflation risks

Bitcoin: Corrective Channel Broken as Traders Turn More Active
Bitcoin has come under the influence of several factors simultaneously. The wave of selling at the beginning of June was linked to Strategy's first disclosed Bitcoin sale in several years, a prolonged series of outflows from spot ETFs, and a

DAX 40: consolidation amid technology sell-off
A wave of selling in the technology sector that emerged earlier this week has weighed on European equities. The trigger was investor concern over the profitability of large-scale debt-funded investments by major US tech companies in AI infrastructure. The Nasdaq