


FXOpen

The Relative Strength Index (RSI) is a cornerstone in the world of technical analysis, assisting traders in capitalising on momentum-based opportunities. This article delves into three sophisticated RSI strategies, shedding light on how to deploy the indicator in different trading scenarios.
RSI in Trading Explained
The Relative Strength Index is a momentum oscillator that measures the velocity and change of price movements. Developed by J. Welles Wilder in 1978, the RSI oscillates between zero and 100. Typically, and by default, it is set at a 14-period time frame, meaning it computes momentum based on the last 14 price bars, whether they're days, hours, or minutes, depending on the chart.
The RSI is primarily used to identify overbought or oversold conditions. An RSI value above 70 suggests that an asset may be overbought, indicating a potential sell signal. Conversely, an RSI value below 30 signifies an oversold condition, suggesting a possible buying opportunity.
Moreover, sustained moves above the 50 mark indicate bullishness, while the index being below 50 is typically bearish. While many traders use these basic thresholds, the RSI is versatile and can be combined with other indicators and strategies for more comprehensive trading setups.
To get started with the RSI and the strategies in this article, head over to FXOpen’s free TickTrader platform. There, you’ll find each of the tools discussed waiting for you.
Best RSI Indicator Settings
The default setting for the RSI is a 14-period calculation, which works well for capturing short-to-medium-term price movements. However, traders can adjust this to suit their trading style. For those looking for more frequent trading opportunities, a shorter period like 7 or 9 can be used to generate quicker signals.
Conversely, for swing traders or investors interested in longer-term trends, a setting of 21 or even 28 periods could be more appropriate. It's important to note that shortening the RSI period will make it more sensitive, increasing the frequency of signals, while lengthening it will smooth out the data and produce fewer but potentially more reliable signals.
RSI With Hull Moving Average Confirmation
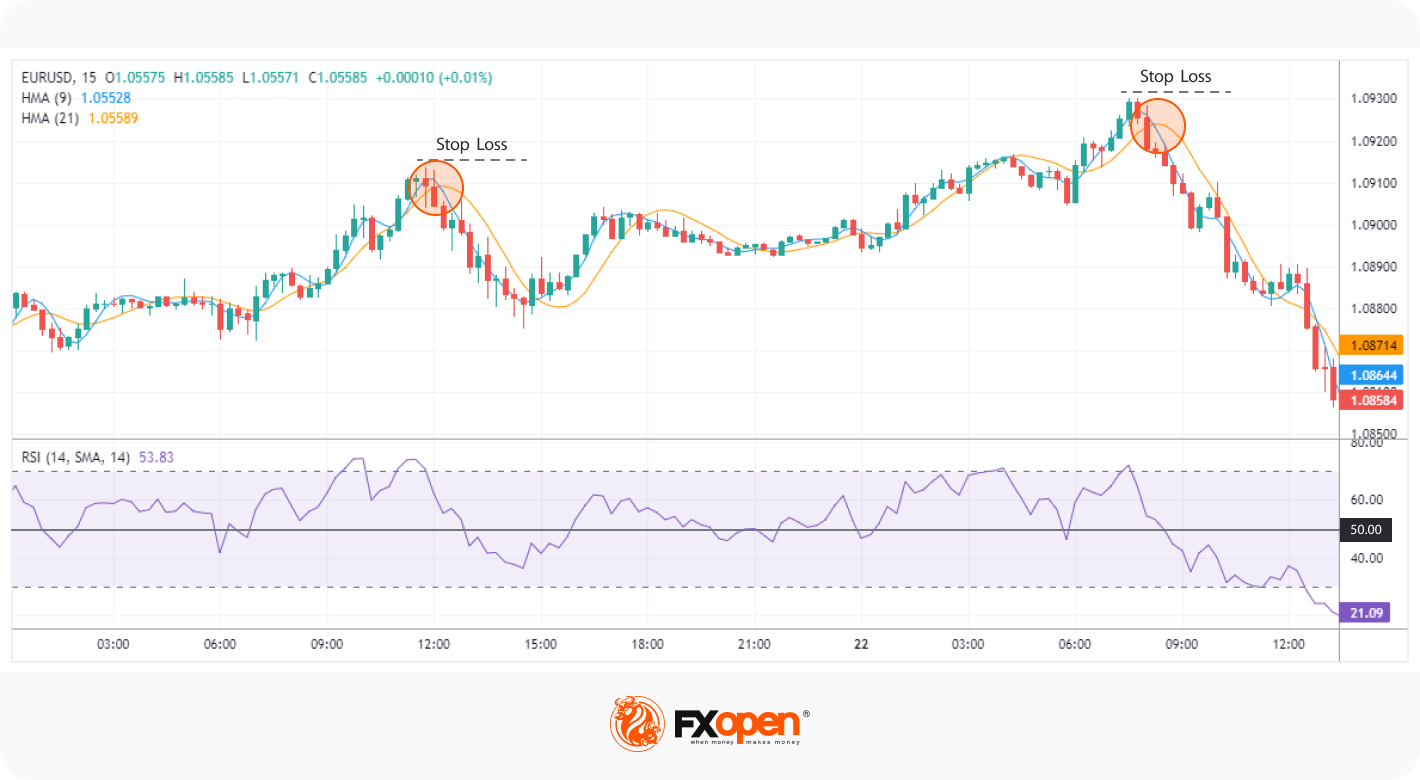
Incorporating Hull Moving Averages (HMA) into an RSI-based strategy offers traders an additional layer of confirmation for entry and exit points. In this approach, traders can use both a 9-period and a 21-period HMA alongside an RSI that has crossed below the 70 level for a bearish scenario or above the 30 level for a bullish scenario.
Entry
- Traders can look for a 9-period HMA and 21-period HMA crossover within a few bars of the RSI crossing the designated overbought or oversold level. When an HMA with a shorter period crosses above the HMA with a longer period, it’s usually considered a buy signal and vice versa.
Stop Loss
- Stop losses may be positioned above or below a nearby swing point. This provides a buffer against sudden market reversals while keeping risk manageable.
Take Profit
- Profits are typically taken at an identified support or resistance level.
- Another option is to exit when the RSI crosses into the opposite extreme zone (from overbought to oversold or vice versa).
- A subsequent HMA crossover against the trade direction can also serve as a signal for profit-taking.
The advantage of using Hull Moving Averages for confirmation is their responsiveness to price changes without the noise often associated with other types of moving averages. This strategy aims to capitalise on more robust signals by combining the trend-following characteristics of HMA with the momentum signals of the RSI.
Stochastic and RSI Indicator Strategy
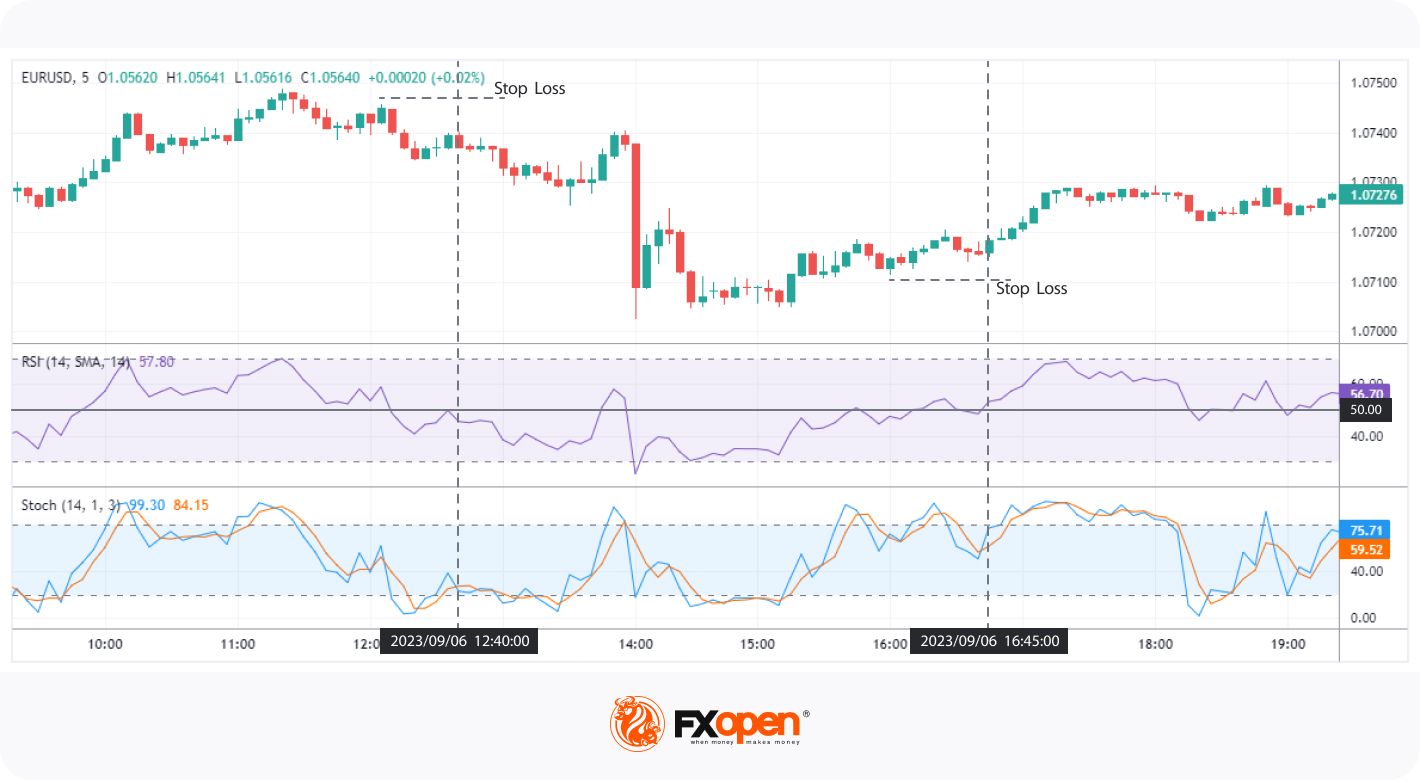
In this RSI trading strategy, the focus is on combining the RSI with the Stochastic Oscillator for enhanced market insight. Both are momentum indicators, but they evaluate different aspects of price action, making them complementary when used together.
Entry
- Traders can consider entering a trade when the RSI is above 50 for a bullish scenario or below 50 for a bearish one.
- The entry signal may be further confirmed when the Stochastic Oscillator's %K crosses the %D line in the same direction as the RSI reading but below 80 and above 20.
Stop Loss
- Stop losses can commonly be placed above/below a nearby swing point.
Take Profit
- Taking profits may occur at a clearly defined support or resistance level.
The value of this strategy comes from the synergistic effects of combining RSI and Stochastic Oscillators. While the RSI measures the speed and change of price movements, the Stochastic helps to validate or negate the RSI's signal by considering where the current price is relative to its range over a particular period. This dual-layer approach aims to minimise false signals and improve the probability of a successful trade.
RSI Pullback Strategy
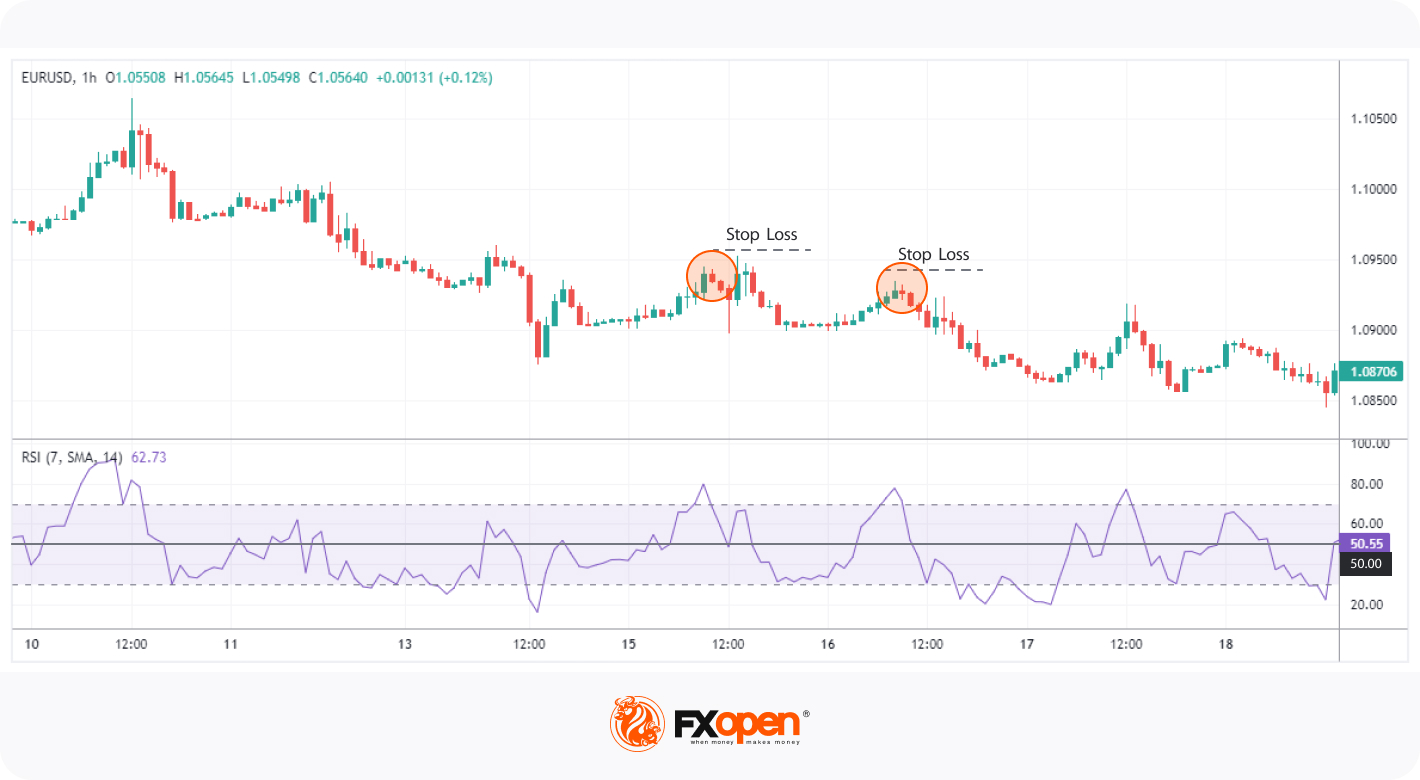
In a clear trending market, identified by a series of higher highs and higher lows for an uptrend or lower highs and lower lows for a downtrend, traders can employ a 7-period RSI for an RSI Pullback Strategy. Ideal when using the RSI for day trading, this strategy focuses on exploiting price retracements, offering an optimised entry point in an already established trend.
Entry
- During a pullback in price, traders look for the RSI to enter overbought or oversold territories.
- An entry signal may be considered when the RSI crosses back above 30 during an oversold condition or below 70 during an overbought condition.
Stop Loss
- Similar to other strategies, stop losses are generally placed near a recent swing point for reasonable risk management.
Take Profit
- Profits can typically be taken at an identified support or resistance level.
- Alternatively, traders may opt to close the trade at the most recent high or when the RSI crosses into the opposing area (from overbought to oversold or vice versa).
The use of a 7-period RSI allows for a more responsive reaction to price changes, making it suitable for capturing short-term pullbacks. By entering when the RSI reverses from extreme levels, traders aim to rejoin the prevailing trend at a more favourable price.
The Bottom Line
Exploring advanced RSI strategies can be a game-changer for traders aiming to capitalise on market momentum. The strategies here offer a more comprehensive approach than merely adhering to traditional overbought or oversold conditions. To put them into practice, modify them so they suit your trading approach, and experience them in a real trading environment, consider opening an FXOpen account, where you'll find all the tools and platforms necessary to take your trading to the next level. Good luck!
This article represents the opinion of the Companies operating under the FXOpen brand only. It is not to be construed as an offer, solicitation, or recommendation with respect to products and services provided by the Companies operating under the FXOpen brand, nor is it to be considered financial advice.
Stay ahead of the market!
Subscribe now to our mailing list and receive the latest market news and insights delivered directly to your inbox.


Latest articles

Netflix (NFLX) Shares Pull Back After a 30% Surge
On 21 January, while analysing the NFLX chart, we:
→ identified a descending channel and a resistance zone around the $100 level;
→ noted that Netflix shares were showing a sustained downtrend. Selling pressure had been triggered primarily by reports of a

US Dollar Index (DXY) Rises Above the 100 Level
Today the US Dollar Index (DXY) climbed above the psychological 100 mark for the first time in 2026, supported by a tense fundamental backdrop, with the military conflict in the Middle East acting as the main driver.
→ Financial market participants

USD/JPY and USD/CAD Continue to Rise Ahead of Key Data Releases
The US dollar continues to strengthen against major counterparts as markets await important macroeconomic data scheduled for release in the coming hours. Investors are focusing on US GDP figures, the Personal Consumption Expenditures (PCE) price index, and Canada’s labour