


FXOpen
Trading indicators and technical analysis are essential components of the financial markets, utilised by traders and investors to analyse price movements, identify trends, and make informed trading decisions. The moving average is an indicator that is used by many traders. This article will cover the best moving averages for day trading, swing trading, and scalping and discuss the crossover strategies.
Understanding Moving Averages
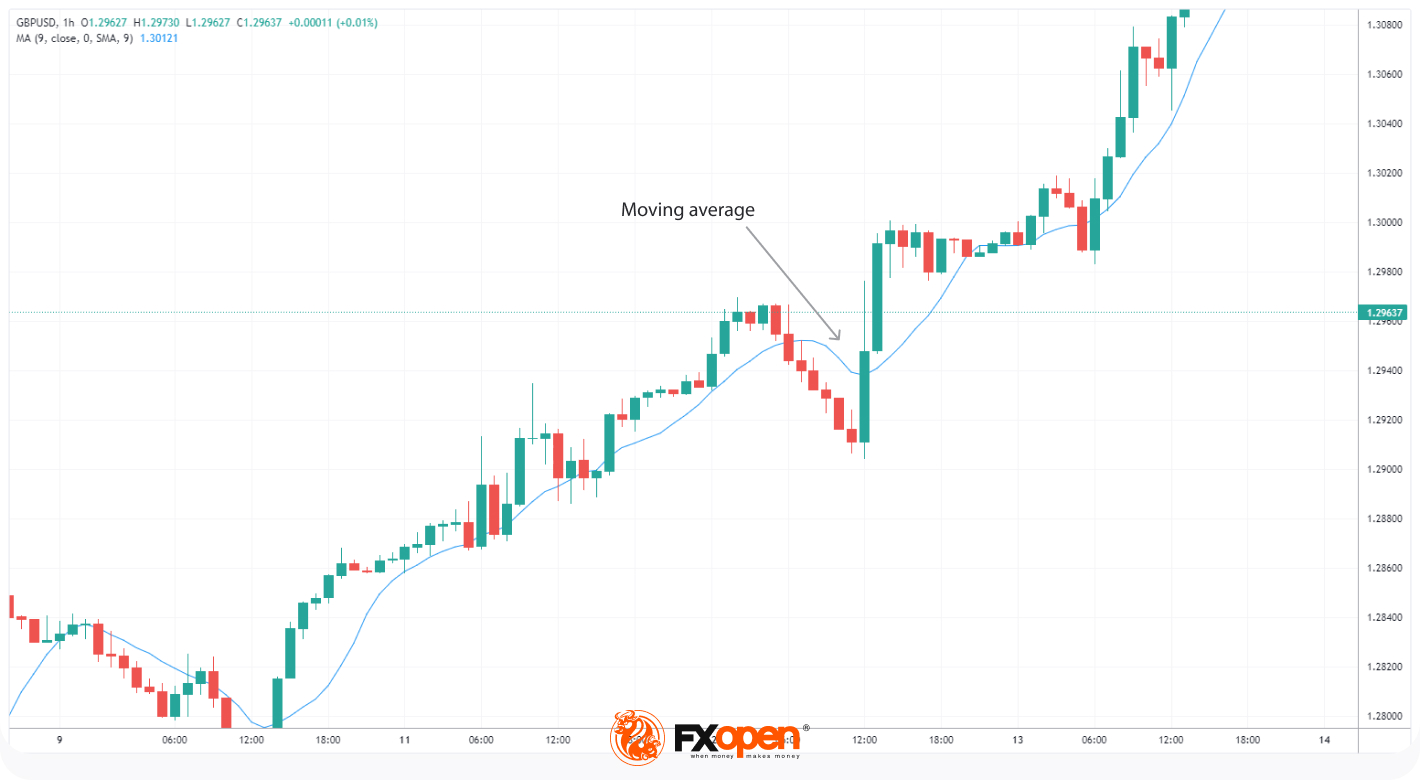
A moving average is a fundamental technical analysis tool used in financial markets to analyse price trends and identify potential trading opportunities. It provides a smoothed representation of price data over a specified period, enabling traders and investors to filter out short-term fluctuations and better understand the underlying trend. By plotting the average of past price points, the indicator creates a continuous line on a price chart, making it easier to spot trends and potential reversals.
There are several types of MAs used in technical analysis. The choice of MA depends on the trader's preferences, trading strategy, and the market conditions. Let's go through some of the most common types of MAs:
- Simple Moving Average (SMA): This is the most common or basic type of moving average. It calculates the average price over a specified number of periods and equally weights each data point. For example, a 10-day SMA calculates the average closing price of the last 10 days and updates it with each new day's data.
- Exponential Moving Average (EMA): It gives more weight to recent price data, thus, becoming more responsive to current market conditions. It is calculated using a formula that applies a weighting multiplier.
- Weighted Moving Average (WMA): The WMA assigns different weights to different data points, giving more importance to recent prices. The weighting scheme can vary, but commonly, the most recent data points have the highest weights.
- Smoothed Moving Average (SMMA): The Smoothed Moving Average is a variation of the EMA, but it considers an extended history of price data. It attempts to provide a smoother curve by applying an additional smoothing factor.
Types of Moving Averages Crossover
A crossover is one of the key signals traders use when utilising this indicator. A cross occurs when two moving averages with different periods intersect each other. Crosses can be found on any timeframe. Therefore, traders use moving averages even for day trading.
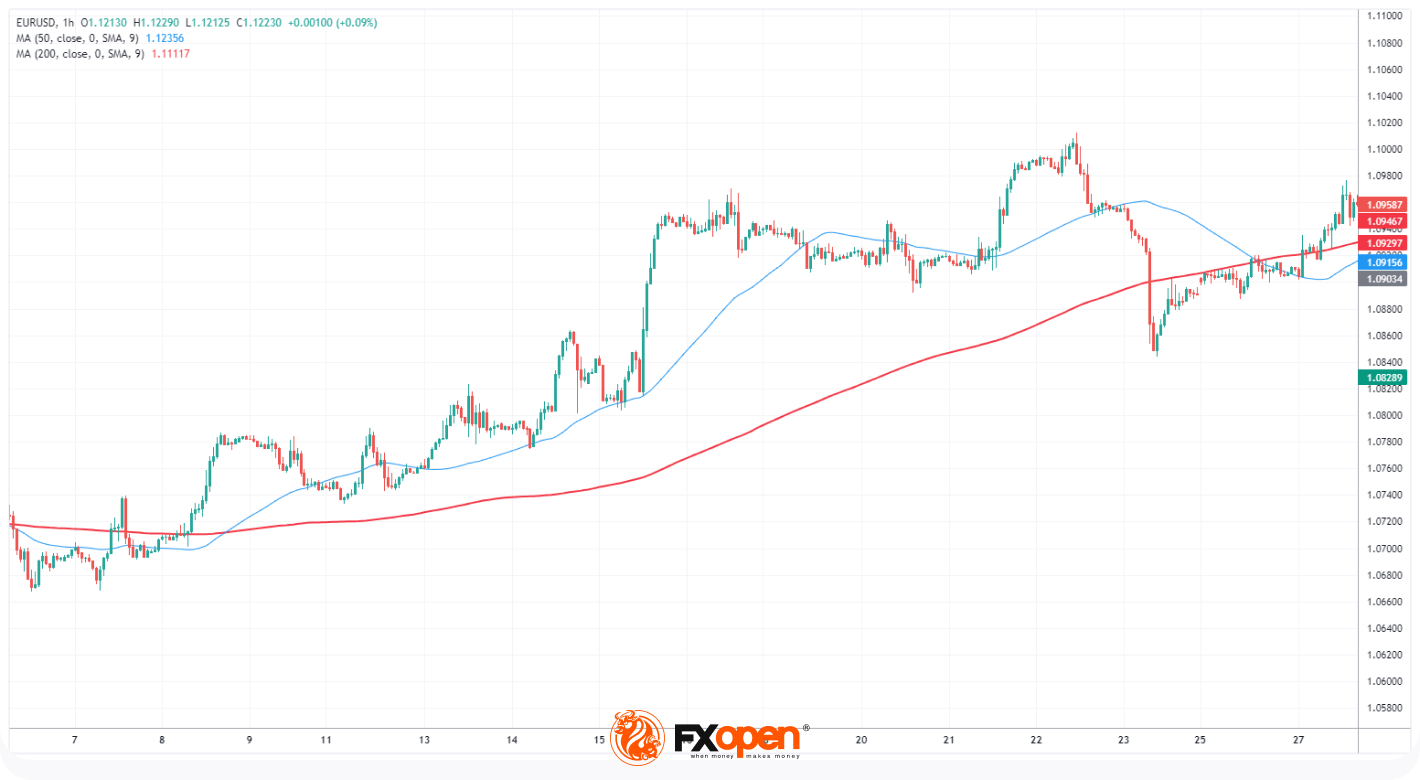
- Bullish MA Crossover: This occurs when a shorter-term moving average, such as a 50-hour EMA, crosses above a longer-term one, like a 200-hour EMA. This crossover is considered a bullish signal, indicating a potential upward trend and often signalling a buying opportunity. The TickTrader chart below highlights a bullish run when the 50-hour EMA crosses above the 200-hour EMA.
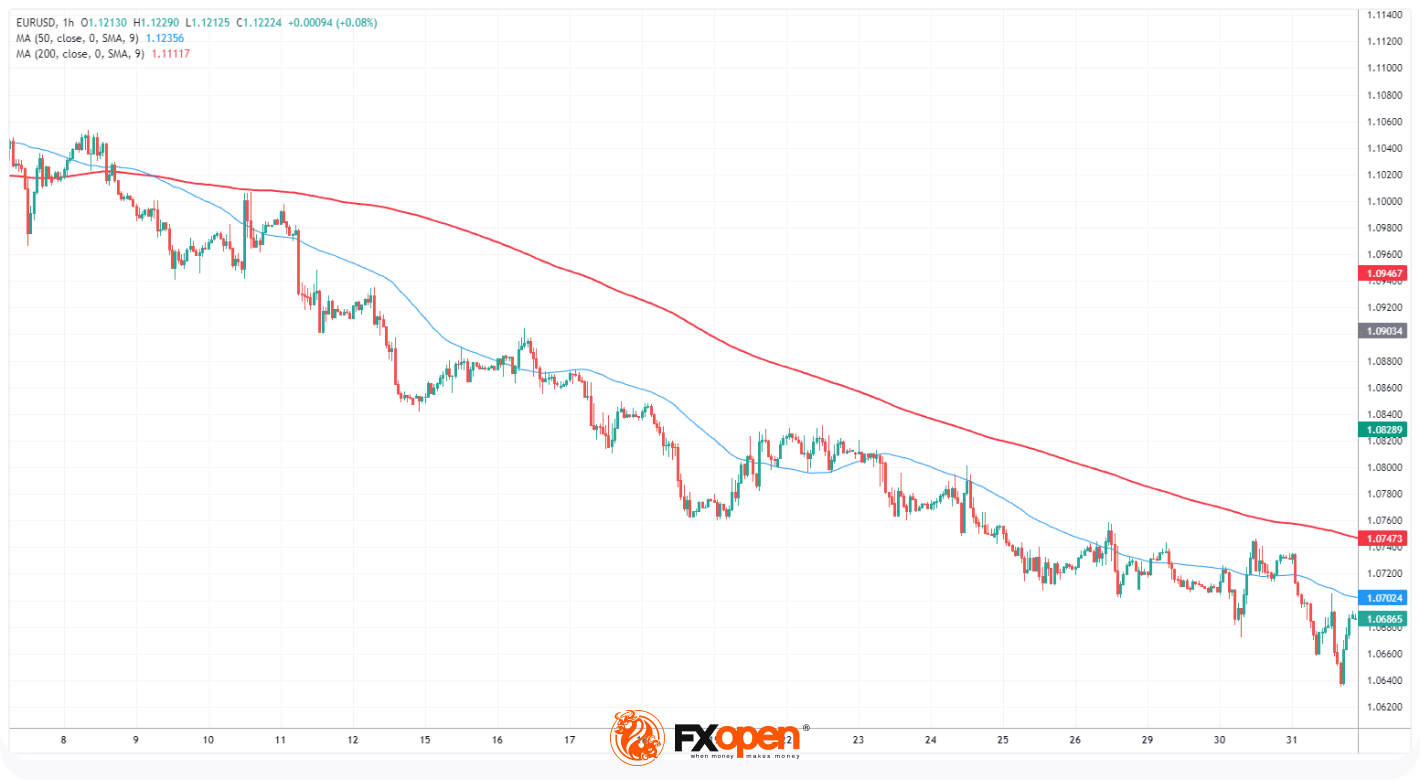
- Bearish MA Crossover: On the other hand, a bearish crossover happens when a shorter-term MA crosses below a longer-term one. For instance, if a 50-hour EMA moves below a 200-hour EMA, it suggests a potential downward trend and may signal a selling opportunity. FXOpen’s TickTrader chart highlights a bearish run as the 50-hour EMA crosses over the 200-hour EMA from above.
Confirming the Moving Averages Crossover
While MA crossovers can provide valuable insights into potential trends, it is essential to confirm these signals using additional tools:
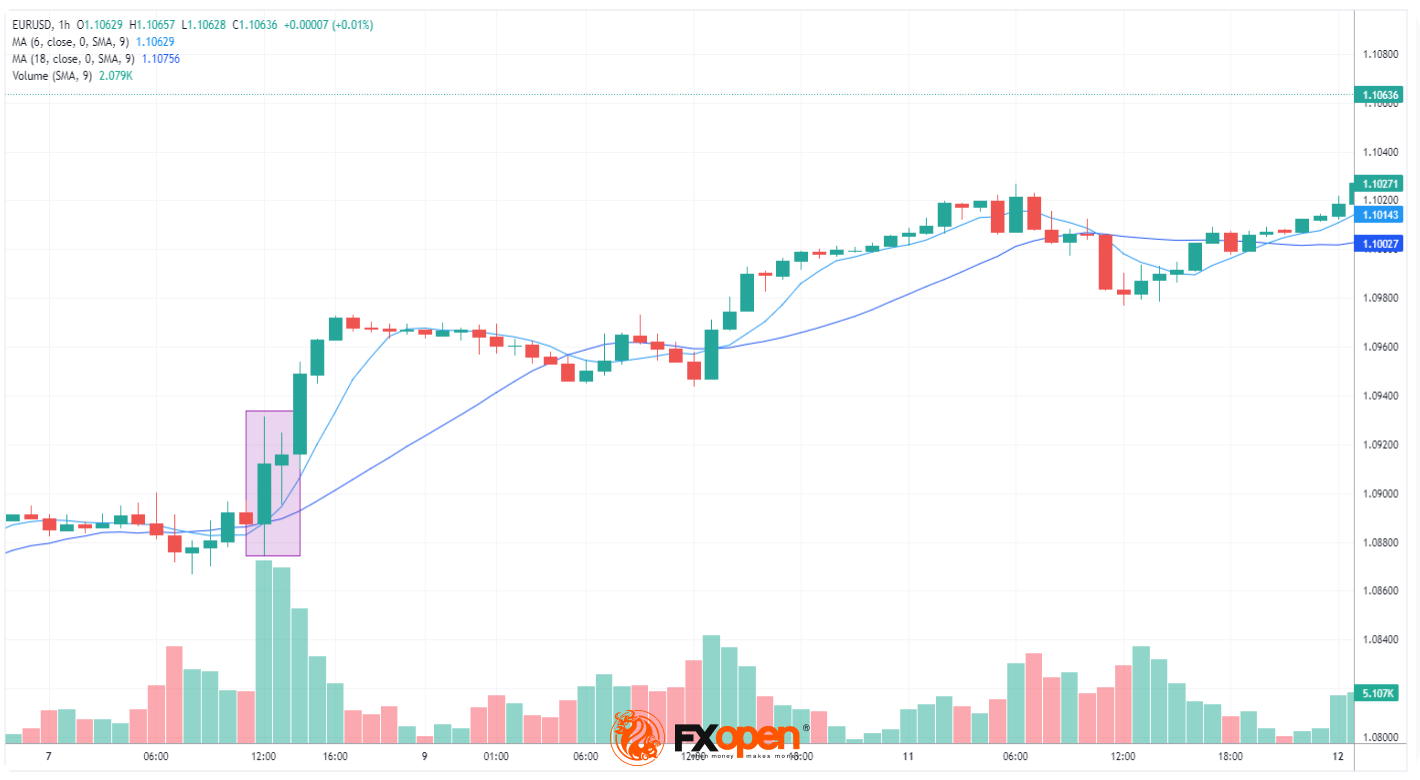
- Volume Analysis: Analysing trading volume alongside moving average crossovers can enhance the reliability of the signals. A substantial increase in volume during a crossover can signify stronger market participation, supporting the validity of the trend reversal. The chart below shows a crossover coupled with rising volumes.
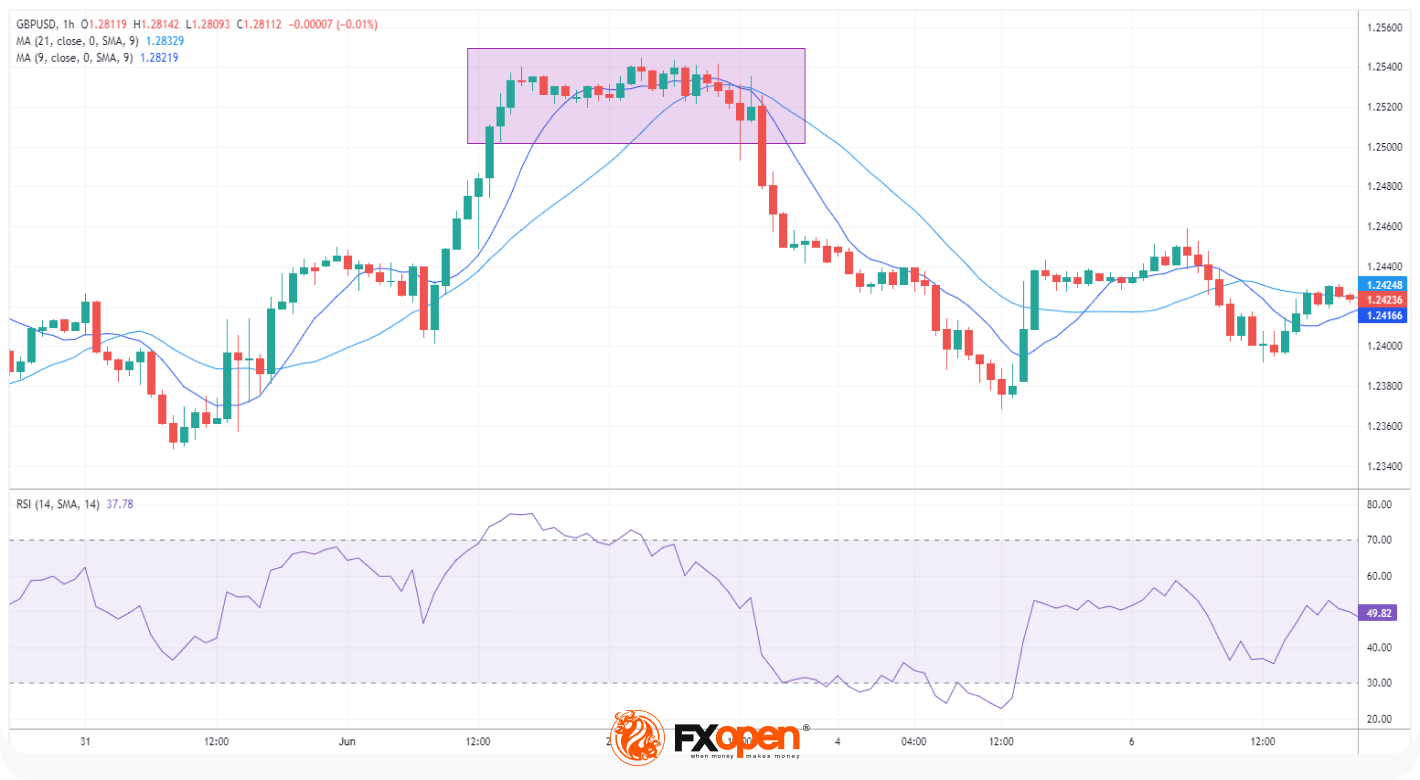
- Oscillators and Indicators: Utilising additional technical indicators, such as the Relative Strength Index (RSI) or Moving Average Convergence Divergence (MACD), can provide supplementary confirmation. Overbought/oversold conditions reflected by oscillators signal potential trend reversals and strengthen the crossover signal.
Look at the GBPUSD chart below. A move away by the RSI indicator from the overbought area, coupled with a MA crossover, provided additional confirmation of the trend reversal.
Advantages and Limitations of Moving Average Crossovers
Let's go through some advantages of MA crossovers:
- Simplicity: Moving average crossovers are straightforward to understand and implement. They involve plotting two MAs on a price chart and observing the interactions.
- Trend Identification: They help identify the prevailing trend in a market. A bullish crossover, where a shorter-term MA crosses above a longer-term one, signals a potential uptrend, while a bearish crossover, where the shorter-term moving average crosses below the longer-term one, indicates a potential downtrend.
- Signal Generation: Crossovers can generate trading signals, telling traders when to enter or exit positions. These signals are based on the assumption that crossovers represent significant shifts in market sentiment. Therefore, moving averages are used for swing trading.
- Smoothing Effect: They smooth out price fluctuations, making it easier to identify trend changes amid market noise.
- Versatility: Traders can customise the length of MAs to suit their trading strategies and timeframes, allowing them to adapt to various market conditions.
Here are the limitations of MA crossovers:
- Lagging Indicator: MAs are lagging indicators because they are based on past price data. As a result, crossovers may occur after the start of a new trend, leading to delayed entries and exits.
- Whipsawing: In choppy or sideways markets, the indicator may generate frequent crossovers. These false signals can result in losses and frustration for many market participants.
- Lack of Precision: Crosses may not be precise enough to capture short-term price movements. They may work better in trending markets but struggle in ranging or volatile conditions.
- Insensitivity to Market Conditions: As moving averages are lagging indicators, they may not fully adapt to changing market dynamics or sudden spikes in volatility.
- Needed to be adjusted: While moving averages are effective in all markets, they may provide inaccurate signals, particularly during periods of low liquidity or unusual price behaviour. Therefore, they need to be adjusted to fit particular market conditions.
Final Thoughts
Swing and day trading with moving averages is one of the more popular trading approaches due to its simplicity and effectiveness. However, traders should note that without astute risk management and a proper trading plan, it is difficult to succeed in the financial markets. After developing a strong hand in MAs, you may consider opening an FXOpen account and trading various financial instruments.
This article represents the opinion of the Companies operating under the FXOpen brand only. It is not to be construed as an offer, solicitation, or recommendation with respect to products and services provided by the Companies operating under the FXOpen brand, nor is it to be considered financial advice.
Stay ahead of the market!
Subscribe now to our mailing list and receive the latest market news and insights delivered directly to your inbox.


Latest articles

Tesla (TSLA) Shares Surge Following Musk’s Announcements
According to the chart, Tesla (TSLA) shares had been under significant pressure since the start of 2026: from their December high, they had lost around 25% of their value. The main bearish drivers included:
→ Intense competition from Chinese automakers, particularly

XTI/USD Analysis: WTI Oil Prices Under Pressure from Trump’s Statements
Yesterday, following a false bullish breakout above the psychological $100 level, WTI crude prices fell sharply towards the $85 area. The primary driver of this rapid decline was comments made by the US President.
According to Donald Trump:
→ the United
