


FXOpen
Candlestick patterns are important tools in analysing market movements and making trading decisions. Among these patterns, the Doji candlestick is particularly popular for identifying potential price reversals.
The Gravestone Doji is a unique and powerful candlestick pattern. Like other Dojis, it reflects the market's sentiment and provides insights into the ongoing battle between buyers and sellers. This article explores the characteristics of the Gravestone Doji candlestick pattern and explains how to identify and trade it.
Gravestone Doji Pattern: An Overview
In technical analysis, Doji candlesticks signify market indecision and commonly occur before a price reversal.
There are several types of Doji patterns, each with distinct characteristics and implications. Here are the main types:
- Standard Doji: It looks like a cross with a very small body, while the upper and lower shadows are almost equal in length. It mostly signifies market indecision.
- Dragonfly Doji: Its open, high, and close prices are almost the same, with a long lower shadow and no upper shadow. The Dragonfly Doji implies a potential bullish reversal or indecision among market participants.
- Long-Legged Doji: It features very long upper and lower shadows with the open and close prices close to the middle of the candlestick's range. This candlestick reflects significant market volatility with no particular signal.
- Four-Price Doji: Extremely rare, this candlestick forms when the open, high, low, and close prices are all the same, resulting in a single horizontal line without any shadows. A four-price candle signifies extreme indecision and a lack of volatility in the market.
Criteria for the Gravestone Doji Candlestick Pattern
Traders follow these steps to identify the Gravestone candlestick:
- Uptrend: The pattern usually appears at the top of an uptrend.
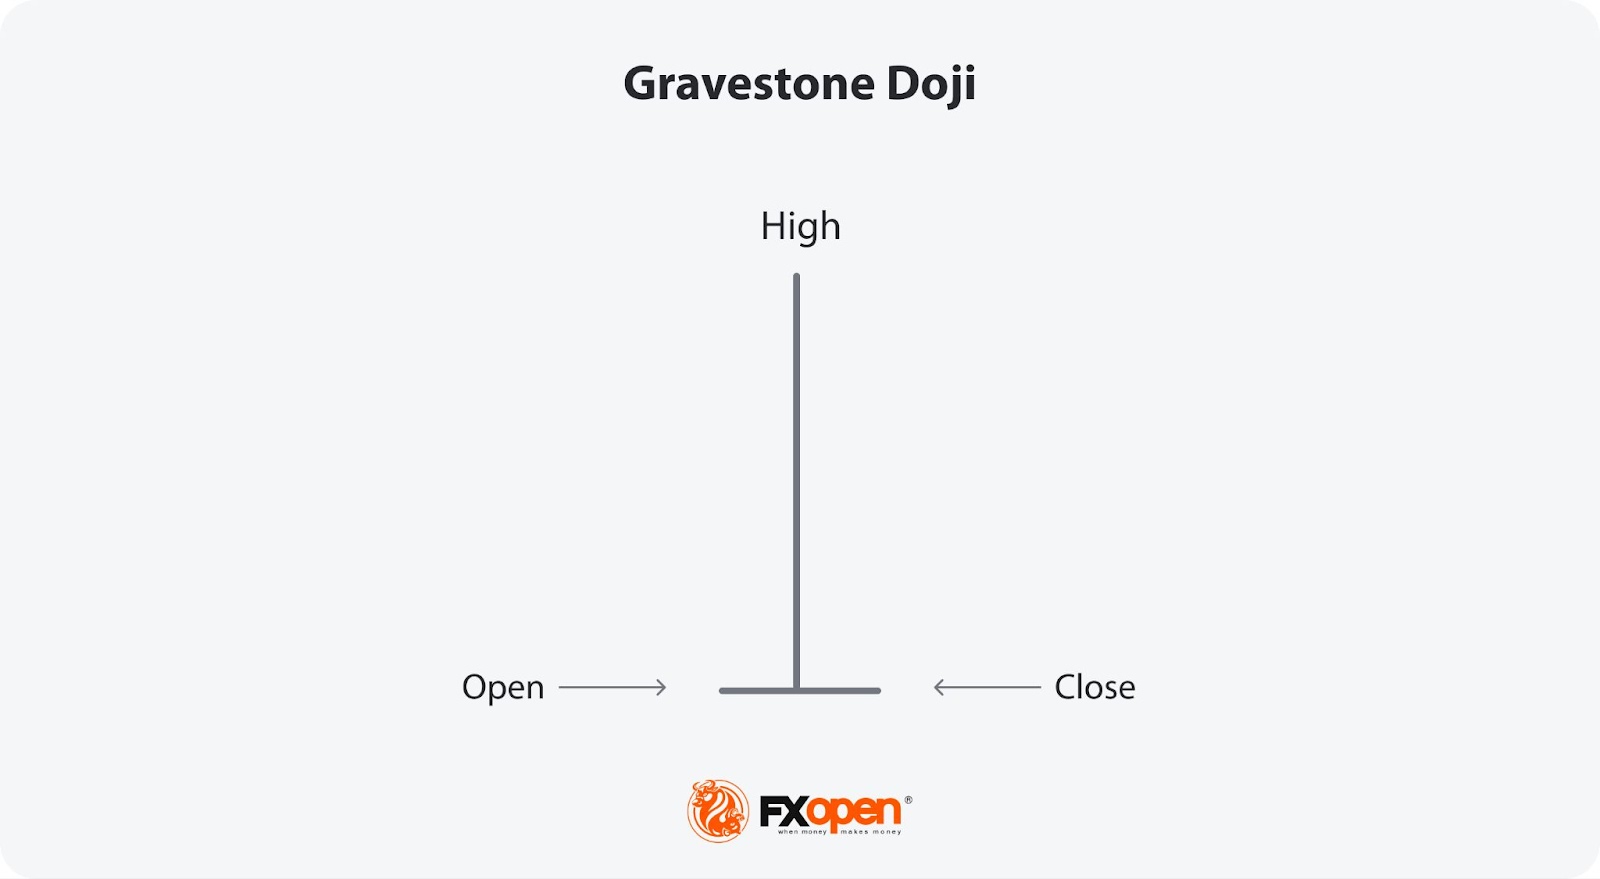
- Small or Non-existent Body: It has a very small or non-existent body where the open, low, and close prices are almost equal. You might be on the lookout for a thin horizontal line at the bottom of the candlestick.
- Long Upper Shadow: According to theory, a long upper shadow extends from the small body. The upper shadow should be significantly longer than the body, indicating a substantial upward move during the trading session.
- Little or No Lower Shadow: You may check to confirm that the lower shadow is very small or non-existent.
Analysing the Gravestone Doji Pattern
Primarily, the Gravestone candle is considered a bearish reversal pattern, particularly when it appears at the top of an uptrend. It suggests that buyers initially drove the price up during the session, but sellers took over, pushing the price back down to the opening level. This shift from bullish to bearish sentiment may signal the end of an uptrend and the beginning of a downtrend.
Although the pattern is mostly found at the top of an uptrend, it occasionally forms within a downtrend after a short-term pullback. The Gravestone Doji in a downtrend usually suggests a continuation of the downward movement. The least frequent scenario is when the Gravestone Doji becomes bullish. Then, it appears at the end of a downtrend, signalling that the trend is exhausted and a bounce is about to happen or a bullish reversal is imminent.
When the Gravestone Doji forms in a sideways trend, it doesn’t provide any clear signals – the ranging market is likely to continue.
Application in Trading Strategies
There are two popular ways of trading the Gravestone Doji candlestick. These are bearish reversals and bearish continuations.
Bearish Reversal
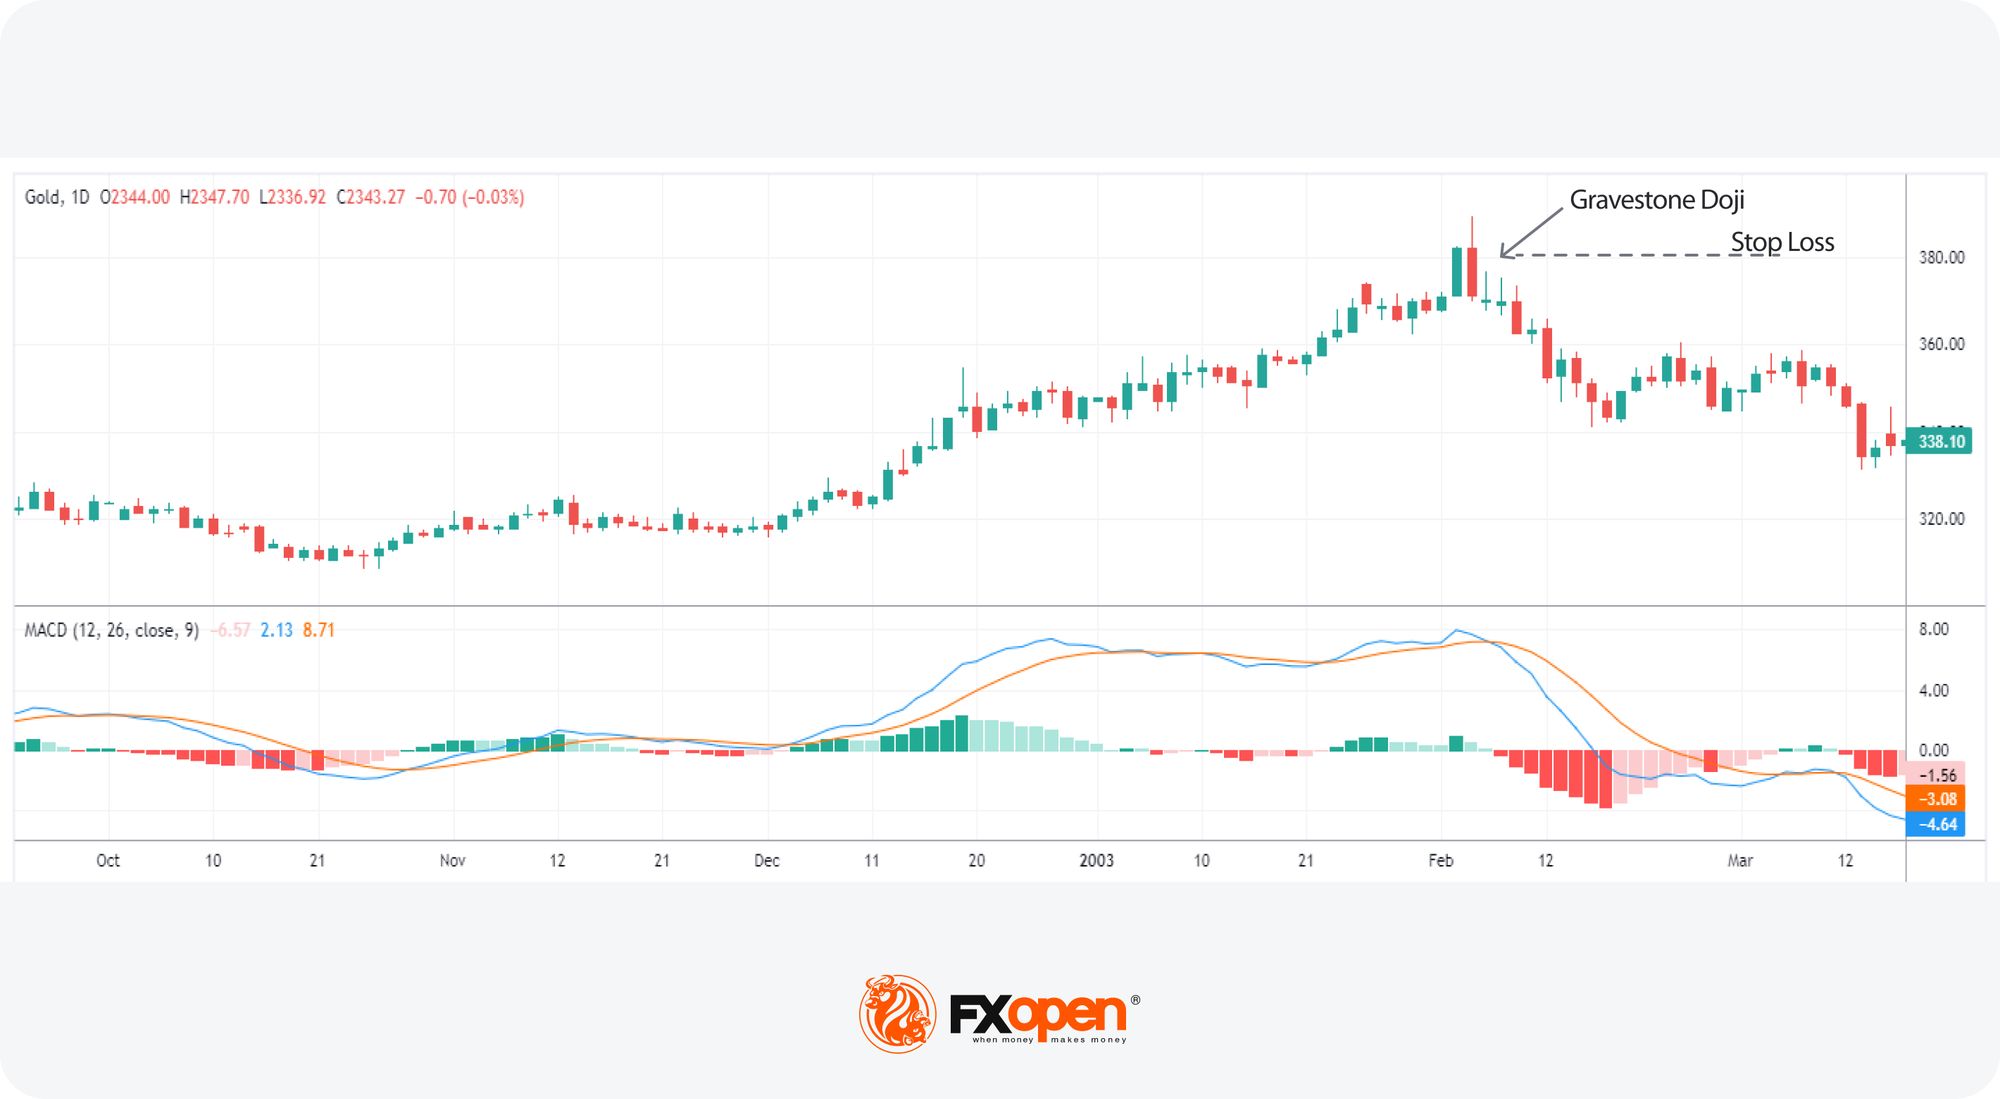
The XAUUSD daily chart above shows that the pattern formed close to the top of an uptrend. Since the candlestick indicates a bearish reversal, the trader might decide to open a sell position to take advantage of the bearish sentiment that is about to begin.
Usually, traders wait for the next candlestick to close below the Gravestone’s low before entering a sell position. The stop loss might be set above the Gravestone’s high, while the take profit could depend on the trader's risk appetite or risk management strategies.
Bearish Continuation
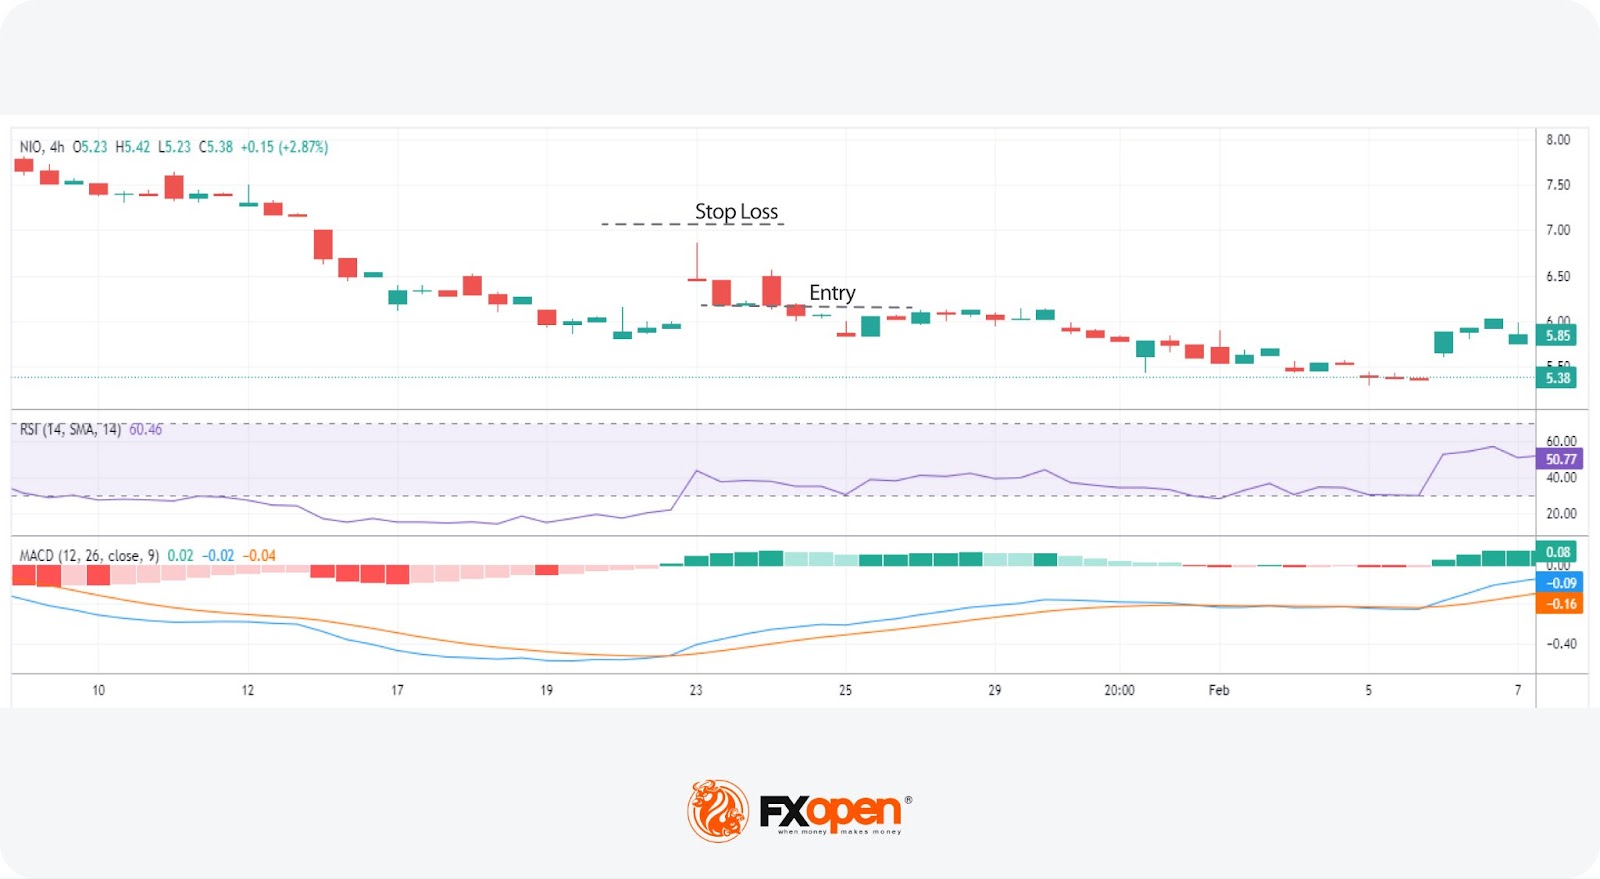
In the chart above, a Gravestone Doji candle forms in a downtrend. A trader might decide to open a short position after the price breaks the low of the Gravestone candlestick. For a more conservative entry, a trader might consider the close of the candlestick formed after the Doji. The stop loss could be placed above the high of the Gravestone candle, while the take-profit target could be set according to the trader’s strategies or risk/reward ratio.
In any case, it is important to note that there is no perfect strategy, and a loss of trading capital may occur.
Confirming the Pattern with Other Trading Tools
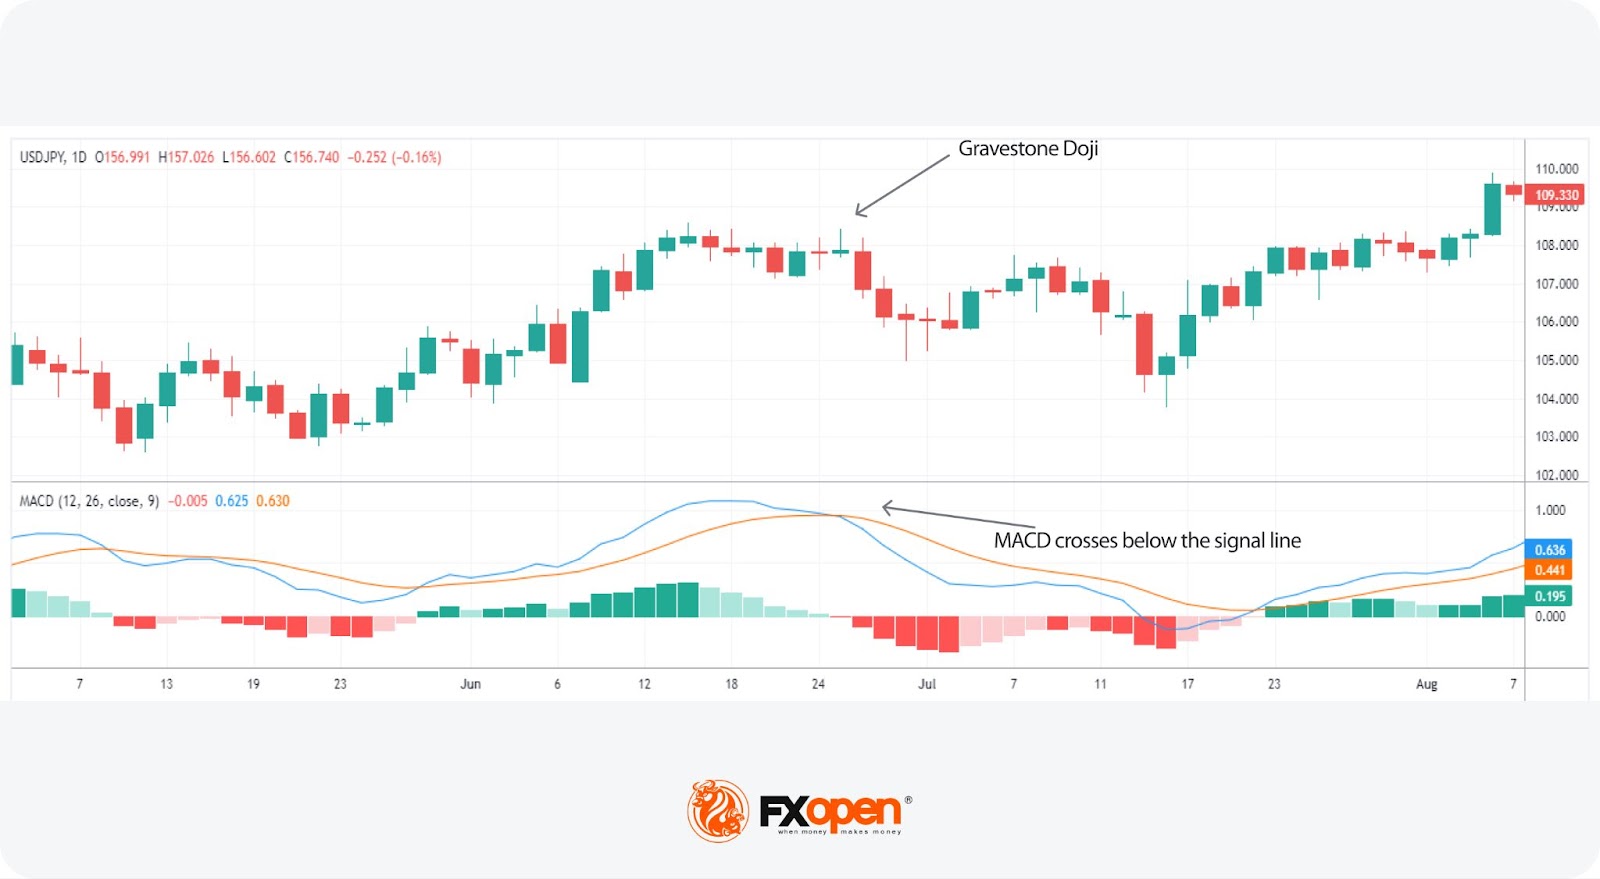
Relying solely on the Gravestone Doji candlestick for trading decisions may be insufficient, as no single pattern can guarantee accurate signals. However, the accuracy of signals may be improved by combining the candlestick with other trading tools, such as MACD or RSI. These indicators measure the momentum of the price movement and indicate if a reversal in the price direction is likely to occur. The divergence between the price and the RSI or a crossover of the MACD and signal lines may help traders confirm a potential reversal.
In the USDJPY daily chart below, the MACD line crosses below the signal line as the Gravestone Doji candle forms. A forex trader may consider this as a confirmation of the downward price movement.
The RSI, MACD and over a thousand trading tools are available on FXOpen’s free TickTrader platform.
Gravestone Doji vs Dragonfly Doji
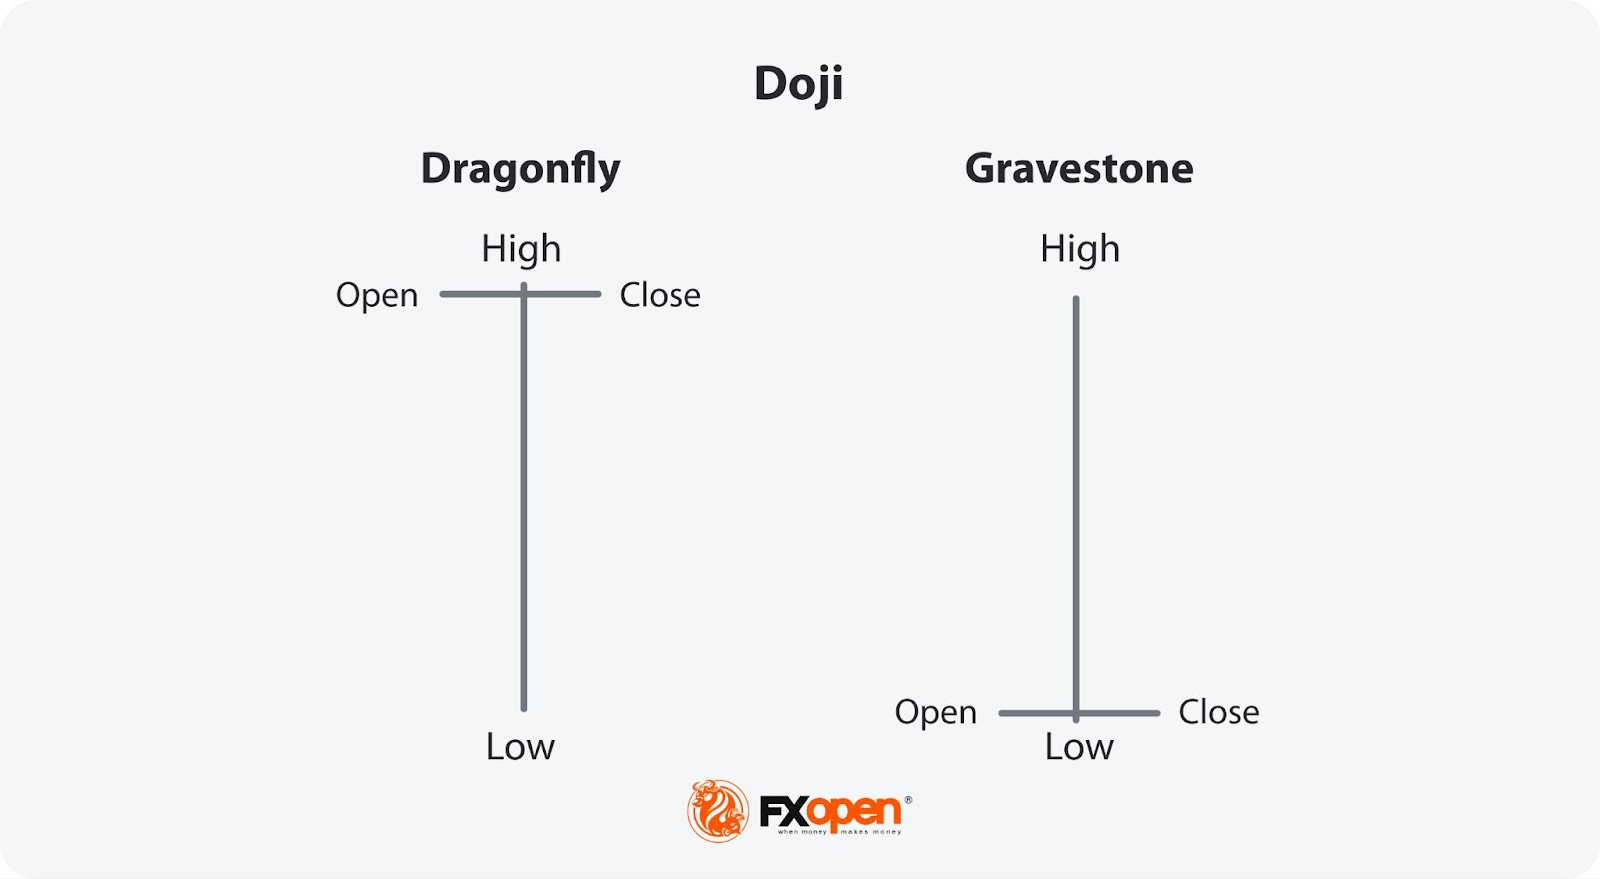
The two candlesticks are the opposites of each other. Understanding the distinct characteristics of each can help traders implement them in their trading strategies and make informed trading decisions.
The Bottom Line
The Gravestone Doji is a valuable candlestick pattern for identifying potential reversals in financial markets, including forex, stocks, and commodities. It can be particularly useful for traders looking to take advantage of price reversals. By understanding its features and signals, traders can integrate this pattern into their strategies to make more informed trading decisions.
However, no single pattern is infallible, so combining the Gravestone candlestick with other analysis tools may potentially yield more effective results. If you want to try out strategies with the Gravestone Doji, open an FXOpen account to access a sophisticated trading platform and multiple assets and trading tools.
FAQs
What Does a Gravestone Doji Indicate?
It indicates bearish market sentiment. Typically, when it appears near the peak of an uptrend, it suggests that the bullish run is likely to end. If the bearish Gravestone Doji forms within a downtrend, it usually signals a continuation of the current trend.
How Can I Trade a Gravestone Doji?
Traders usually trade the Doji candle by opening a short position after it is identified at the top of an uptrend. Traders might wait to confirm the reversal by the next candle breaking the low of the Gravestone Doji before opening a position. Additionally, they often confirm the pattern signals using indicators such as the RSI and MACD.
Are Gravestone Doji and Hammer Similar?
Though both patterns signal a trend reversal, the difference is that the Gravestone Doji appears before the uptrend turns into a downtrend, while the hammer occurs on the chart when the downtrend is potentially turning into an uptrend. Furthermore, they differ in appearance: the former has a long upper shadow, while the latter has a long lower shadow.
What Is the Difference Between a Dragonfly Doji and a Gravestone Doji?
These patterns are opposite in shape and market sentiments. The Dragonfly Doji looks like the upper case letter ‘T’, while the Gravestone Doji resembles an inverted ‘T’. The former provides bullish signals and appears at the end of a downtrend, while the latter occurs at the end of an uptrend and informs traders about a potential bearish reversal.
Are Gravestone Doji and Shooting Star the Same?
No, they are not the same. They both provide bearish signals and look alike because both have small bodies and long upper shadows. However, the Shooting Star has a bigger body and a shorter upper shadow than the Gravestone Doji.
This article represents the opinion of the Companies operating under the FXOpen brand only. It is not to be construed as an offer, solicitation, or recommendation with respect to products and services provided by the Companies operating under the FXOpen brand, nor is it to be considered financial advice.
Stay ahead of the market!
Subscribe now to our mailing list and receive the latest market news and insights delivered directly to your inbox.


Latest articles

The EUR/AUD Pair Rose by More Than 2% Over the Week
If last Thursday trading was taking place below the 1.6300 level, today one euro is worth more than 1.6660 Australian dollars. The upward trend seen in recent days has been driven by a combination of factors, including:
→ Bullish

Silver Price Falls Back Below $70
As can be observed on the XAG/USD chart, the price of silver has once again dropped below the psychological $70 level. At the same time, this week has been marked by sharp fluctuations: on Monday, prices traded below $65,

USD/CAD Rises to a Two-Month High
Today, the USD/CAD currency pair climbed above the 1.3787 level for the first time since late January.
→ Demand for the US dollar is being supported by concerns over escalating tensions in the Middle East. Market participants are favouring