


FXOpen

Flags are crucial tools in technical analysis, offering traders insights into trend continuation. In this article, we’ll explore questions like “What is a bull flag pattern?” and “What does a bear flag look like?” alongside the pattern’s psychology, formal identification, and trading strategies.
What Is a Flag Pattern?
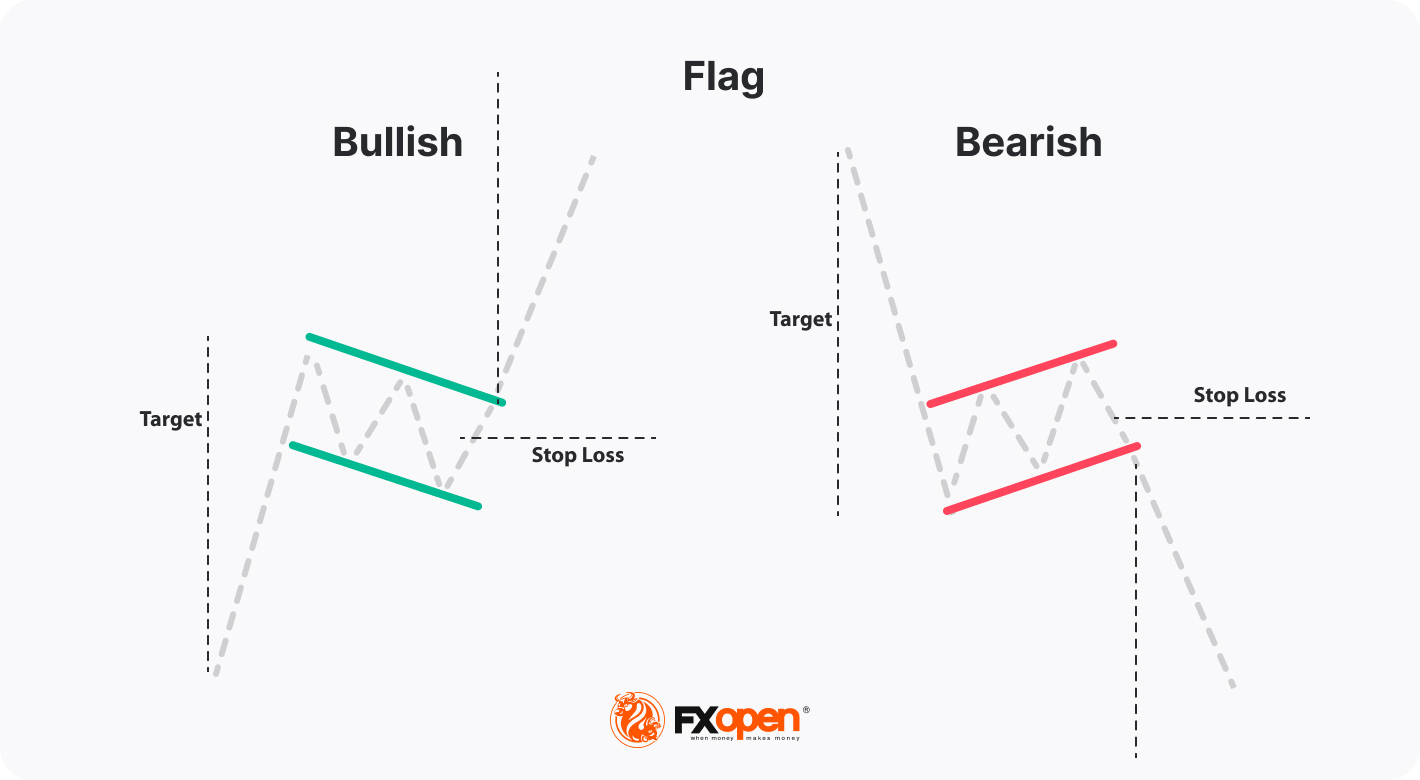
A flag is a continuation chart pattern that signals the potential for an ongoing trend to resume after a brief consolidation. It consists of a sharp price movement, known as the flagpole, followed by a rectangular consolidation phase that slopes against the prevailing trend, forming the flag. The flag is framed by parallel trendlines, acting as support and resistance.
This consolidation represents a temporary pause in the trend as market participants catch their breath before continuing in the trend's direction. Identifying a flag pattern helps traders anticipate the resumption of the prior trend, providing strategic entry points for trades.
Bullish Flag vs Bearish Flag
There are two flag types: bearish (bear) and bullish (bull).
- A bull flag chart pattern appears in an uptrend and is characterised by two falling trendlines. The upper boundary connects lower highs, while the lower one goes through lower lows.
- A bear flag chart pattern or reverse bull flag occurs in a downtrend and can be identified with two upward sloping trendlines, where the upper line connects higher highs while the lower goes through higher lows.
Flag Psychology
Understanding of pattern psychology may help traders grasp the concept in a straightforward way. The flag formation starts with a significant price movement that forms a solid trend. However, the trend can’t last indefinitely, so the price starts correcting. This is where the flag appears. Bulls in a downtrend and bears in an uptrend try to turn the price around; however, if there are no fundamental factors for a trend to reverse, it recovers.
Note: although the flag is a continuation pattern, its signals can be compromised. Therefore, traders check fundamental events to be sure that there is no reason for a trend reversal.
How Traders Spot Flags
Flags are among the simplest formations by appearance. To determine a flag, a trader needs to:
1. Find a solid trend. A pattern can be found on any timeframe. Still, if it's higher, the trend will be more reliable.
2. Look for a correction. In a downtrend, the price should form higher highs and higher lows; in an uptrend, the price should form lower highs and lower lows.
3. Draw trendlines. Any trendline goes through at least two points. Thus, to confirm a flag formation, there should be at least two swing highs and two swing lows so traders can draw trendlines.
How Can You Trade with the Flag Pattern?
Like most chart patterns, flags have particular entry and exit points. They can be changed according to the trading approach. However, if you don’t have sufficient experience, you can use the common rules.
Entry
Flags are breakout chart patterns, meaning traders wait for the price to break either an upper or a lower flag boundary, depending on the trend, to enter the market. The idea behind the pattern is to go long after the price rises above the resistance level in a bullish formation and go short after the price falls below the support level in a bearish setup.
The entry point itself depends on the trader’s approach. Some open a position as soon as the breakout occurs. However, this is the riskiest method, as a breakout may turn into a fakeout. Traders usually enter the market just after the breakout on short-term charts. Otherwise, the pattern may fail.
A fakeout is a market situation whereby a price breaks beyond a certain level but doesn’t continue moving in this direction and then reverses.
Another approach to trading flag patterns is more conservative. Traders enter the market after either the breakout candlestick or several candles in the breakout direction are closed. This allows them to be sure the pattern worked.
Take Profit
A take-profit target is based on the length of the flagpole. Traders measure the distance between the start of the trend and the end of the flag and place the same distance from the breakout trendline in the trend direction.
The rule can be changed if the flagpole is too long for the timeframe you trade in. As the trend can’t exist indefinitely, a reversal will occur anyway. The larger the flagpole, the more likely the price will reverse before reaching the target. In this case, you may consider using trailing take-profit orders and partially closing your trade.
Stop Loss
A stop-loss level can be identified according to a risk-reward ratio. The ratio will depend on your willingness to take risks and the current market conditions. However, the most common ratios are 1:2 and 1:3.
Another option is to identify a certain number of pips you will always set when trading with the flag formation. For this, you can use the TickTrader platform, which offers all the essential technical analysis tools and charts of various assets, including currencies, cryptocurrencies*, stocks, indices, ETFs, and commodities.
Note: regardless of your approach, the theory suggests that a stop-loss order should be placed beyond the pattern, thus, below the lower trendline in an uptrend and above the upper trendline in a downtrend.
Bull Flag Pattern vs Bear Flag: Trading Examples
Any bullish or bearish flag chart pattern on a live chart differs from ideal tutorial pictures. Let’s consider how the formations may look in a real market.
Bull Flag
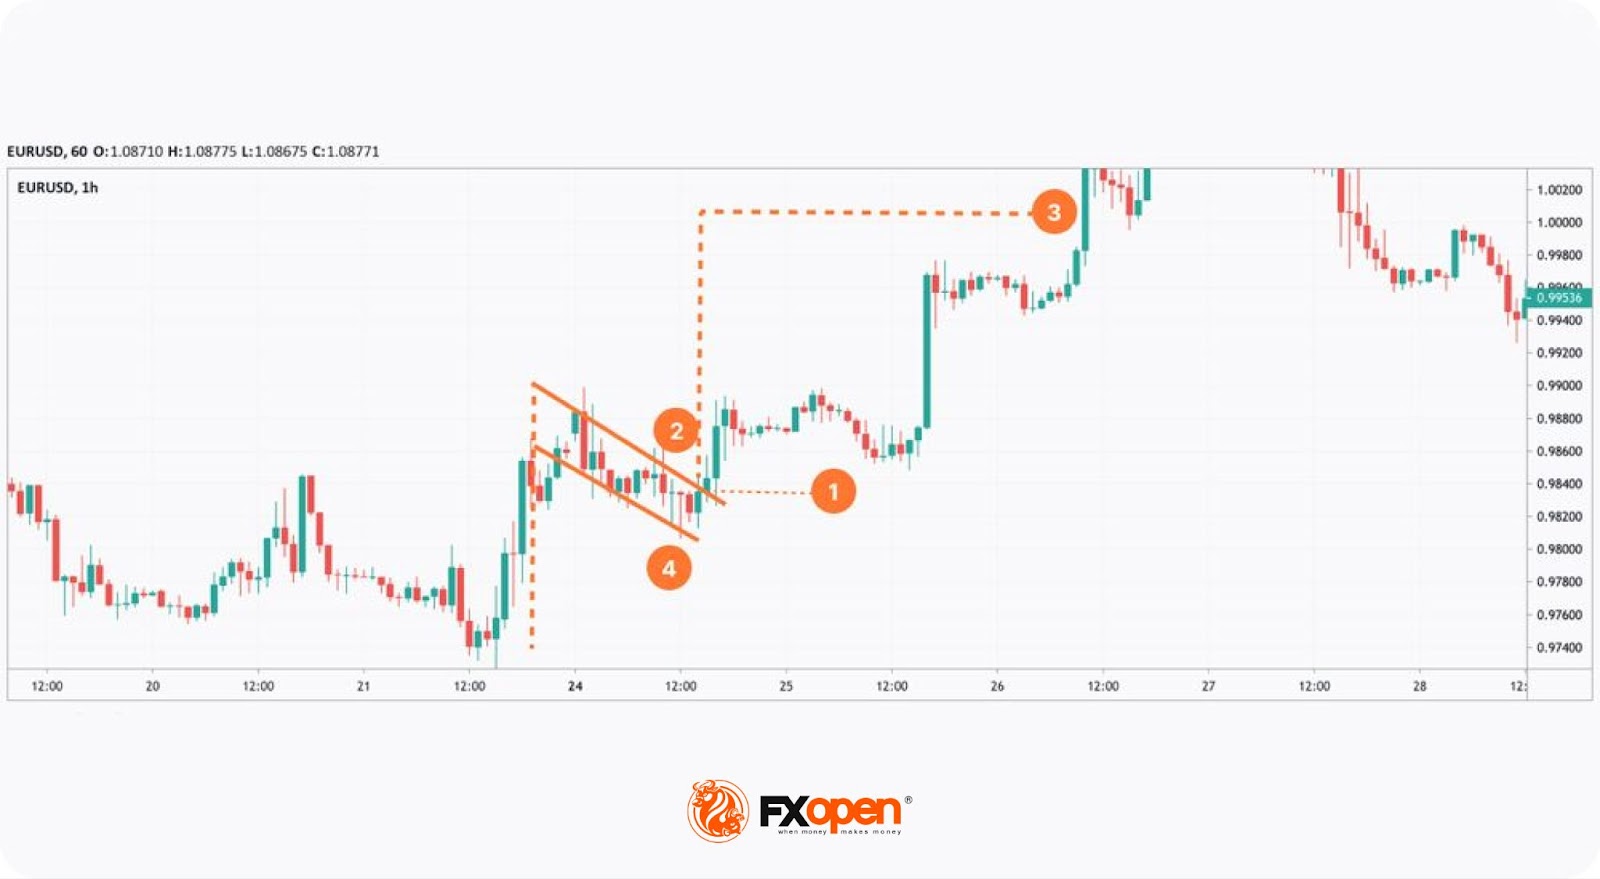
The chart above shows the bullish flag pattern breakout on an hourly chart of the EUR/USD pair. A trader could open a buy position after the breakout candlestick (1) or the second candlestick after the breakout (2). The second candle is bullish and long, which could confirm a trend continuation.
A take-profit target would equal the flagpole length (3) and would be measured from the upper trendline. A stop-loss level could be calculated based on the risk-reward ratio. As the trend is solid but not in place for a prolonged period, a higher ratio of 1:3 would work better. Also, a trader could place the stop-loss level just below the lower trendline (4).
Bear Flag
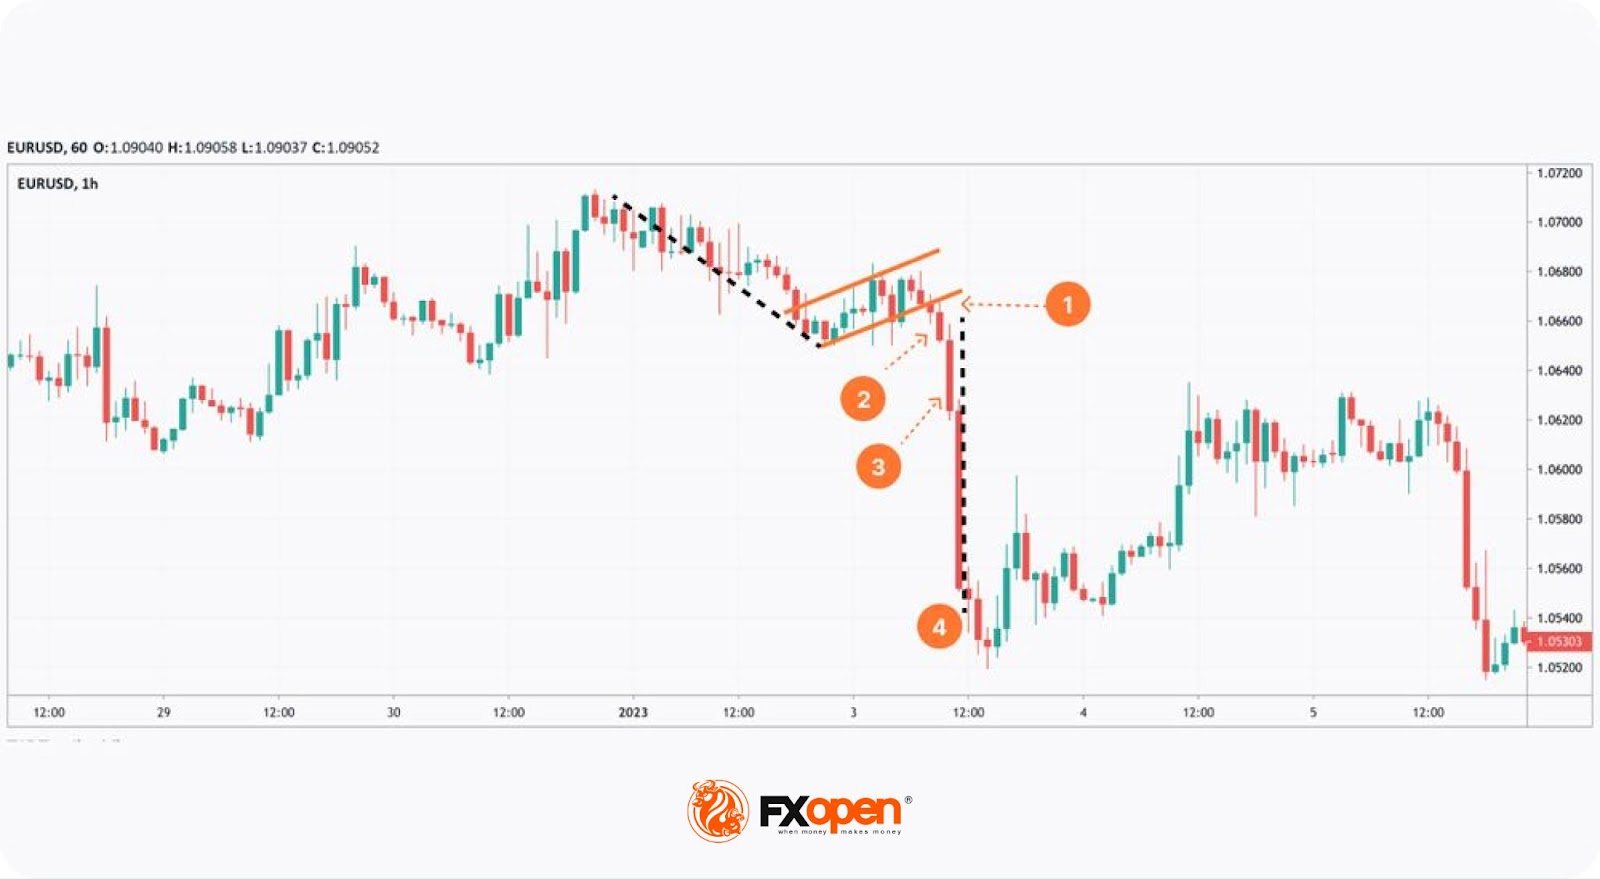
The hourly chart of the EUR/USD pair reflects a bear formation. A trader could go short after the breakout, second or third candles (1, 2, or 3). The choice would depend on the overall market sentiment and the trader’s risk aversion.
A take-profit level would equal the pole length (4). A trader could use a trailing take-profit order. A stop-loss level could be defined by the risk-reward ratio. Again, the trader could use a higher ratio as the downtrend is strong.
How Can You Confirm Bull and Bear Flag Patterns’ Signals?
The primary flag signal is a trend continuation. However, the pattern may fail if market conditions change. Therefore, it’s vital to validate it.
- Volumes. A breakout is a key pattern signal that allows traders to open a trade. As there are risks of a fakeout, traders should be sure the breakout is valid. Volumes are the first tools that can confirm a breakout. If the volumes grow when the price breaks a trendline, there is a high chance it will continue moving in the breakout direction.
- Trend indicators. As flags confirm a trend continuation, oscillators won’t help traders confirm their signals, but trend indicators may be effective. The widely used Bollinger Bands, moving averages, and Fibonacci retracements may be used. You can open an FXOpen account and test these and other indicators on live charts.
Trading Strategies with Flags
Flags can be implemented in various trading strategies.
Flag and Moving Average Strategy
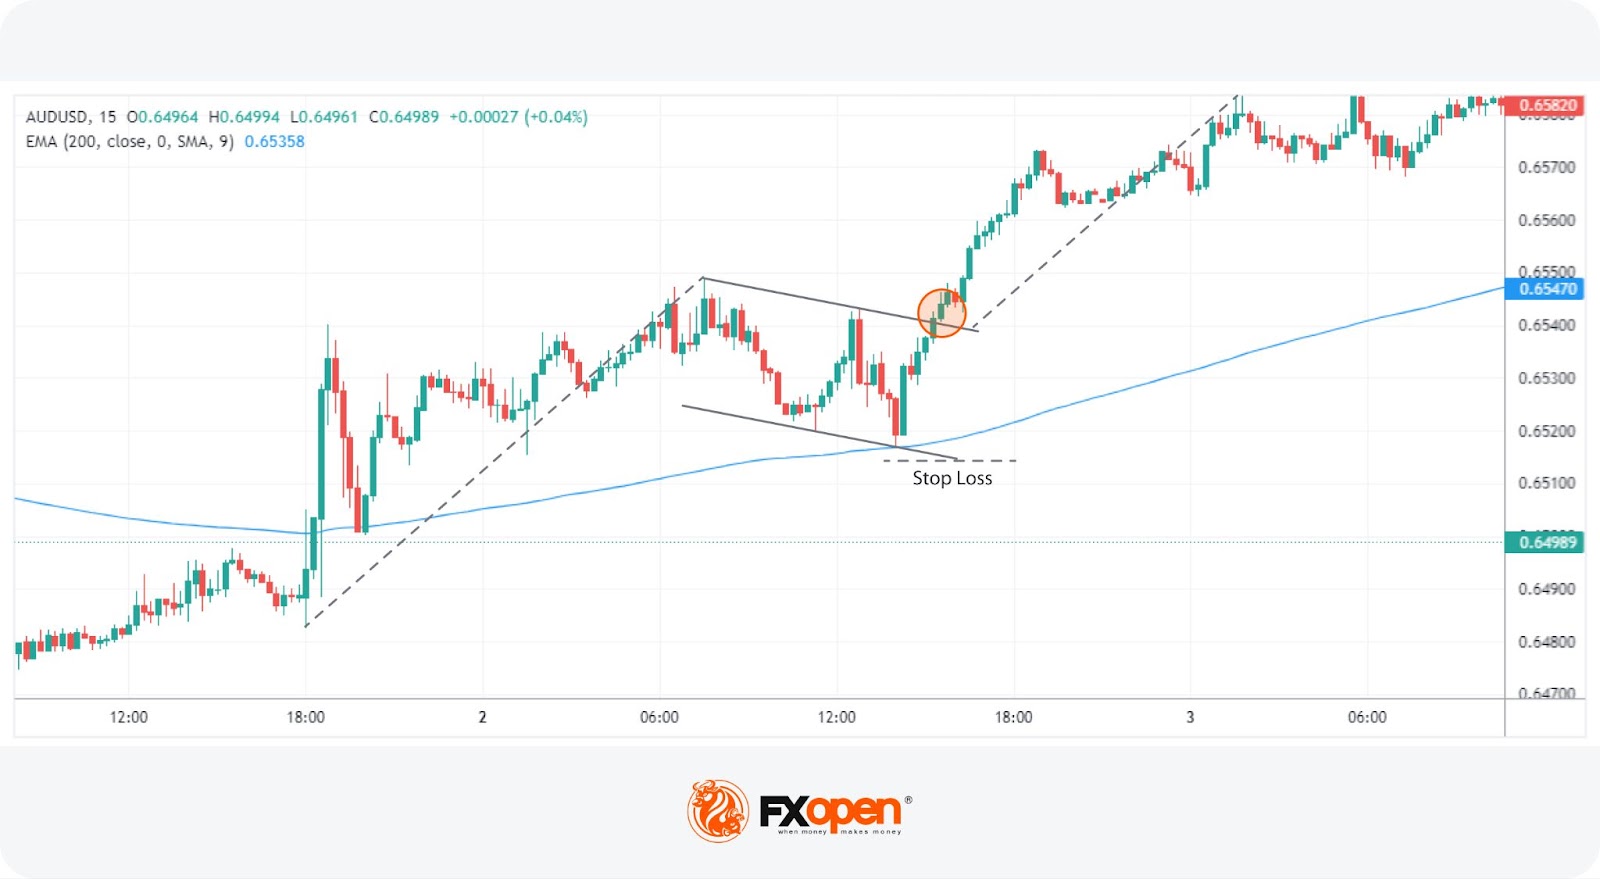
The Flag and Moving Average strategy combines flag patterns with a moving average, typically a 50- or 200-period MA, to enhance breakout confirmation. We’ve used the 200-period EMA here. Using a moving average, traders gain additional confidence in trend continuation by observing price interactions with the MA during flag formation.
Entry:
- Traders watch for the price to touch the MA, using it as a support or resistance level.
- Entry occurs when the price touches the MA and then breaks out of the flag pattern.
Stop Loss:
- A stop loss is typically set beyond the moving average to potentially mitigate risk.
Take Profit:
- Profit targets are usually based on the flagpole's length, adding it to the breakout point.
Breakout and Retest Flag Strategy
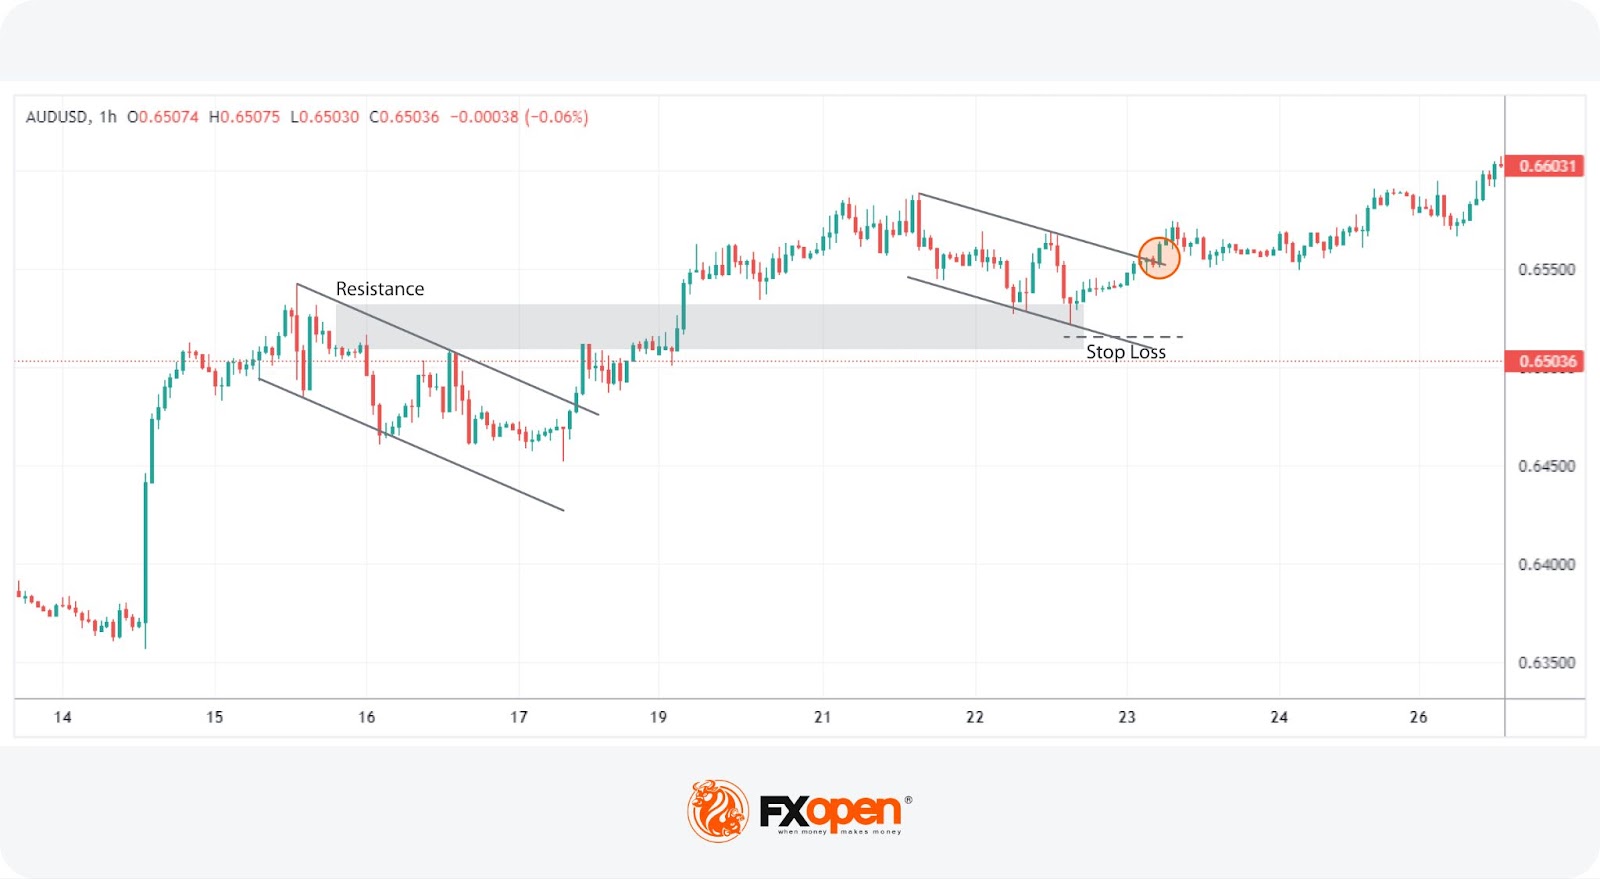
The Breakout and Retest strategy leverages the flag pattern's retracement into previous support or resistance levels to enhance breakout confidence. This signal is considered stronger when the prior breakout also resulted from a flag, indicating a robust trend continuation.
Entry:
- Traders often look for the flag to retrace into a previously broken support or resistance area.
- Extra confirmation occurs if the previous breakout was due to a flag.
- Entry typically happens when the flag touches the support or resistance and then breaks out.
Stop Loss:
- Stop losses are usually set beyond the high or low of the flag.
Take Profit:
- Profits may be targeted based on the flagpole's length.
Flags: Advantages and Limitations
Flag patterns are valuable tools in technical analysis, offering insights into trend continuation. However, they come with their own set of advantages and limitations.
Advantages
- Trend Continuation: Flags help identify the continuation of an existing trend, providing clear entry points.
- Versatility: They can be found across various timeframes and asset classes, making them widely applicable.
- Well-identified Targets: The height of the flagpole can be used to set profit targets, aiding in trade planning.
Limitations
- False Breakouts: Flags can produce false signals, leading to potential losses if not confirmed by other indicators.
- Market Conditions: Changing market conditions can invalidate flag patterns, reducing their reliability.
- Subjectivity: Interpretation of flag patterns can be subjective, leading to inconsistent results among traders.
Final Thoughts
Bull and bear flag patterns provide clear visual cues for potential entry and exit points, helping traders take advantage of strong market momentum. However, as with any technical analysis tool, it’s important to confirm these patterns with other indicators and market analysis to avoid false signals. By mastering the recognition and application of bull and bear flags, traders can enhance their strategies, improve their timing, and ultimately increase their chances of effective trades. Open an FXOpen account and enjoy trading with tight spreads and low commissions.
FAQ
What Does a Bull Flag Mean?
A bullish flag indicates a continuation of an existing uptrend after a brief consolidation period. It consists of a sharp upward movement followed by a downward-sloping rectangular consolidation.
What Is the Meaning of a Bear Flag?
A bearish flag signals the continuation of a bearish trend. It features a steep price drop (the flagpole) followed by an upward-sloping rectangular consolidation phase.
What Is the Difference Between a Bear Flag Pattern and a Bull Flag Pattern?
A bullish flag chart pattern forms during an uptrend with a downward-sloping consolidation, while a bear flag forms in a downtrend with an upward-sloping consolidation. The primary difference lies in the trend direction and the slope of the consolidation.
How to Identify a Bull Flag?
To identify a bullish flag pattern, look for a strong upward price movement followed by consolidation within downward-sloping parallel trendlines. Confirmation occurs when the price breaks above the upper trendline.
How to Identify a Bear Flag?
Identifying a bearish flag pattern involves spotting a steep decline followed by consolidation within upward-sloping parallel trendlines. The pattern is confirmed when the price breaks below the lower trendline.
What Is the Bull and Bear Trading Strategy?
This strategy involves identifying flag patterns and trading breakouts. For a bull flag breakout, traders go long after a breakout above resistance. For bear flags, traders short the market following a breakout below support.
*At FXOpen UK and FXOpen AU, Cryptocurrency CFDs are only available for trading by those clients categorised as Professional clients under FCA Rules and Professional clients under ASIC Rules, respectively. They are not available for trading by Retail clients.
This article represents the opinion of the Companies operating under the FXOpen brand only. It is not to be construed as an offer, solicitation, or recommendation with respect to products and services provided by the Companies operating under the FXOpen brand, nor is it to be considered financial advice.
Stay ahead of the market!
Subscribe now to our mailing list and receive the latest market news and insights delivered directly to your inbox.


Latest articles

Consolidation Ahead of NFP: Commodity Currencies Search for Direction
Commodity-linked currencies have entered a consolidation phase following recent directional moves, as market participants adopt a wait-and-see approach ahead of key US labour market data. Current price action reflects a balance between ongoing demand for the US dollar and attempts

The Real Driver Behind the Dollar Rally: Market Insights with Gary Thomson
The US dollar has been firm, but the drivers behind the move may be more complex than they first appear.
While geopolitical tension and shifts in risk sentiment play a role, current price behaviour seems increasingly influenced by inflation expectations

EUR/USD and USD/CHF Pull Back: Market Reacts to Fundamentals
European currencies have shown a recovery in recent trading sessions after their recent decline, displaying early signs of a reversal. The US dollar is weakening amid expectations surrounding upcoming US macroeconomic data, while market participants are reassessing their short-term positions