


FXOpen
Markets often pause before making their next significant move, and triangle patterns are one of the signs of this consolidation. By studying symmetrical, ascending, and descending triangles, traders may anticipate breakouts and plan entries or exits. This article explains how traders construct these patterns and incorporate them into their trading strategy.
What Are Triangle Chart Patterns?
Triangle chart patterns are a common technical analysis tool used to understand price movements in financial markets. These patterns form when the price of an asset moves within two converging trendlines, creating a triangle shape on a chart. The lines represent support and resistance levels, and as they get closer together, it signals a potential breakout in one direction.
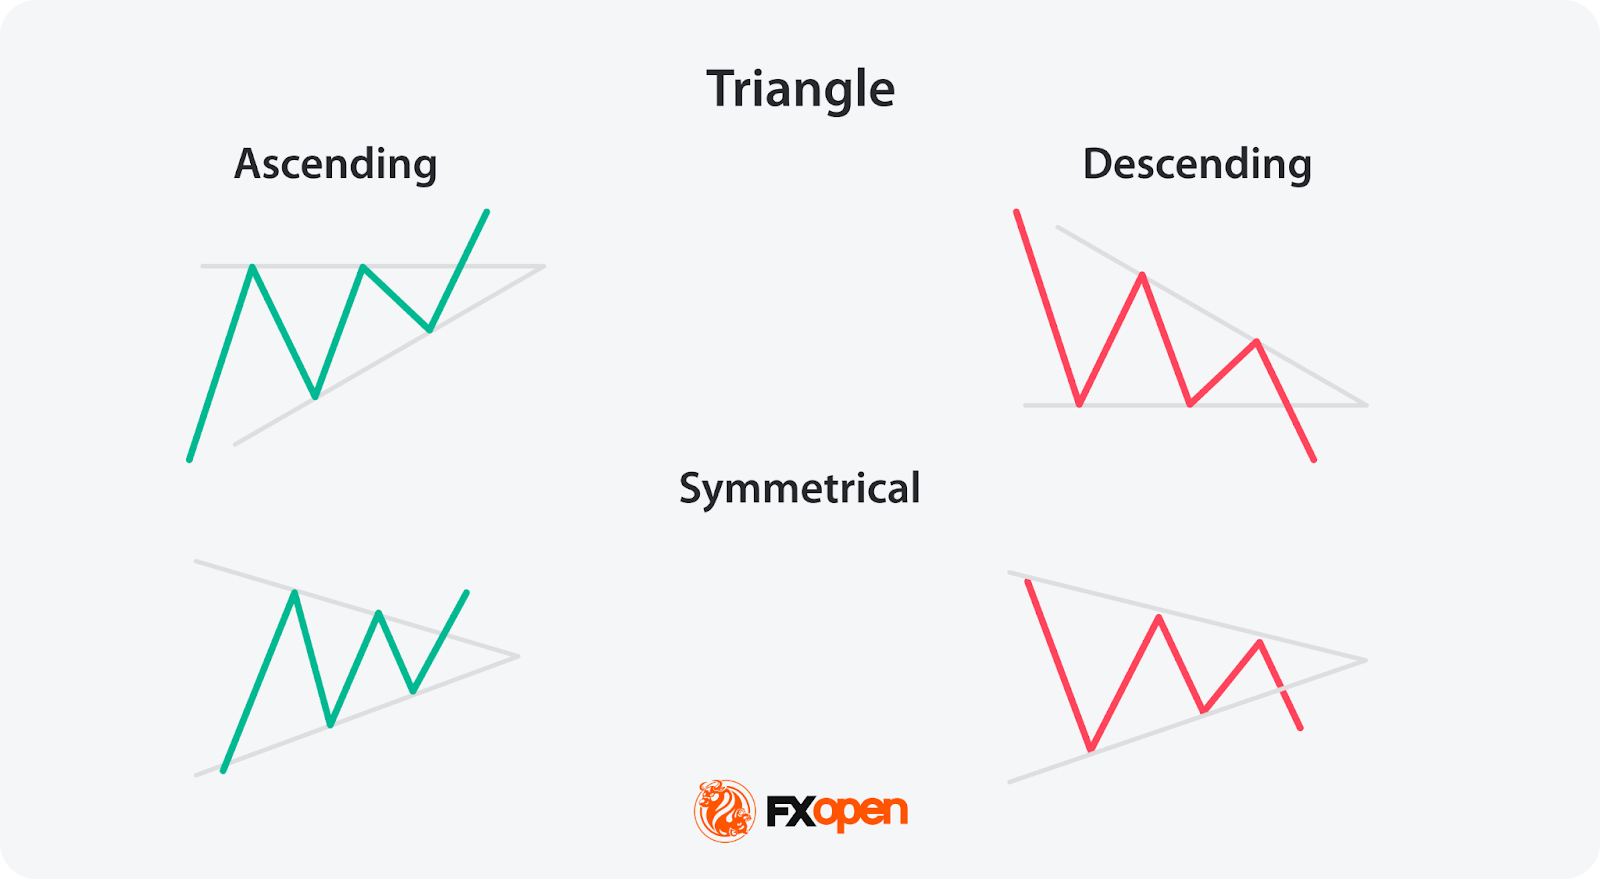
Symmetrical, ascending, and descending are three types of triangle patterns. Each of these patterns reflects a different market sentiment, with symmetrical triangles showing indecision, ascending triangles suggesting a bullish bias, and descending triangles hinting at bearish momentum. These formations are considered useful because they may help traders spot potential breakouts, where the price might move sharply up or down after a period of consolidation.
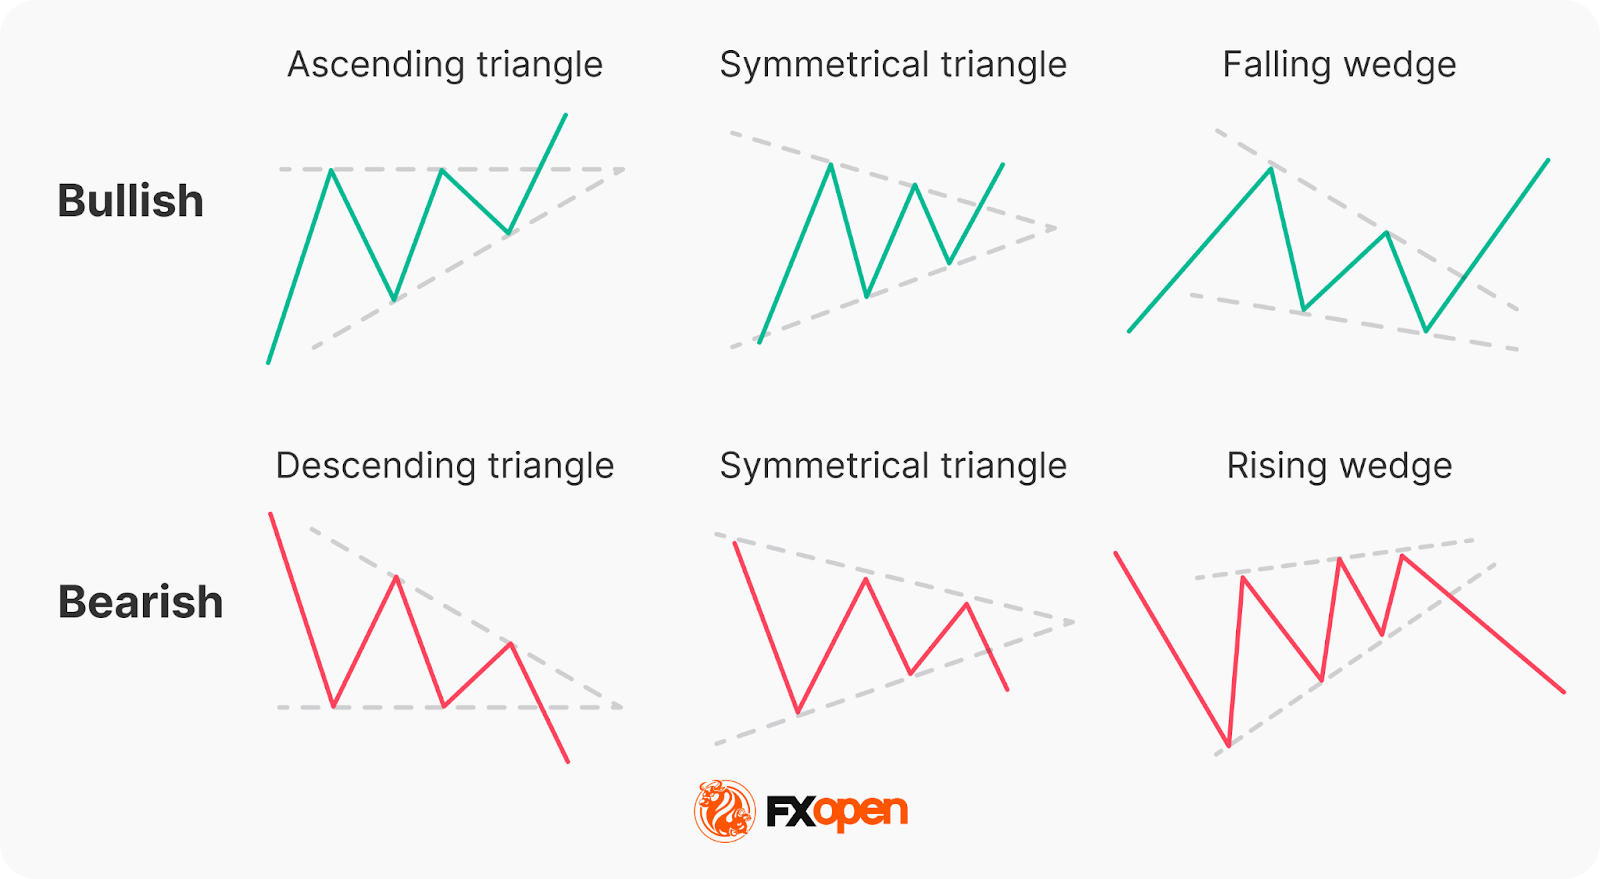
It’s important to note that triangles and wedge patterns are similar but not the same. Both patterns involve converging trendlines, but wedges tend to slope upward or downward. Triangles, on the other hand, either feature one horizontal trendline and a sloping trendline or two sloping trendlines at roughly the same angle.
Below, we’ll cover the three triangle types. If you’d like to follow along, consider heading over to FXOpen’s TickTrader platform to get started with real-time charts.
Symmetrical Triangle
The symmetrical triangle is a popular chart pattern that shows up when the price of an asset starts consolidating within a tighter range. Unlike other triangle patterns, it doesn’t lean heavily in either direction—bullish or bearish—making it a neutral signal. It forms when buyers and sellers are in a bit of a standoff, with no clear trend in sight. However, this period of indecision often leads to a significant move once the price breaks out of the pattern.
What Does It Look Like?
- Two converging trendlines;
- One sloping down from the highs (resistance);
- One sloping up from the lows (support);
- The price oscillates between these two lines, forming lower highs and higher lows;
- The formation narrows as the lines get closer together, creating a point of breakout.
What Does It Indicate?
A symmetrical triangle pattern indicates a period of indecision in the market. Buyers and sellers are evenly matched, causing the price to move within a narrowing range. As it gets smaller, the pressure builds, and the price is likely to break out either up or down. Since the formation is neutral, the breakout could occur in either direction, and traders wait for this moment to see where the market is heading.
How Do Traders Use It?
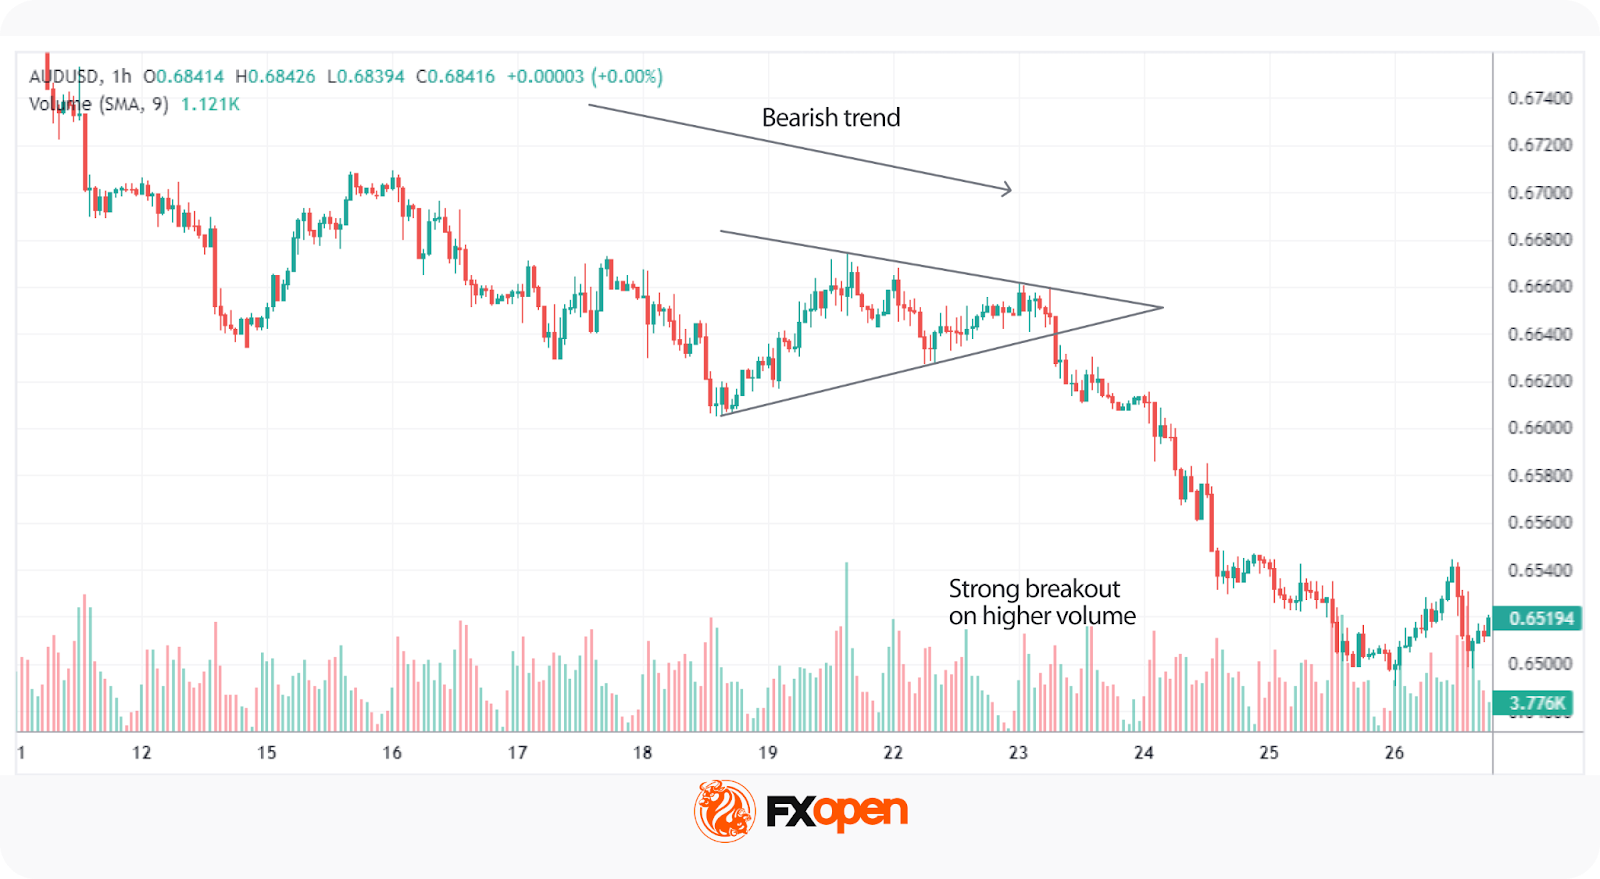
Traders typically watch for a breakout from the symmetrical triangle to signal the next significant price movement. They often look for an increase in trading volume alongside the breakout, as this can confirm the strength of the move. In most cases, it’s used as a signal for potential price continuation. However, some traders see it as a reversal indicator, depending on what the preceding trend looks like.
Ascending Triangle
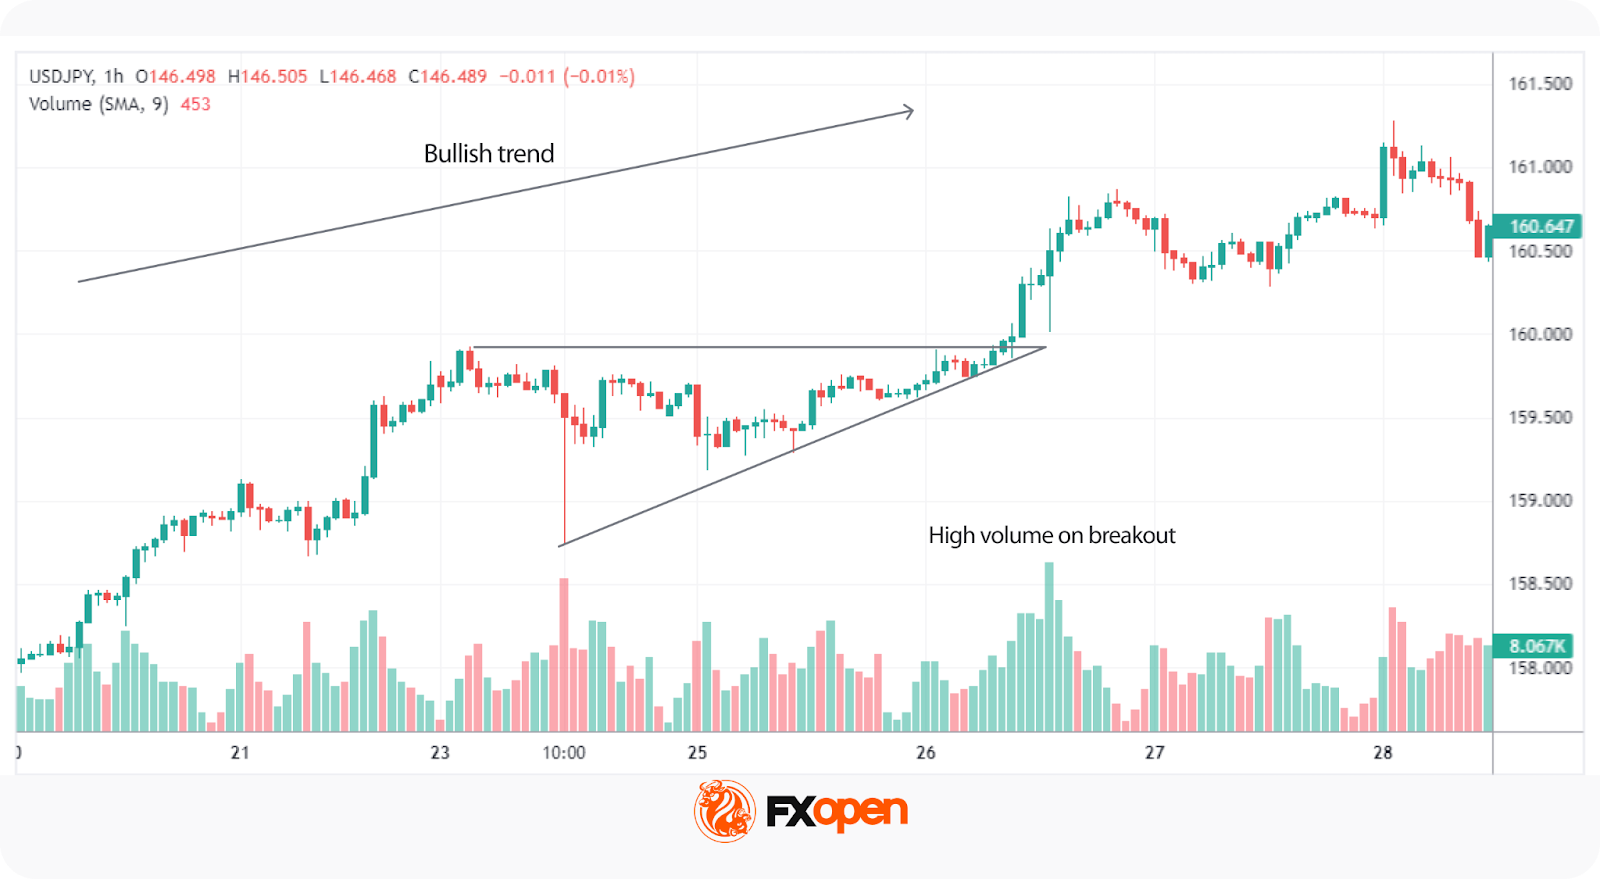
An ascending triangle is a bullish triangle pattern that’s often looked for when analysing potential price breakouts. It usually forms during an uptrend but may also appear in a downtrend. It suggests that buyers are becoming more aggressive, while sellers are struggling to push the price lower, creating a situation where the market might break upwards.
What Does It Look Like?
- A horizontal resistance line at the top (price struggles to break above this level);
- A rising trendline at the bottom, connecting higher lows (buyers are stepping in earlier each time);
- The price moves between these two lines, creating a triangle shape;
- The formation narrows over time, putting pressure on the resistance level.
What Does It Indicate?
An ascending triangle pattern signals that buyers are gaining control. While the price keeps hitting a ceiling (resistance), the higher lows show that the market’s buying pressure is increasing. This often leads to a breakout above the resistance level, where the price can make a significant upward move. Traders usually see this formation as a sign that the market is primed for a continuation of the current uptrend. However, sometimes it can appear in a downtrend and signal a trend reversal.
How Do Traders Use It?
Traders typically use the ascending triangle to spot potential breakouts above the resistance level. When the price finally moves and closes above this line, it’s seen as confirmation that the upward trend is continuing. Many also pay close attention to the trading volume during this breakout—rising volume can confirm that the breakout is genuine.
In some cases, the price may break through the resistance quickly, while in others, it could take time before the upward move happens. There may also be false breakouts before the true bullish move occurs, with the price typically closing below resistance.
Descending Triangle
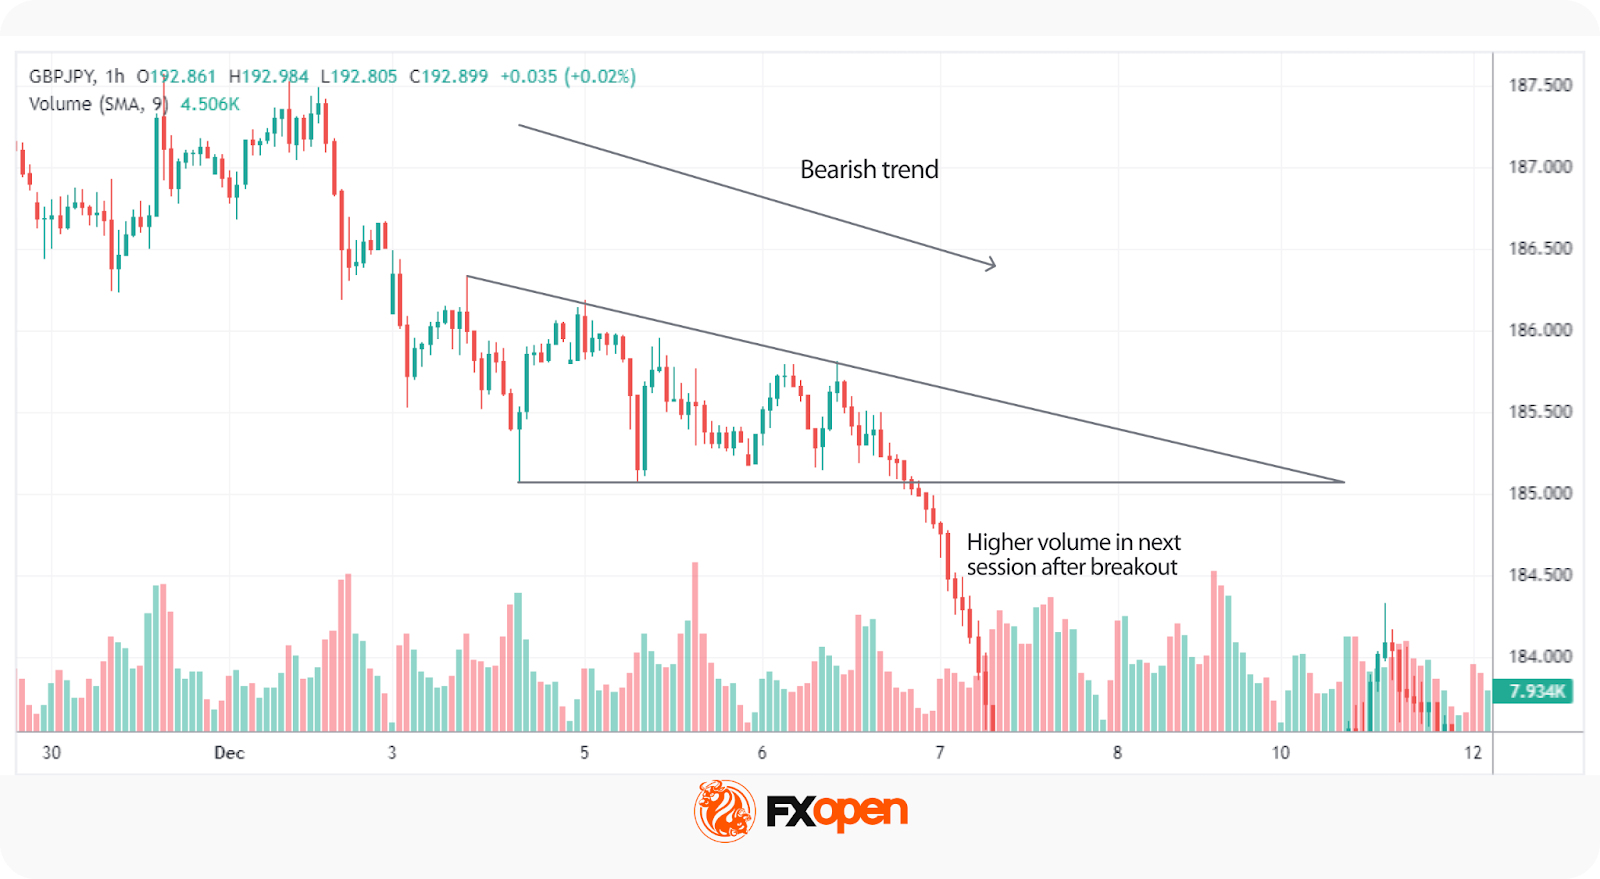
A descending triangle is a bearish chart pattern that signals potential downward movement in the market. It typically forms during a downtrend but can also appear in an uptrend. It shows that sellers are becoming more dominant, while buyers are struggling to push the price higher, which could lead to a breakdown below a key support level.
What Does It Look Like?
- A horizontal support line at the bottom (price struggles to break below this level);
- A descending trendline at the top, connecting lower highs (sellers are pushing the price down);
- The price moves between these two lines, creating a triangle shape;
- The formation narrows over time, with the pressure building on the support level.
What Does It Indicate?
A descending triangle chart pattern suggests that sellers are in control. While the price holds at the support level, the series of lower highs shows that selling pressure is increasing. This often leads to a breakdown below the support line, where the price might experience a sharp decline. Traders see the formation as a bearish signal, indicating that the market could continue its downward trend.
How Do Traders Use It?
Traders typically use the descending triangle to identify potential breakdowns below the support level. When the price falls and closes below this line, it’s considered confirmation that the sellers have taken over and that further downside movement could follow.
Similar to other triangle patterns, it’s common to watch for a rise in trading volume during the breakdown, as it can confirm the strength of the move. It’s also possible to see false breakouts below the support level when the price closes back inside the pattern almost immediately.
How Traders Use Triangle Patterns in Technical Analysis
These patterns are just one piece of the puzzle in technical analysis, but they can offer us valuable insights when used correctly.
Triangle Pattern Trading: Entry, Stop Loss, and Profit Targets
Entry Points
Traders typically wait for a confirmed breakout from the triangle formation’s boundaries before entering a trade. For ascending triangles, this means watching for the price to break above the upper trendline (resistance), while for descending triangles, they look for a breakdown below the lower trendline (support). In a symmetrical triangle, the breakout may be in either direction, usually informed by the broader market trend.
The entry is often confirmed by a closing candle above or below these key levels to reduce the risk of false breakouts.
Stop-Loss Placement
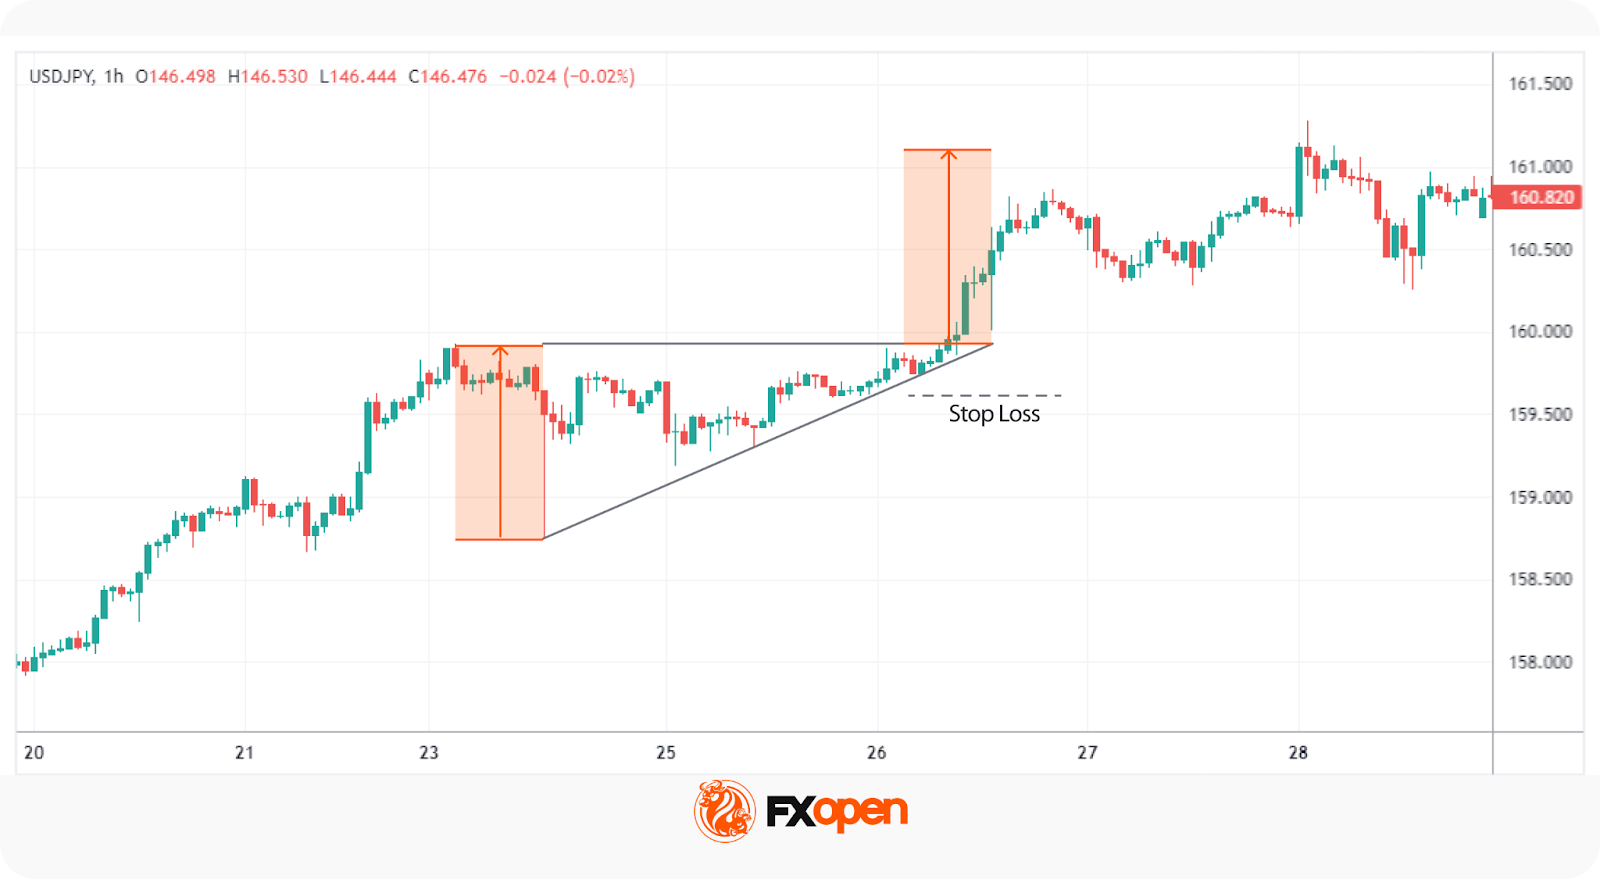
Stop-loss orders are crucial here. For ascending triangles, stop losses might be placed just below the last swing low, while for descending triangles, they might be set just above the recent swing high. In the case of symmetrical triangles, traders often place the stop-loss just outside the formation’s apex.
Profit Targets
To set profit targets, traders typically use the triangle's height (the distance between the highest and lowest points). This height is then projected from the breakout point, offering a realistic target for the trade. For example, if a triangle stock pattern’s height is $10 and the breakout occurs at $50, the target would be $60 for a bullish move.
Combining with Market Context
Triangles might become more reliable when considered in the context of the broader market environment. Traders don’t just look at the pattern in isolation—they analyse the prevailing trend, market sentiment, and even macroeconomic factors to gauge whether a breakout aligns with the larger market movement. For instance, an ascending formation in a strong uptrend adds confidence to the idea of a bullish breakout.
Using Other Indicators for Confirmation
While triangles provide a useful framework, they’re usually combined with other technical indicators for confirmation. Traders often align triangles with volumes, moving averages, or momentum indicators to assess whether the breakout has strong support behind it. For instance, a breakout confirmed by high volume or a moving average crossover might add confluence to the trade.
Limitations and Considerations of Triangle Patterns
Triangles are useful tools in technical analysis, but they come with limitations and important considerations. While they can signal potential breakouts, traders approach them cautiously.
- False Breakouts: Triangles often experience false breakouts, where the price briefly moves beyond the trendline but quickly reverses. This may trap traders in unfavourable positions.
- Subjectivity: These formations are open to interpretation. Different people may draw trendlines slightly differently, leading to varying conclusions about where the breakout occurs.
- Need for Confirmation: Relying solely on patterns can be risky. They may be combined with other indicators, such as volume or moving averages, to confirm the trend direction.
- Market Conditions: In volatile or news-driven markets, chart patterns may not behave as expected, reducing their reliability. They may provide false signals or lose significance in these situations.
The Bottom Line
Triangle chart patterns are popular tools among those looking to analyse market movements and potential breakouts. Whether it’s a symmetrical, ascending, or descending triangle, these patterns provide valuable insights into price consolidation and future trends. While no pattern guarantees accurate signals, combining triangles with other indicators may support traders in market analysis.
If you want to put your knowledge into practice, you may consider opening an FXOpen account to explore chart patterns in more than 700 live markets and trade with tight spreads and low commissions.
FAQ
What Is a Triangle Chart Pattern?
A triangle is a chart pattern in technical analysis that forms when the price of an asset moves between converging trendlines, creating a triangle shape on a price chart. They typically signal a period of consolidation before a strong potential breakout in price.
What Are the Types of Triangles?
There are three main types of triangles in chart patterns: symmetrical, ascending, and descending. Symmetrical triangles indicate indecision in the market while ascending triangles are often bullish, and descending triangles tend to be bearish.
How May a Triangle Pattern Be Traded?
Traders typically wait for a confirmed breakout from the triangle’s trendlines. According to theory, entry points are based on a breakout above resistance or below support, with stop-loss orders placed just outside the triangle. Profit targets are often set based on the height (the distance between the highest and lowest points) of the pattern.
What Is the Triangle Pattern Strategy?
The triangle pattern strategy involves waiting for a breakout and using the formation’s height to set profit targets. It’s combined with tools like volume, moving averages, and momentum indicators to confirm the move and avoid false breakouts.
Is the Triangle Pattern Bullish or Bearish?
They can be both bullish and bearish. Ascending triangles are generally seen before a bullish movement, descending triangles are bearish, and symmetrical triangles can be either.
This article represents the opinion of the Companies operating under the FXOpen brand only. It is not to be construed as an offer, solicitation, or recommendation with respect to products and services provided by the Companies operating under the FXOpen brand, nor is it to be considered financial advice.
Stay ahead of the market!
Subscribe now to our mailing list and receive the latest market news and insights delivered directly to your inbox.


Latest articles

Tesla (TSLA) Shares Surge Following Musk’s Announcements
According to the chart, Tesla (TSLA) shares had been under significant pressure since the start of 2026: from their December high, they had lost around 25% of their value. The main bearish drivers included:
→ Intense competition from Chinese automakers, particularly

XTI/USD Analysis: WTI Oil Prices Under Pressure from Trump’s Statements
Yesterday, following a false bullish breakout above the psychological $100 level, WTI crude prices fell sharply towards the $85 area. The primary driver of this rapid decline was comments made by the US President.
According to Donald Trump:
→ the United
