


FXOpen

Candlestick chart patterns are essential tools in technical analysis, providing insights into market sentiment and potential price movements. This article delves into the most popular types of candlestick patterns, categorising them into reversal and continuation formations.
Each pattern is explained with clear, specific details and application in real-world trading scenarios. Readers can follow along with real-time charts in FXOpen’s free TickTrader platform.
Bullish Reversal Candlestick Patterns
Candlestick patterns are key instruments for analysing market conditions and making informed trading decisions. However, traders should remember that candlestick formations don’t provide specific entry and take-profit points. The most common traders’ approach is to enter the market once the pattern’s signal is confirmed with the following candles or indicators, including trend indicators like moving averages and momentum oscillators like MACD and RSI. For profit targets, traders commonly use the nearest support/resistance levels and the most significant swing points.
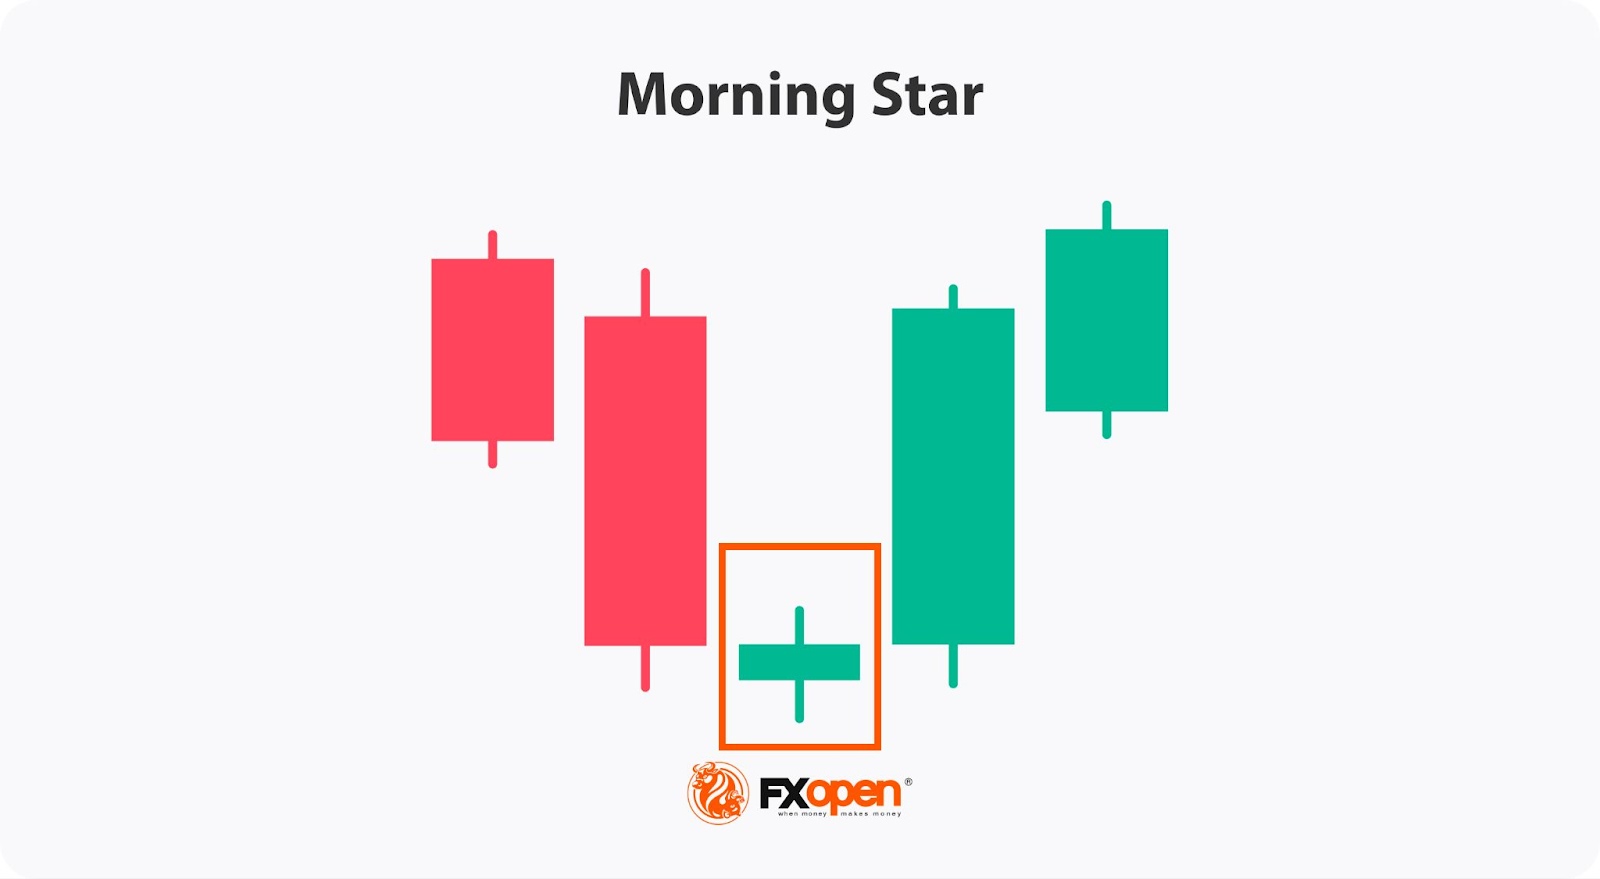
Morning Star
The Morning Star is a bullish reversal pattern that appears after a downtrend, signalling a potential rise in prices. It comprises three candles: the first is a long bearish candle, indicating strong selling pressure. The second is a small-bodied candle, which can be bullish or bearish, showing indecision in the market. Although, according to the theory, the second candle should form with a gap up and down, gaps aren’t common on forex charts. Therefore, this condition can be skipped. The third is a long bullish candlestick, confirming the reversal.
Traders often look for the third candle to close above the midpoint of the first candle to validate the pattern. This suggests that the selling momentum has weakened, and buyers are gaining control. A stop-loss level is typically placed below the second candlestick’s low.
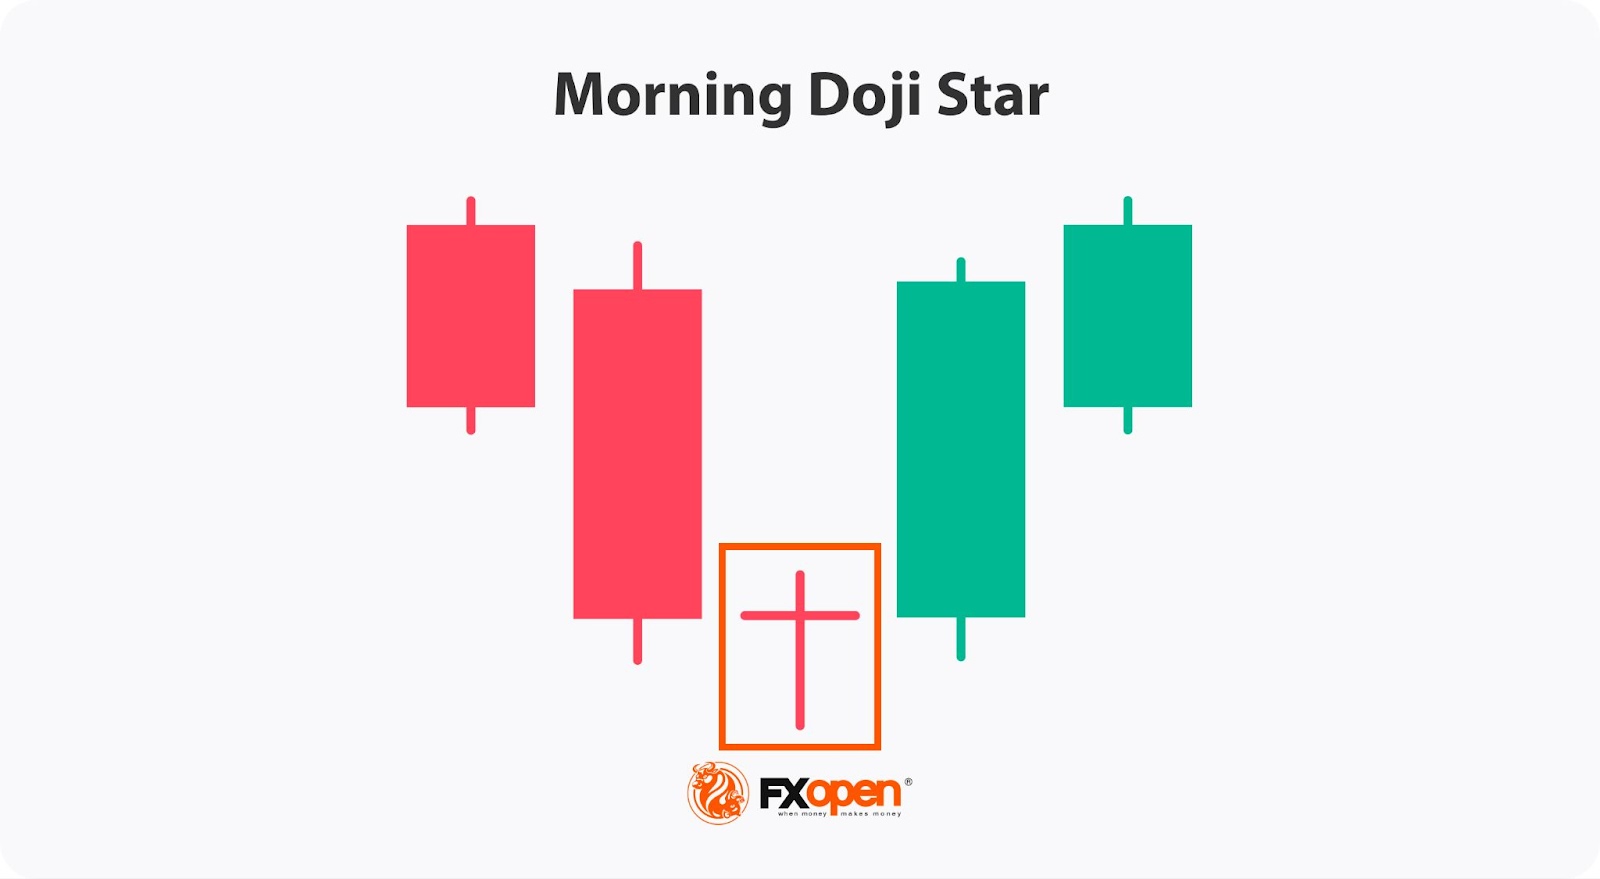
Morning Doji Star
The Morning Doji Star is a bullish reversal pattern, indicating a potential shift in market sentiment. It comprises three candles: the first is a long bearish candlestick, confirming the downtrend. The second candle is a Doji, representing indecision in the market, with its open and close prices nearly identical. The third candle is a strong bullish candlestick that closes above the midpoint of the first bearish candle.
This formation signals a potential reversal as buying pressure overcomes selling pressure. Traders often place a stop loss below the Doji's low to potentially manage risk. The Morning Doji Star is considered a stronger signal than the Morning Star due to the presence of the Doji that reflects market indecision.
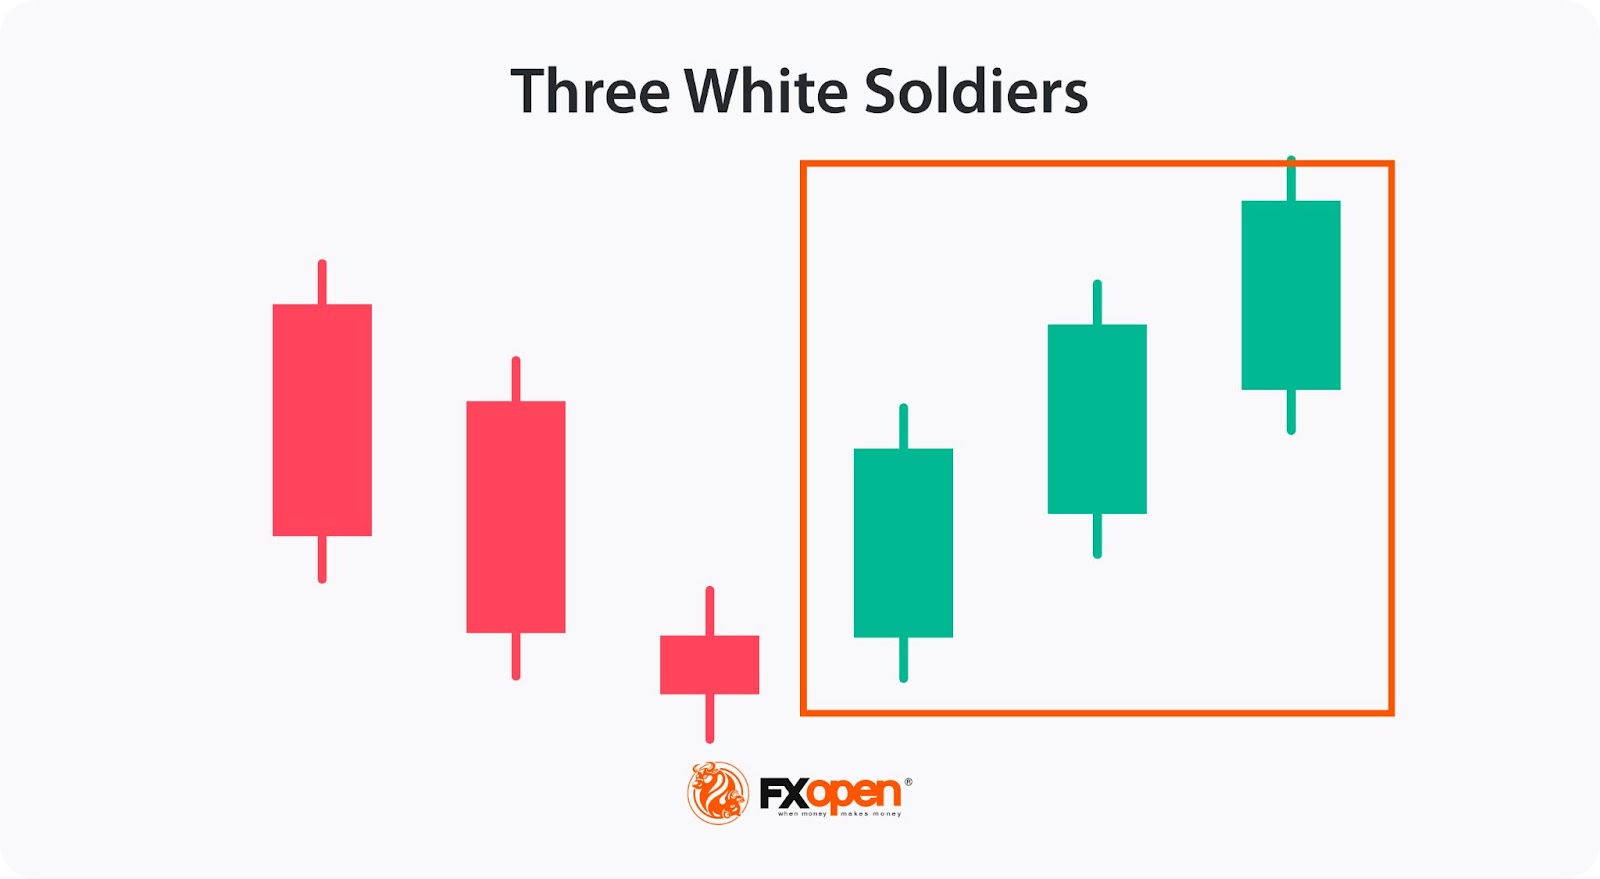
Three White Soldiers
The Three White Soldiers pattern is a bullish reversal signal that typically forms after a downtrend. This formation signals increasing market confidence and potential further price advances.
It consists of three consecutive long bullish candles, each opening within the previous candle's body and closing progressively higher. This pattern demonstrates a sustained shift from bearish to bullish sentiment. Each candlestick should have a small or nonexistent upper wick, highlighting persistent buying interest. The pattern may be more reliable when accompanied by high trading volume.
Traders interpret this as a strong indication of the upward momentum and often place a stop loss below the first candlestick.
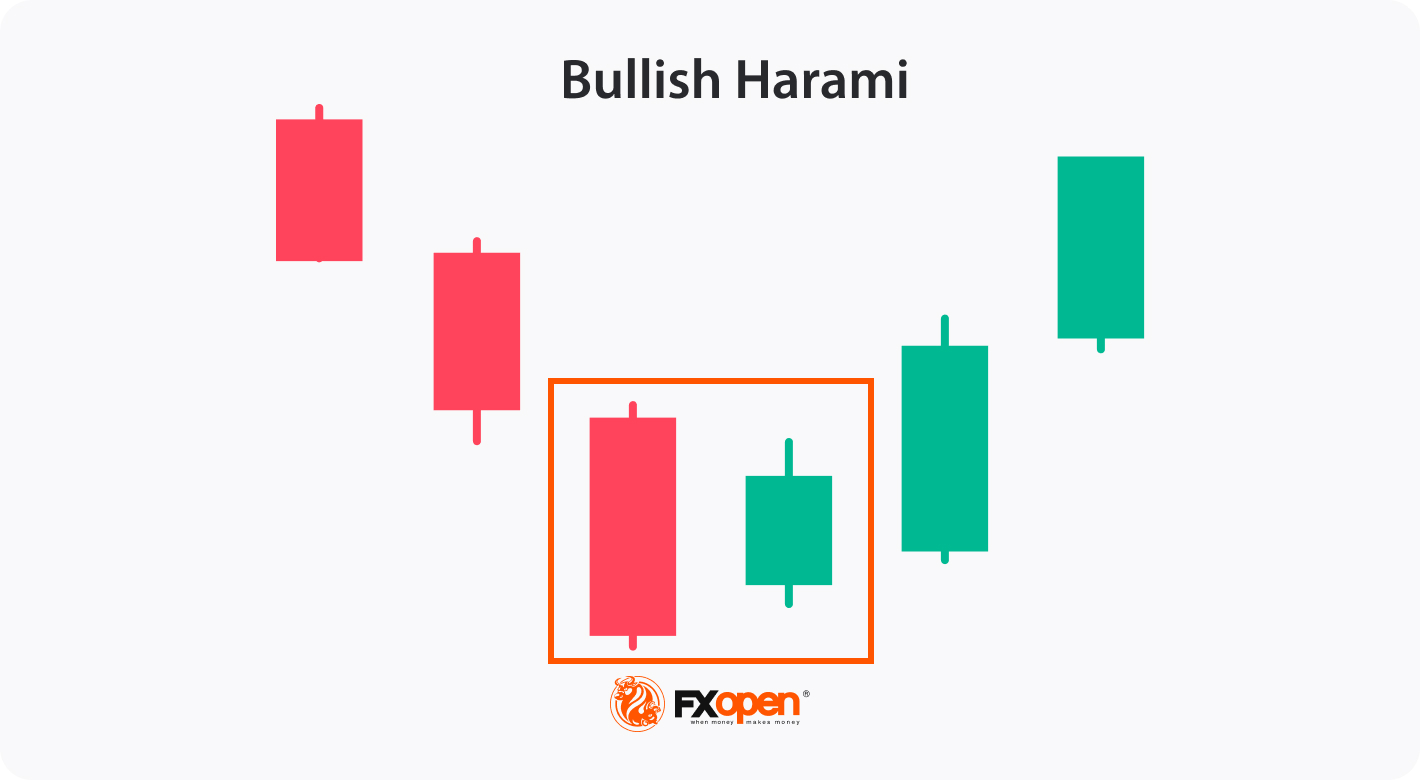
Bullish Harami
The Bullish Harami is a candlestick pattern that signals a potential upward movement after a downtrend. It consists of two candles: the first is a long bearish candlestick, confirming the downward movement. The second candle is a smaller bullish one that is entirely contained within the body of the first candle.
This formation indicates waning selling momentum and the possible emergence of buying interest. The smaller second candlestick suggests a pause in the downtrend and hints at a shift in market sentiment. Traders might place a stop loss below the first candlestick’s low to potentially manage their risk.
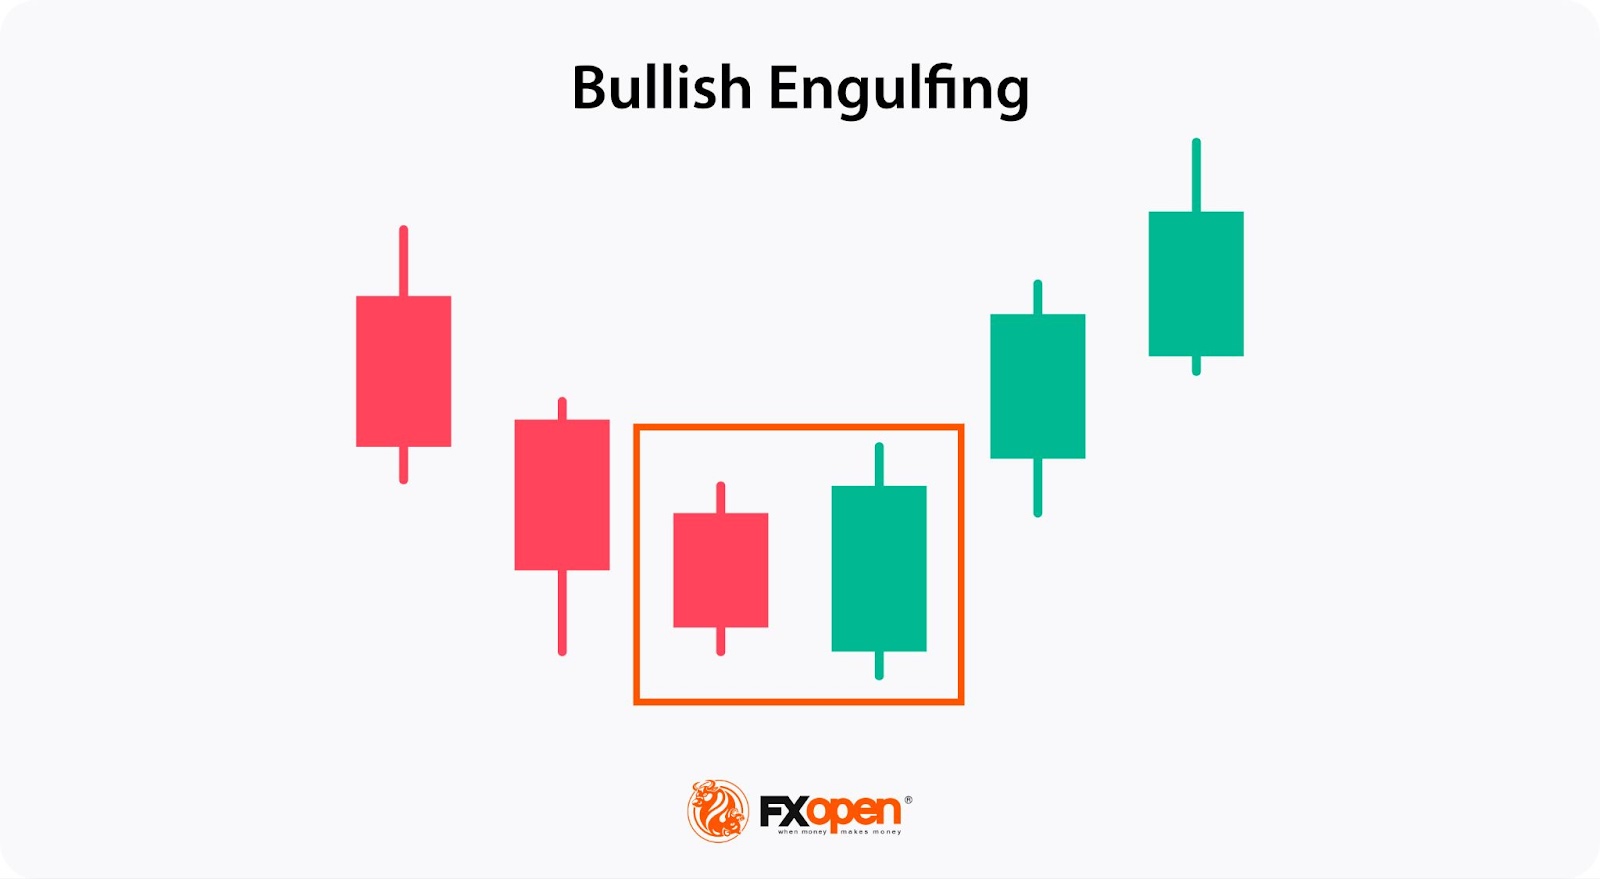
Bullish Engulfing
The Bullish Engulfing pattern is a strong reversal signal that appears after a downtrend, indicating a shift towards bullish sentiment. It comprises two candles: first, a small bearish candlestick, followed by a larger bullish candlestick that completely engulfs the first one. This pattern suggests a significant change in market dynamics, as buying pressure overwhelms the prior selling pressure. Placing a stop loss below the low of the bullish engulfing candle can help potentially manage risk.
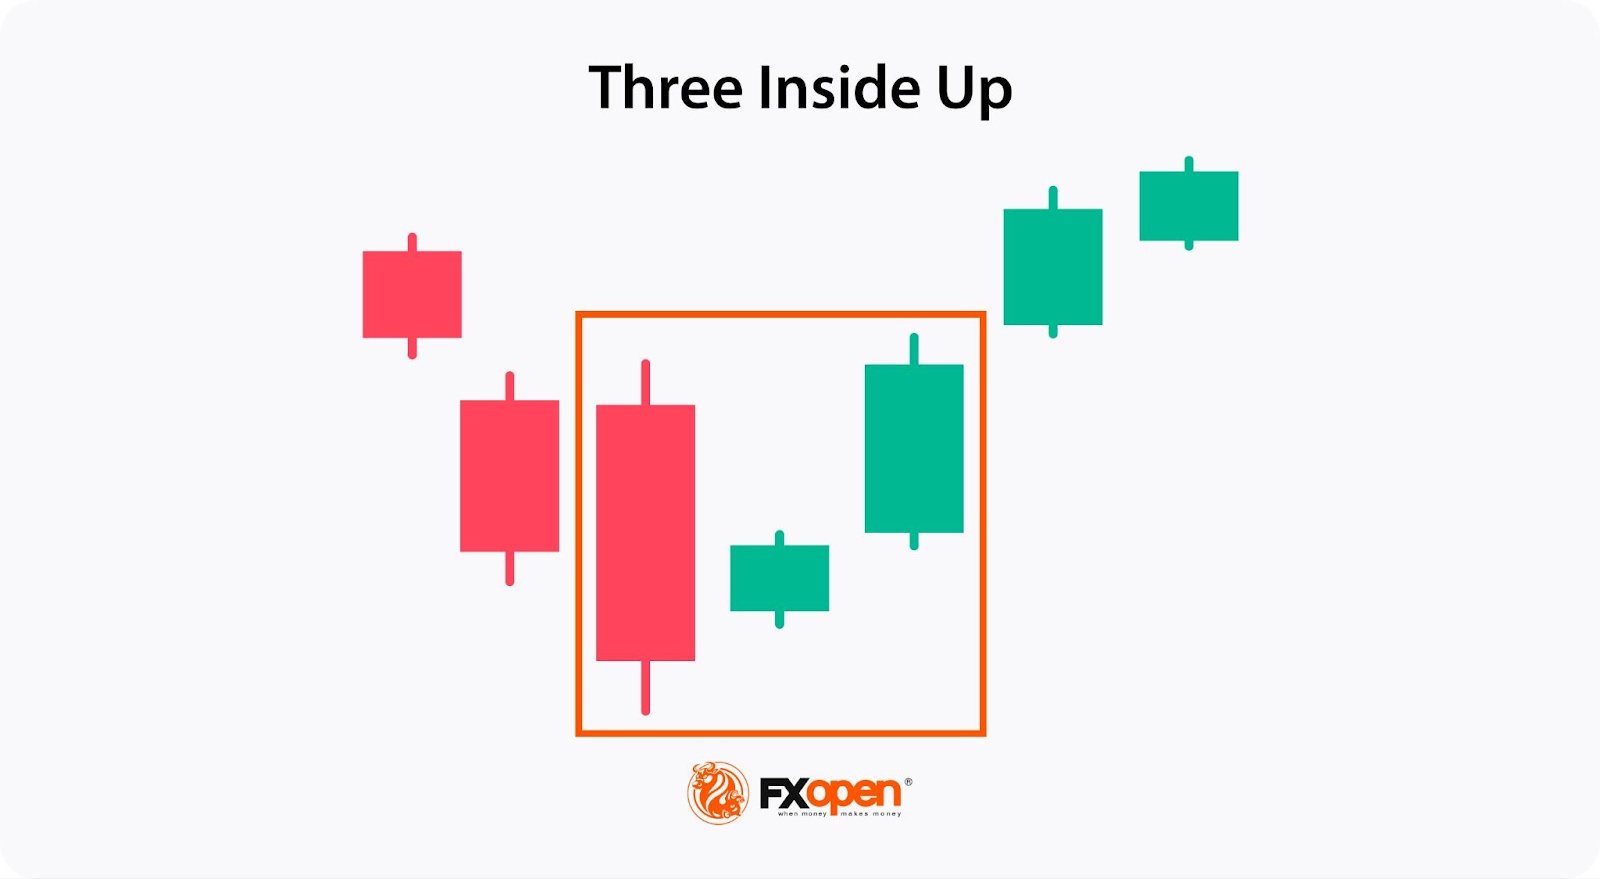
Three Inside Up
The Three Inside Up pattern signals a growing confidence among buyers, hinting at a potential further upward price movement. It consists of three candlesticks: the first is a long bearish candle, followed by a smaller bullish candle that forms within the first candle's body. Although it’s a common condition, some traders believe that if the second candle closes above half of the bearish candle’s body, the reversal signal is stronger. The third candle is bullish, closing beyond the high of the initial candlestick.
This sequence suggests a weakening of the downtrend and increasing buying interest. A stop loss is commonly placed below the low of the first candlestick.
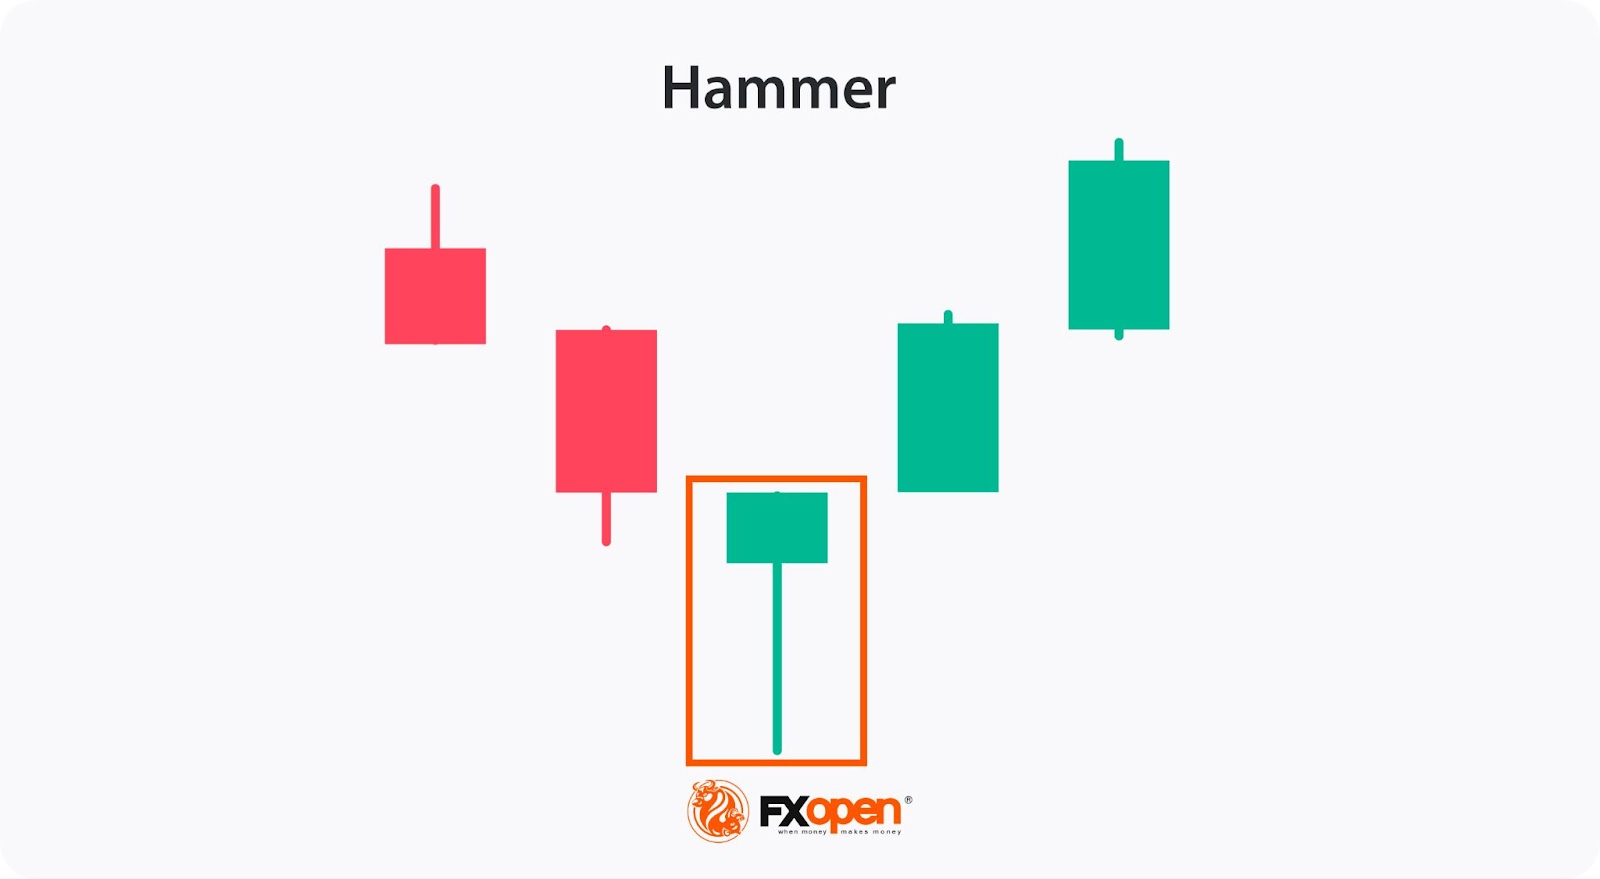
Hammer
The Hammer formation is significant as it highlights a potential turning point where buyers may start to dominate, suggesting a possible upward price movement. It consists of a single candle with a small body at the top and a long lower wick, showing that sellers drove prices down, but buyers managed to push prices back up near the opening level. This shift in momentum signals weakening selling pressure and potential buyer strength. It doesn’t matter whether the candle is bearish or bullish. However, if it’s bullish, the signal is expected to be stronger.
Traders look for confirmation with a subsequent bullish candlestick before considering it a valid reversal. A common risk management strategy is to place a stop loss below the Hammer's low.
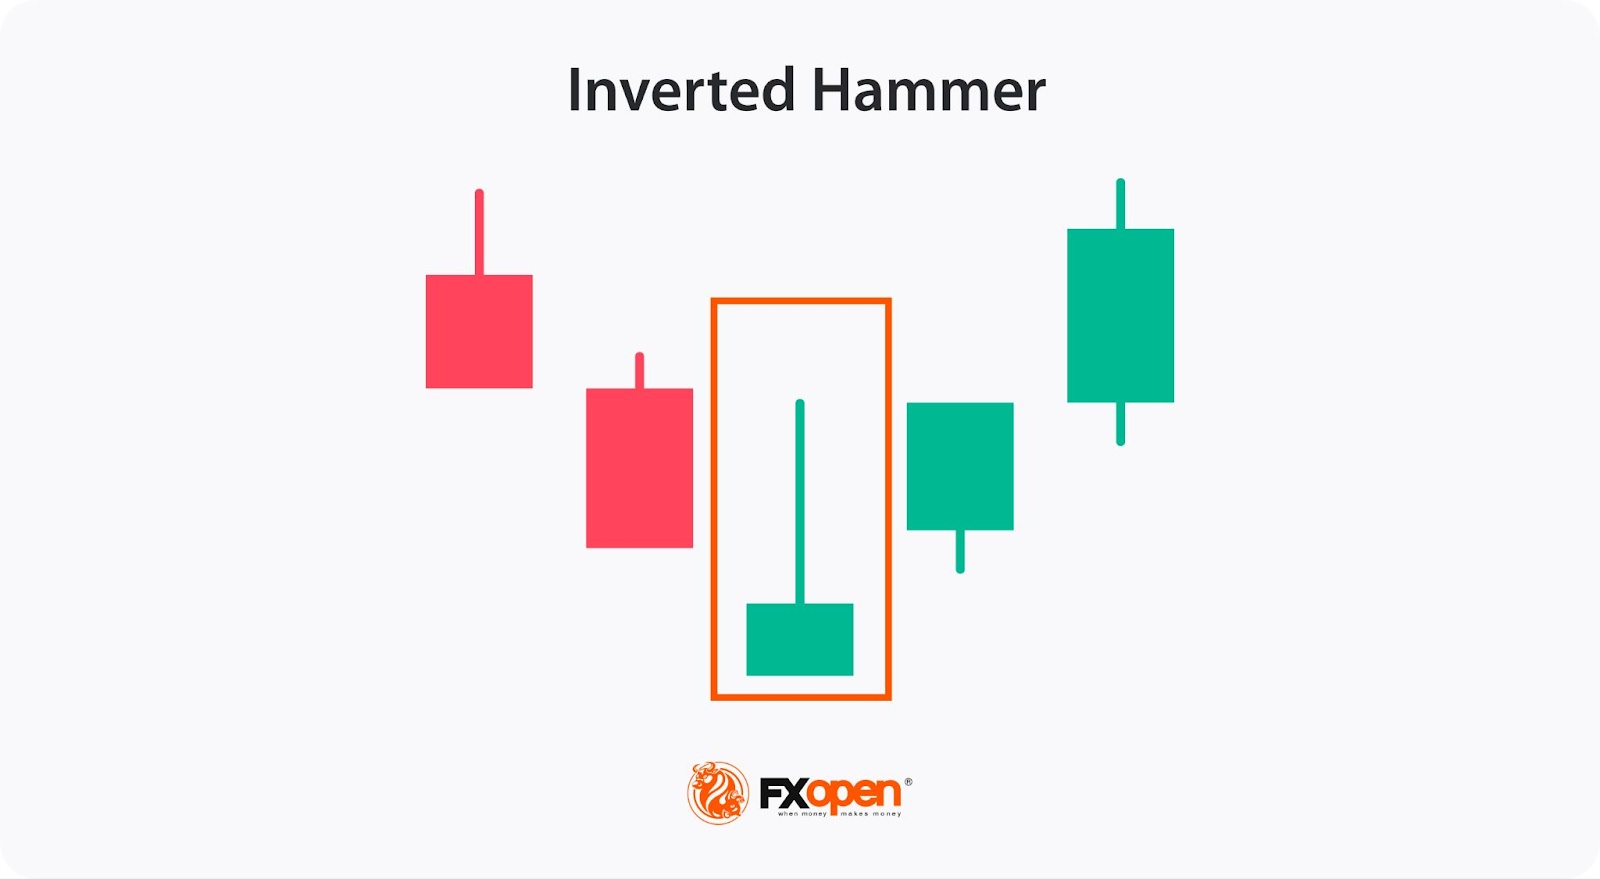
Inverted Hammer
The Inverted Hammer is valued for signalling a possible change in market sentiment from bearish to bullish and is related to the regular Hammer pattern.
This single-candle pattern features a small body with a long upper wick and little to no lower wick. The long upper wick indicates that buyers attempted to push prices higher but faced resistance. However, the close near the opening price signifies that selling pressure is weakening. The candle can be bullish or bearish, but a bullish candle gives a stronger trend reversal signal.
To confirm the reversal, traders look for a subsequent bullish candlestick. A common strategy is to place a stop loss below the low of the Inverted Hammer to potentially manage risk.
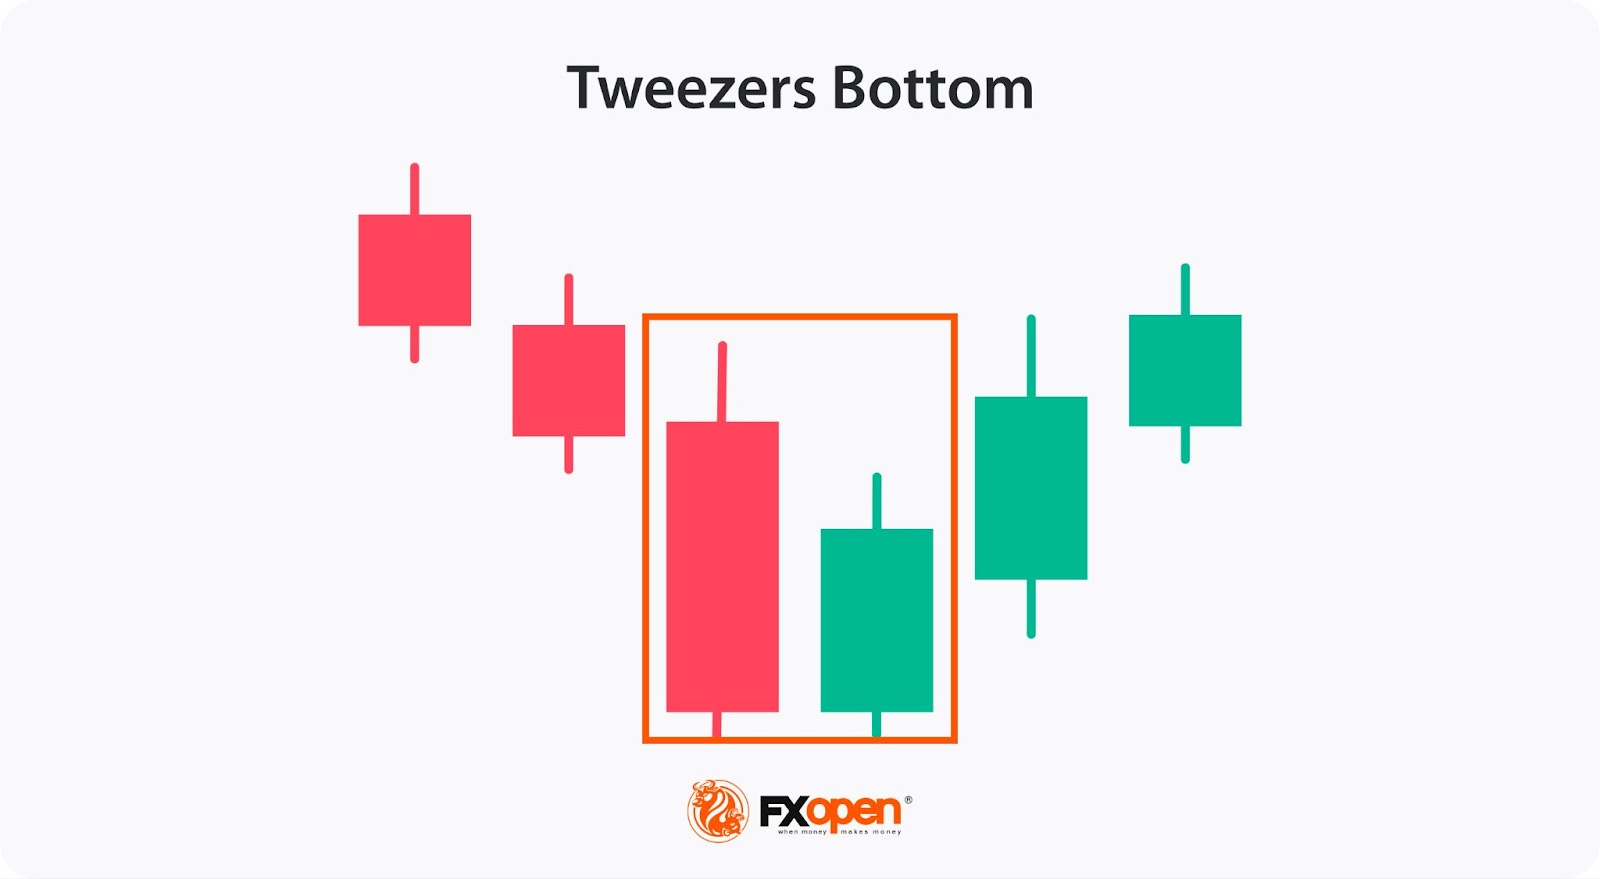
Tweezer Bottom
The Tweezer Bottom is a bullish reversal pattern that signals a potential end of a downtrend.
It consists of two consecutive candles with roughly matching lows following a period of declining prices. The first candlestick is bearish, showing ongoing selling pressure, while the second candle is bullish, indicating a strong rejection of lower prices.
This formation highlights a shift in market sentiment as buyers step in at the same support level, suggesting increased demand. Traders often place a stop loss below the matching lows. The Tweezer Bottom pattern is significant because it shows a clear level where buying interest has consistently emerged.
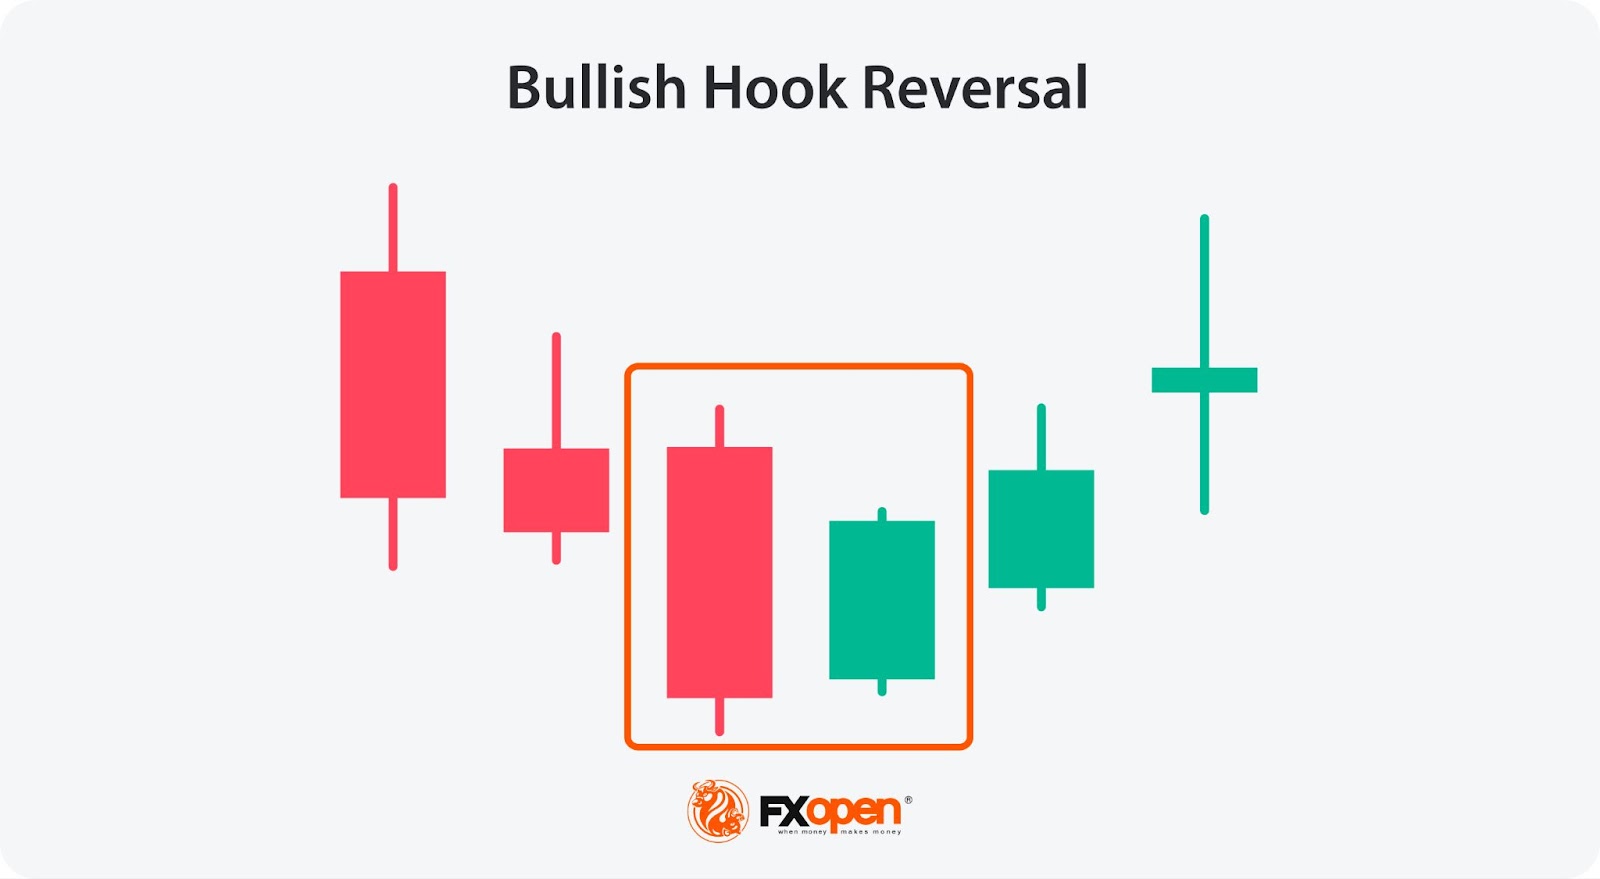
Hook Reversal
The Hook Reversal pattern signals a potential shift in market direction, occurring after a sustained downward price movement.
In a bullish Hook Reversal, the market experiences a strong downtrend followed by a relatively large bearish candlestick and then a bullish candlestick that opens higher and closes near or above the previous period's high.
This formation indicates that selling momentum is weakening, and buying interest is gaining strength. Traders commonly place a stop loss below the recent low.
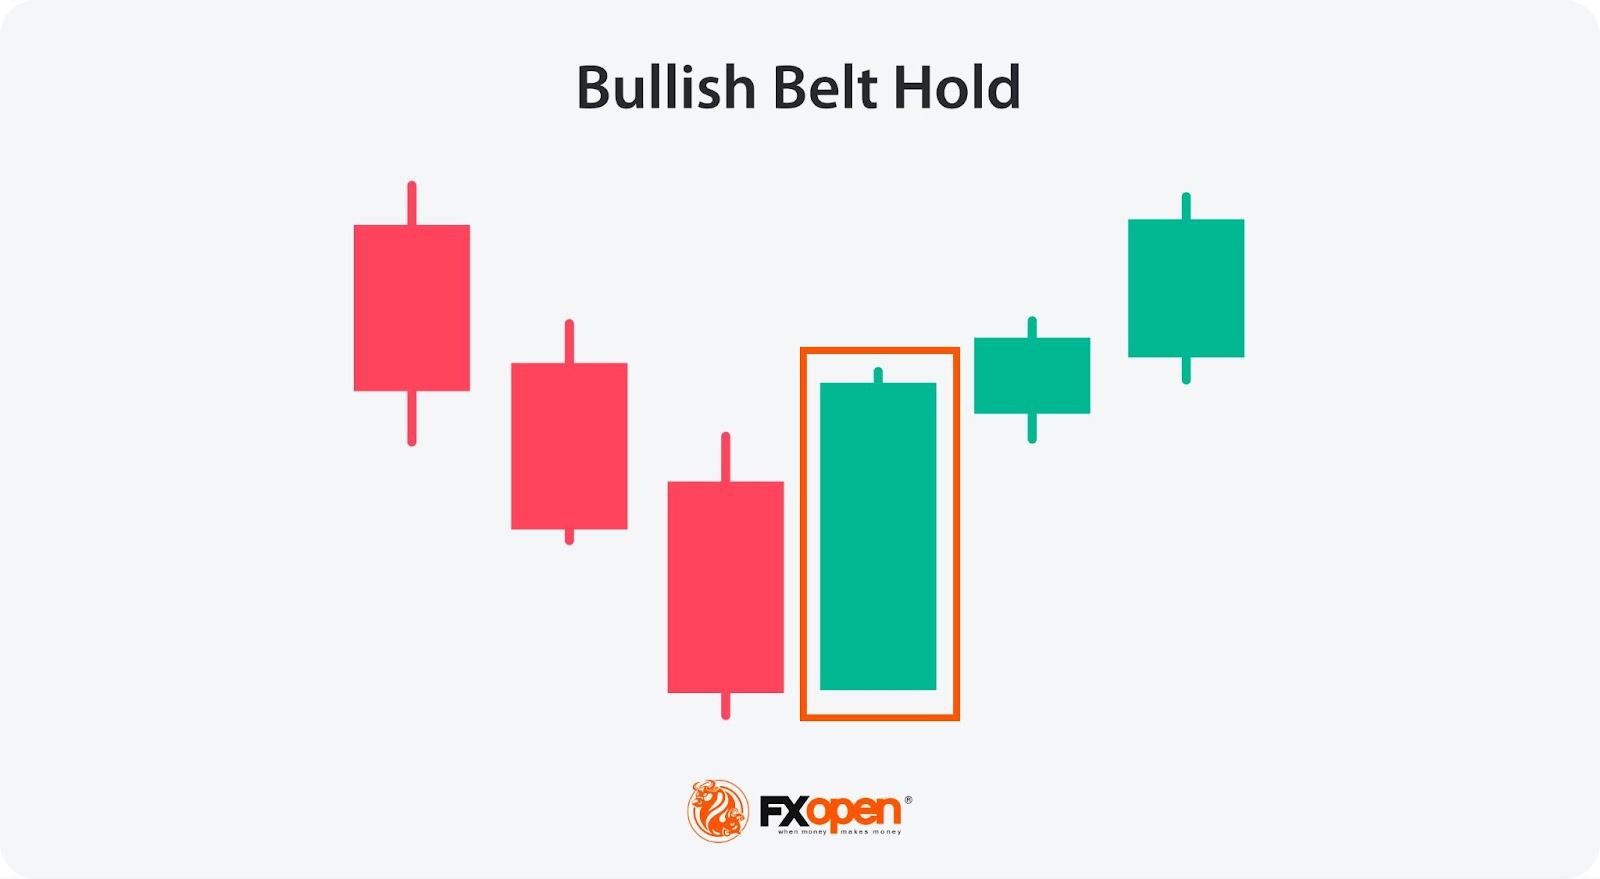
Belt Hold
The Belt Hold is significant because it demonstrates a decisive change in market dynamics, suggesting increased buying activity.
A bullish Belt Hold consists of a single bullish candle that opens at or near the previous bearish candle's close and closes much higher. It’s supposed to have little or no wicks. This sharp reversal reflects a strong shift in sentiment from sellers to buyers. A common strategy is to place a stop loss below the low of the Belt Hold candle.
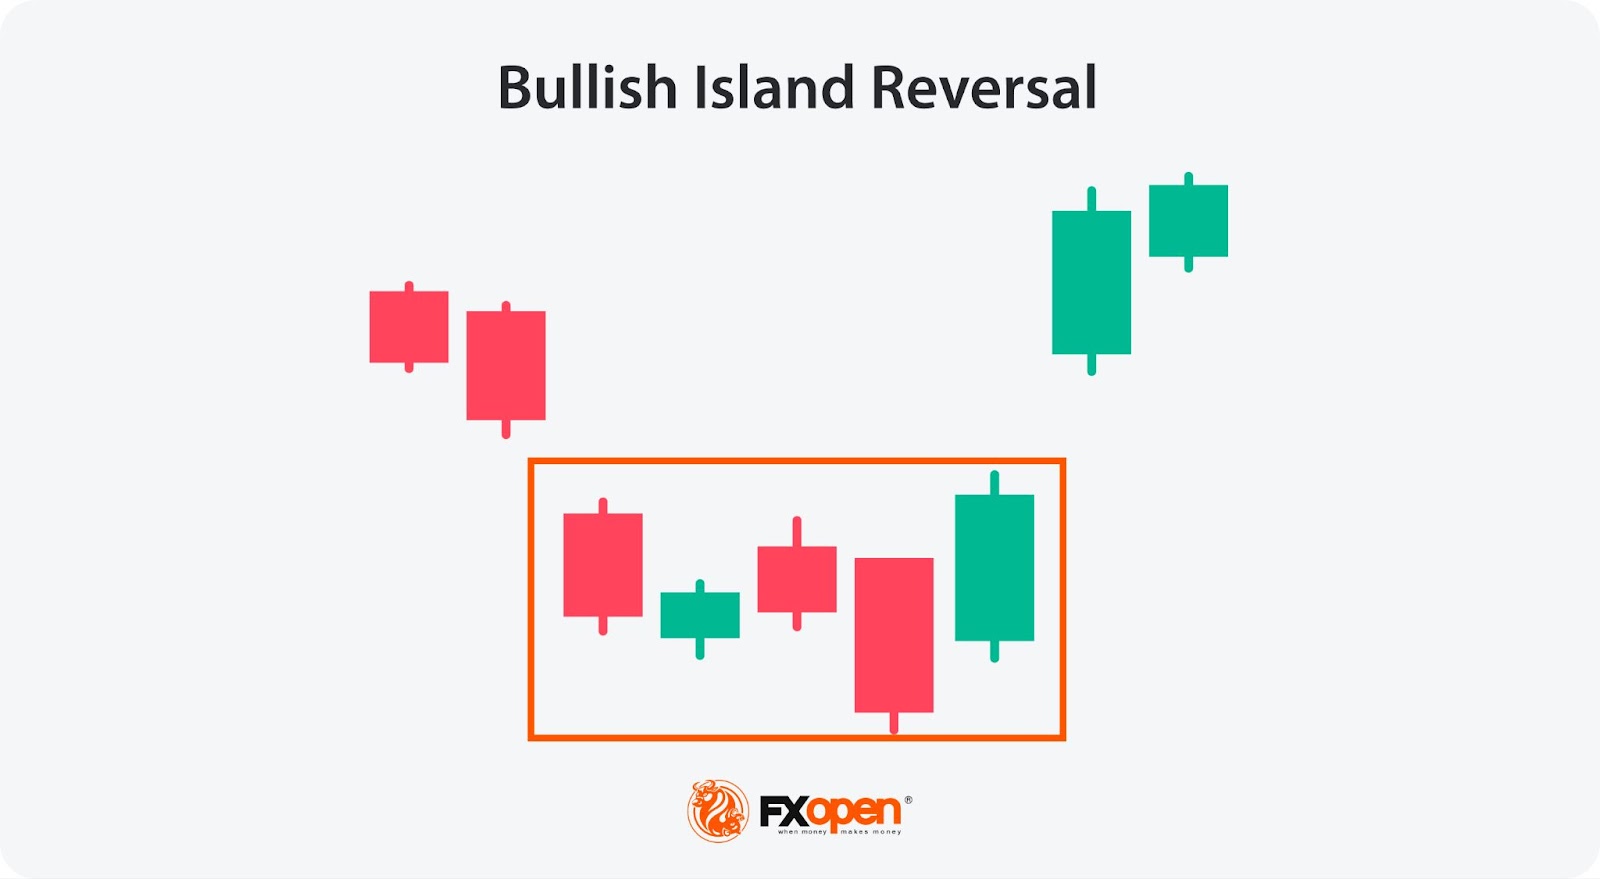
Island Reversal
The Island Reversal is a strong reversal pattern characterised by a gap on either side of a small cluster of candlesticks. A bullish Island Reversal occurs after a prolonged downtrend.
The formation starts with a gap down, followed by a period of consolidation (the “Island”), and concludes with a gap up. This formation suggests that selling pressure has been exhausted, and buying interest is taking over. There is no specific number of candles in the pattern.
Traders view the gaps as significant as they highlight sudden shifts in market sentiment. A stop loss is often placed below the consolidation area's low.
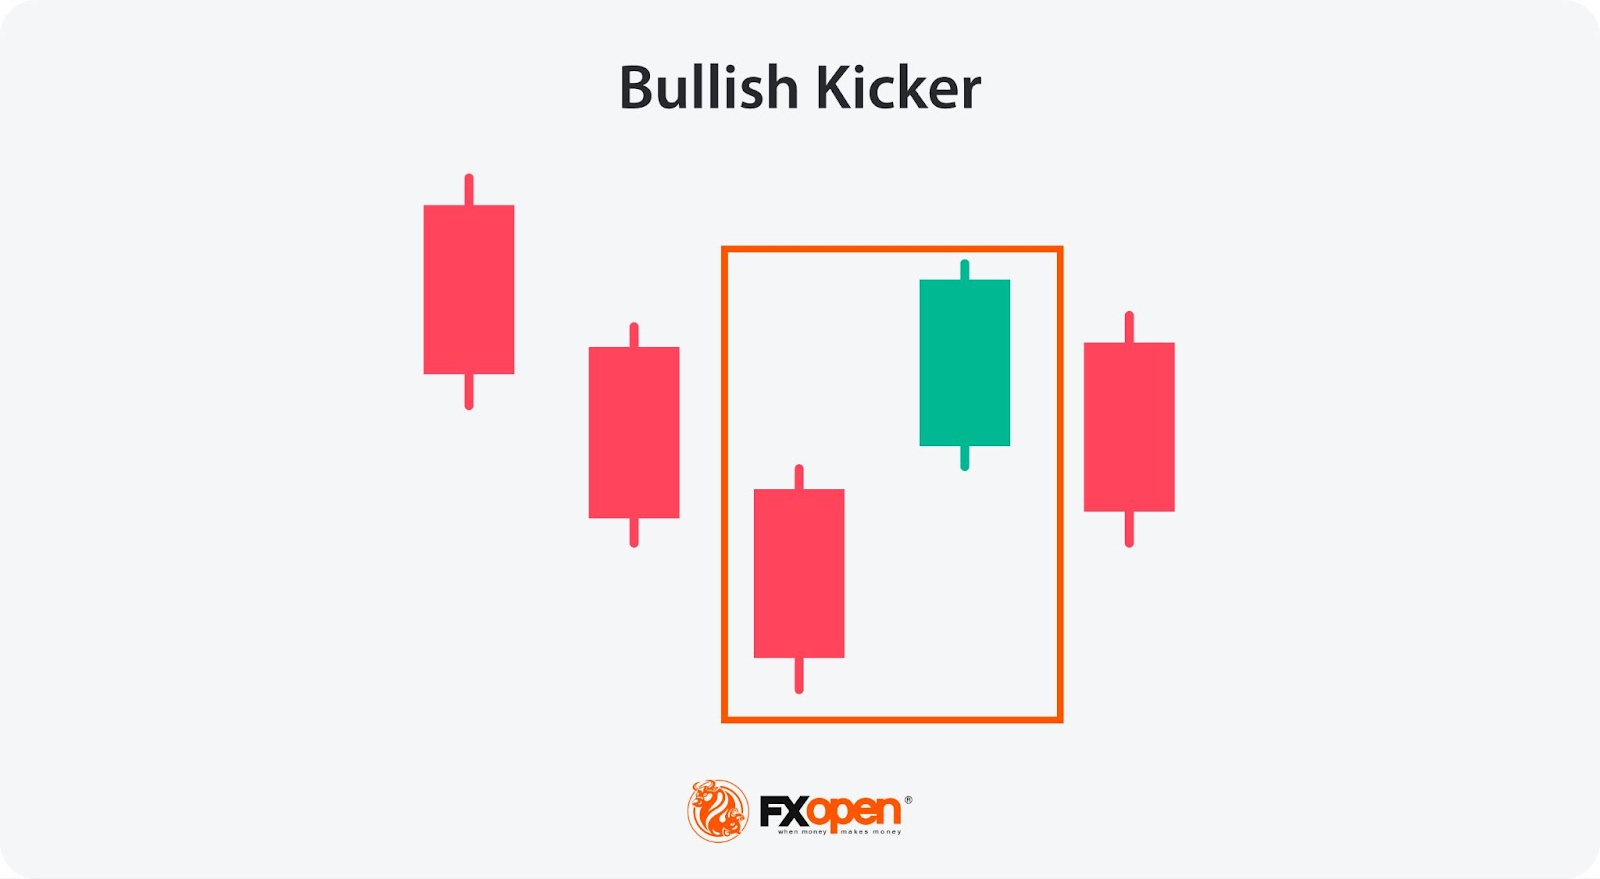
Kicker
The Kicker pattern is a powerful reversal signal that indicates a dramatic shift in market sentiment. It consists of two candlesticks: the first candle aligns with the prevailing trend, while the second candle gaps beyond the previous candle's close.
In a bullish Kicker, the first candlestick is bearish, followed by a bullish candle. The bullish candle opens above the first candle’s open, creating a gap. This abrupt change highlights a significant shift from selling to buying pressure. Traders see this as a strong indication of a potential upward reversal.
A stop loss is often placed below the low of the second candlestick. The Kicker pattern is significant for its clear, decisive indication of a market reversal.
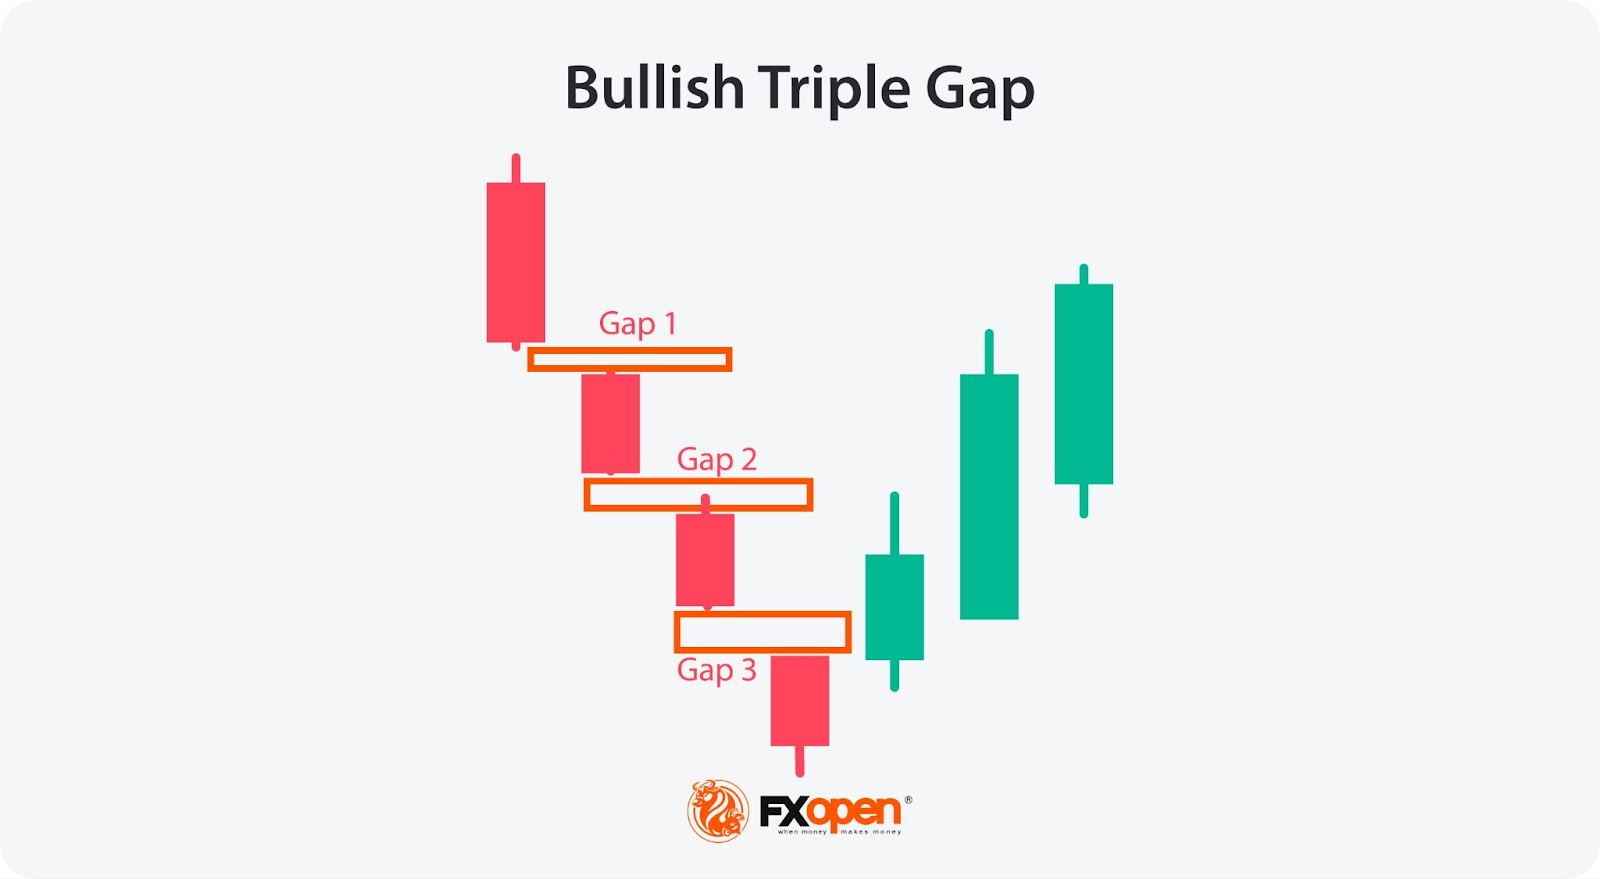
Bullish Triple Gap
The bullish Three Gaps (San-Ku) pattern signals a potential market reversal after a strong downward price movement. This pattern consists of three successive price gaps in the direction of the current trend, indicating exhaustion.
In the bullish Three Gaps, three downward gaps suggest intense selling pressure that may soon reverse. The first gap signifies strong momentum, the second gap continues this trend, and the third gap often marks the peak of selling interest, indicating potential overextension.
Traders look for signs of a reversal after the third gap, such as an Engulfing bullish candlestick. To potentially manage risk, a stop loss is typically placed below the lowest point of the pattern. The Three Gaps formation is valuable as it highlights market exuberance that could precede a reversal.
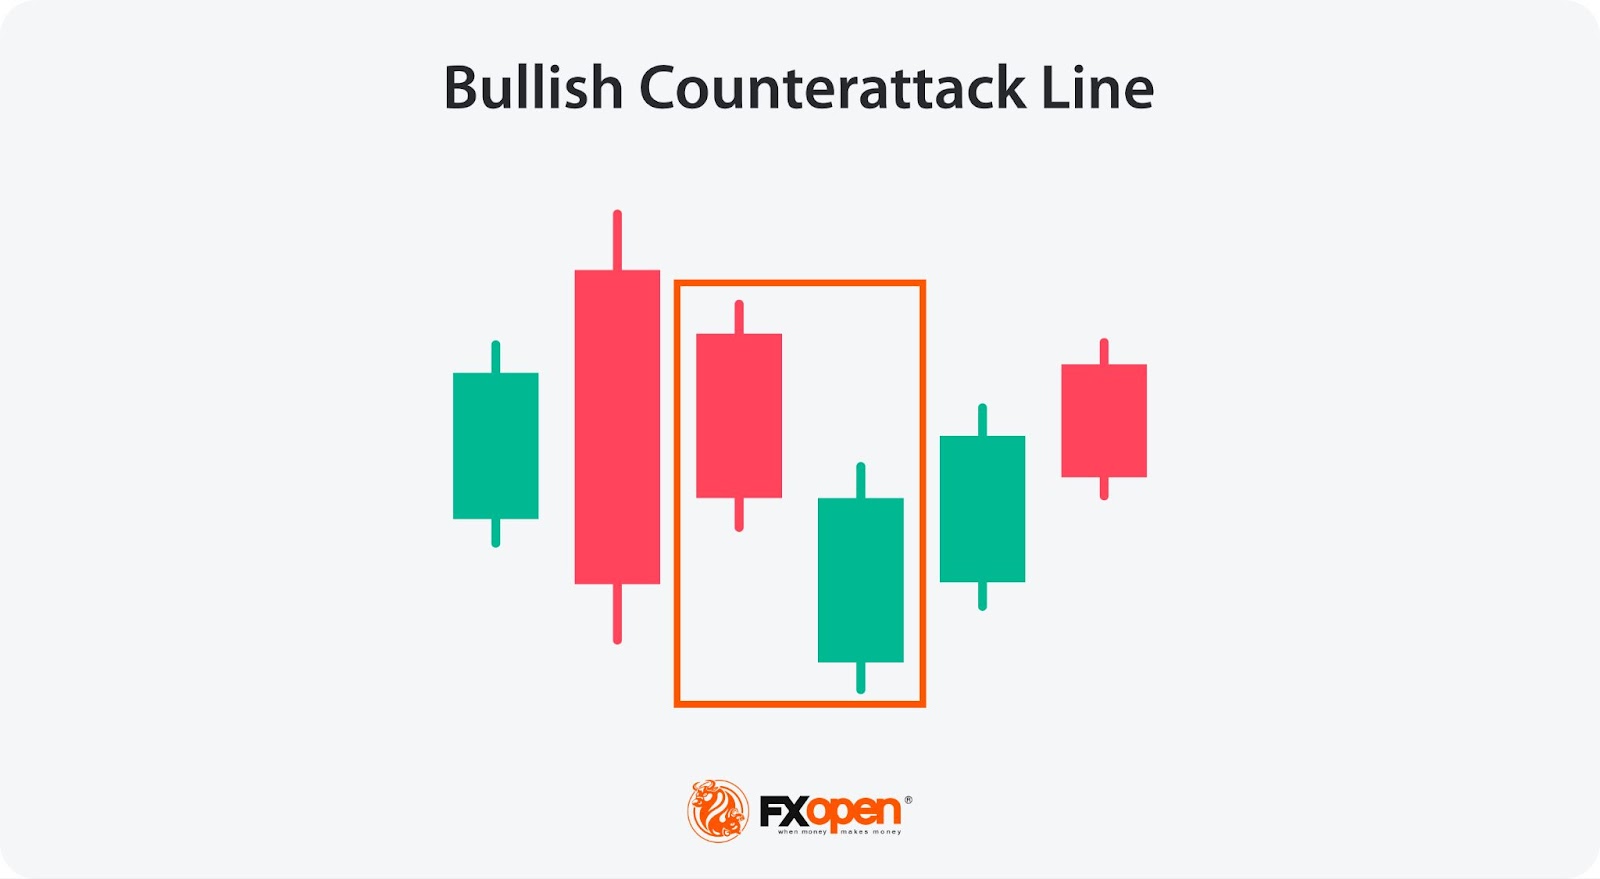
Bullish Counterattack Line
The Bullish Counterattack Line indicates a potential reversal in market sentiment after a significant downtrend.
This pattern consists of two candles: the first is a long bearish candlestick, and the second is a bullish candlestick that opens lower but closes at the same level as the bearish candle's close. This sharp reversal in closing prices suggests that buying interest has matched the previous selling pressure, signalling a possible shift to bullish momentum.
A common risk management strategy is placing a stop loss below the low of the bullish candlestick.
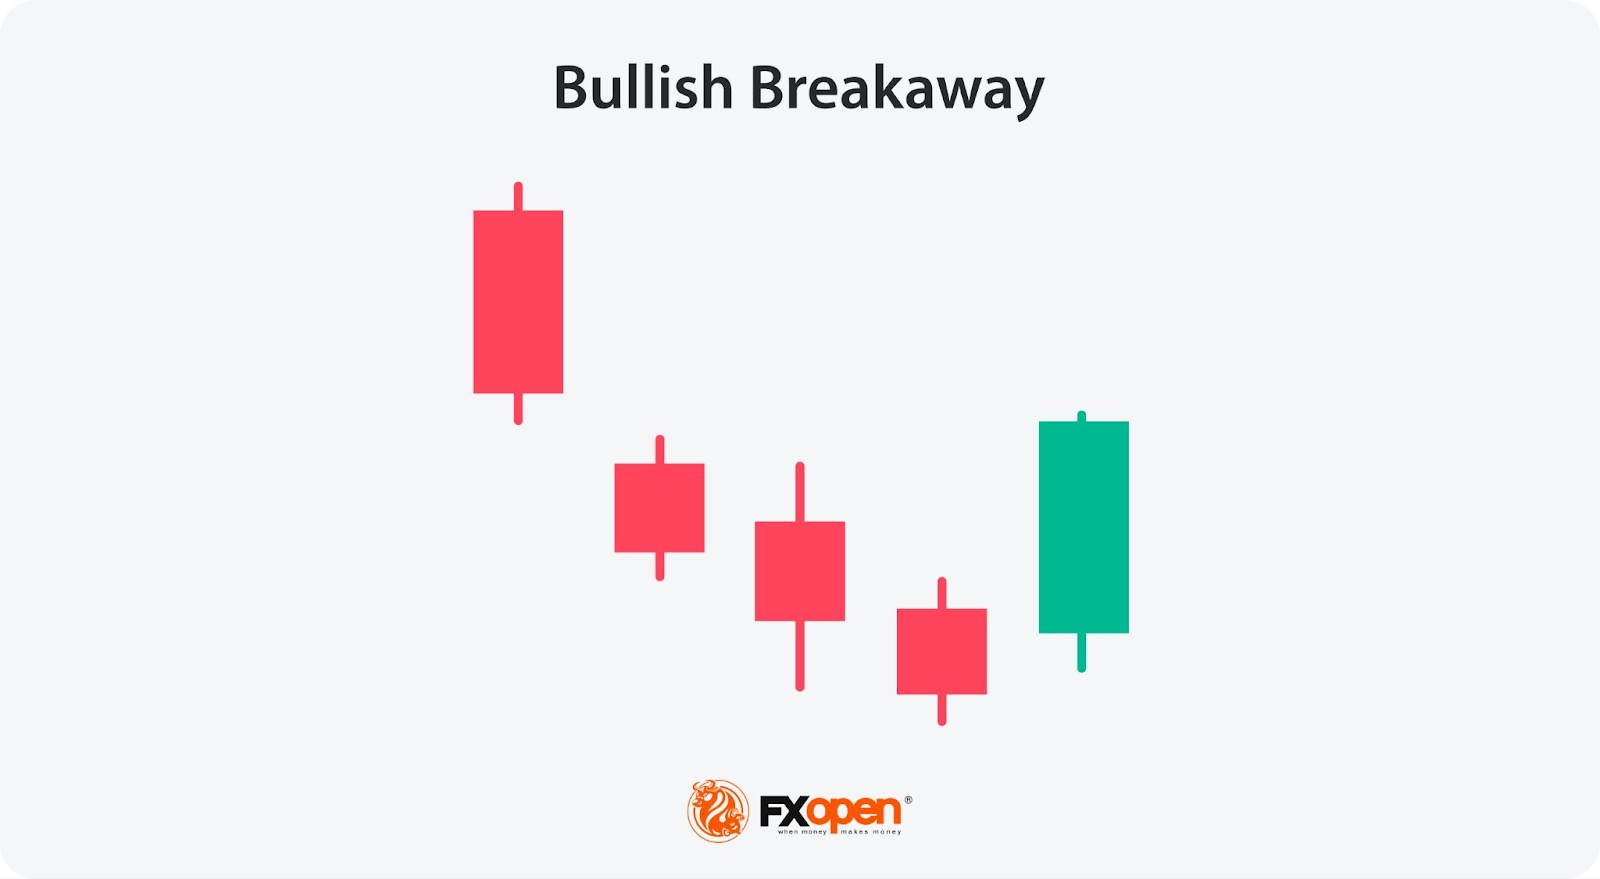
Bullish Breakaway
The Bullish Breakaway pattern signals a potential reversal in market direction after an extended downtrend.
It consists of five candles: the first is a long bearish candle, followed by three smaller candles that continue the downward trend but with diminishing momentum. The fifth candlestick is a large bullish candle that should close either within the gap between the first two candles or above the first candle’s open. This shift suggests a significant change in market sentiment from bearish to bullish.
Traders often view the close of the fifth candlestick as confirmation of the reversal and may place a stop loss below the low of the fourth candle. The Bullish Breakaway formation is important as it highlights a clear transition from selling pressure to buying interest.
Bearish Reversal Candlestick Patterns
Many candlestick patterns are paired, meaning they mirror each other in the shape and market signals.
Evening Star
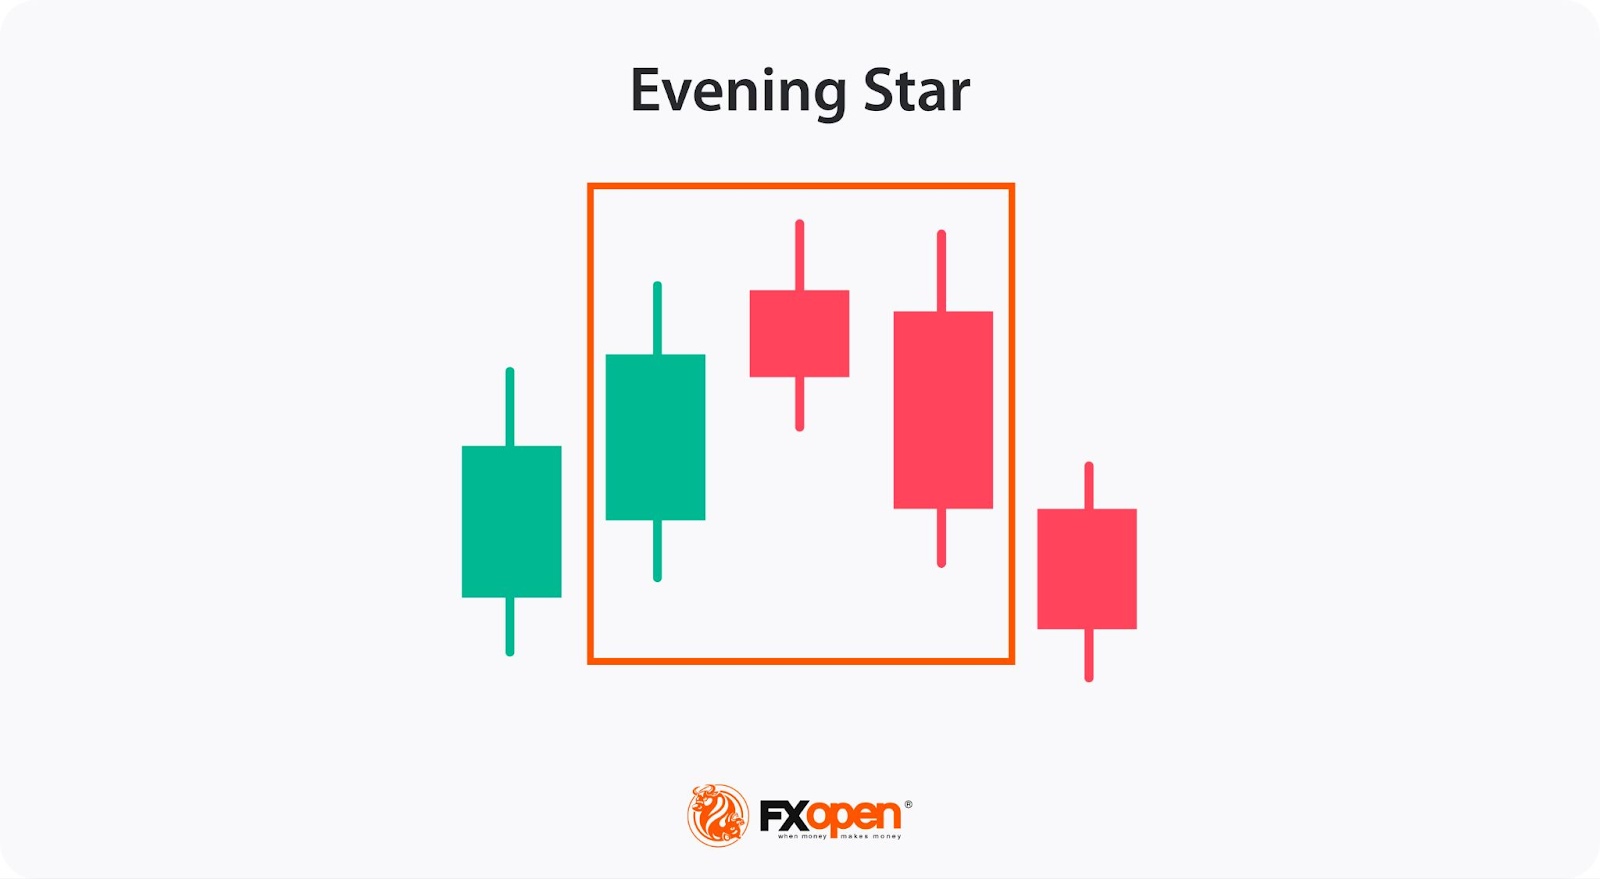
The Evening Star is a bearish reversal pattern that appears after an uptrend, indicating a potential future decline. It consists of three candles: the first is a long bullish candlestick, confirming the upward movement. The second candle is smaller, showing a slowdown in buying momentum, and can be bullish or bearish. The third candlestick is a long bearish candle, signalling a strong shift to selling pressure.
Traders often look for this pattern as an early sign of a trend reversal and might place a stop loss above the high of the second candle.
Evening Doji Star
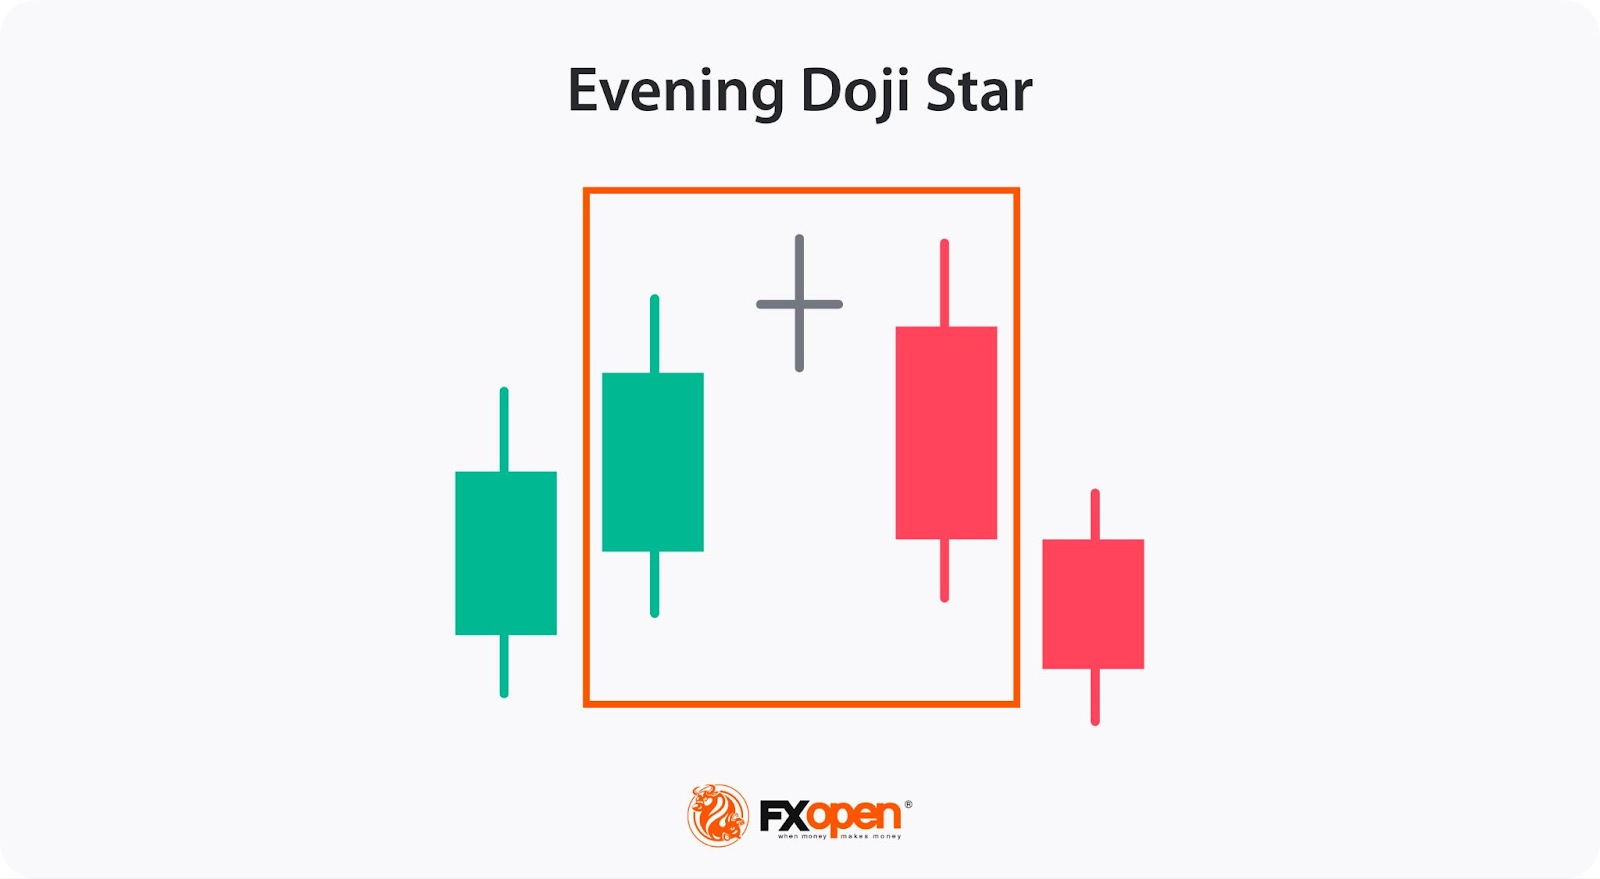
The Evening Doji Star is a bearish reversal formation that emerges after an uptrend, indicating potential downward movement. This pattern consists of three candlesticks: the first is a long bullish candle, confirming the uptrend. The second candlestick is a Doji, reflecting market indecision with its open and close prices nearly identical. The third is an extended bearish candle, closing below the halfway point of the first candle.
A common risk management strategy involves placing a stop loss above the high of the Doji.
Three Black Crows
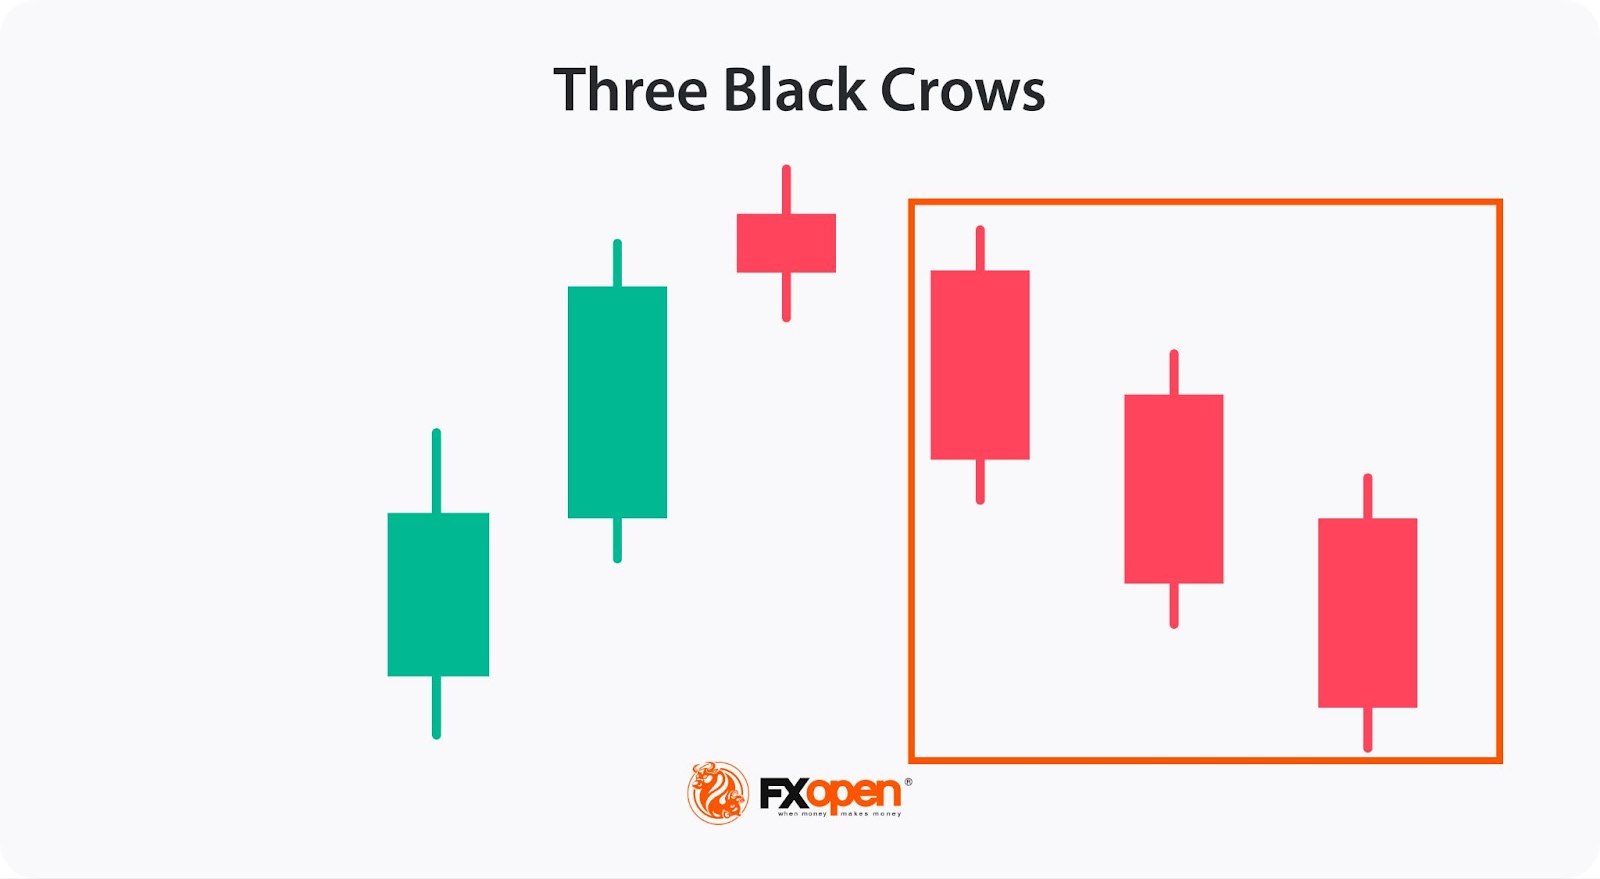
The Three Black Crows pattern is a bearish reversal signal indicating a potential downturn after an uptrend. It consists of three consecutive long bearish candlesticks, each opening within the previous candle's body and closing progressively lower. Candles should have little or no lower shadows. This formation signifies sustained selling pressure and a clear shift from bullish to bearish sentiment.
Traders might place a stop loss above the high of the first candle.
Bearish Harami
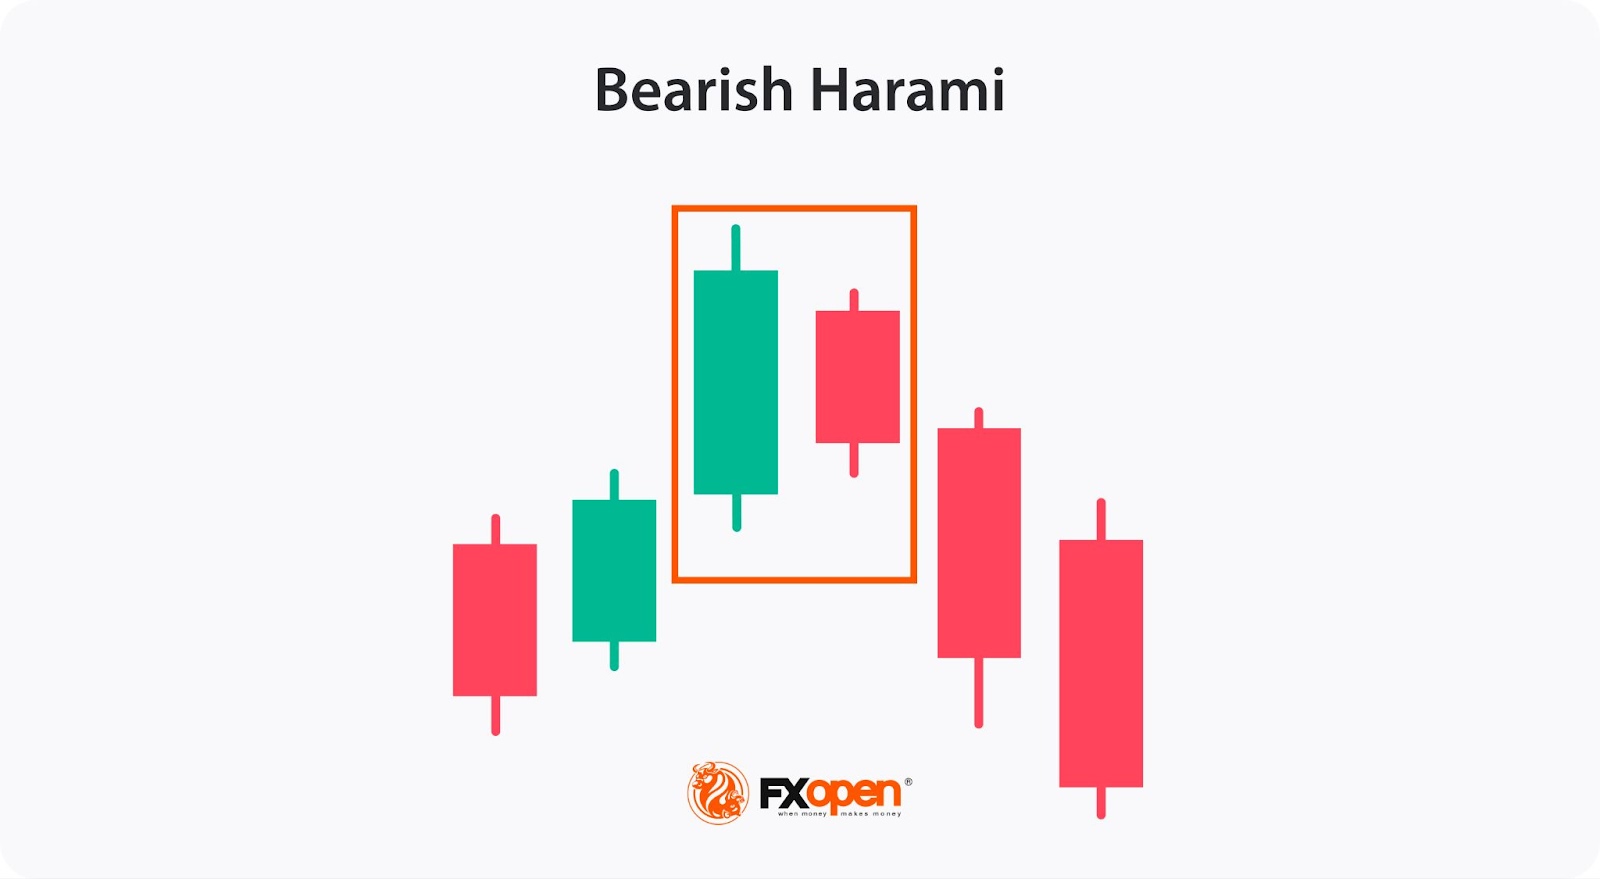
The Bearish Harami is a reversal pattern indicating a potential shift from an uptrend to a downtrend.
It consists of two candles: the first is a long bullish candle, followed by a smaller bearish candle that is entirely within the body of the first. This formation signals a decrease in buying momentum and a possible rise in selling pressure.
Traders often view the Bearish Harami as an early sign of a trend reversal, with confirmation coming from subsequent bearish movement. A common risk management strategy involves placing a stop loss above the high of the first candle.
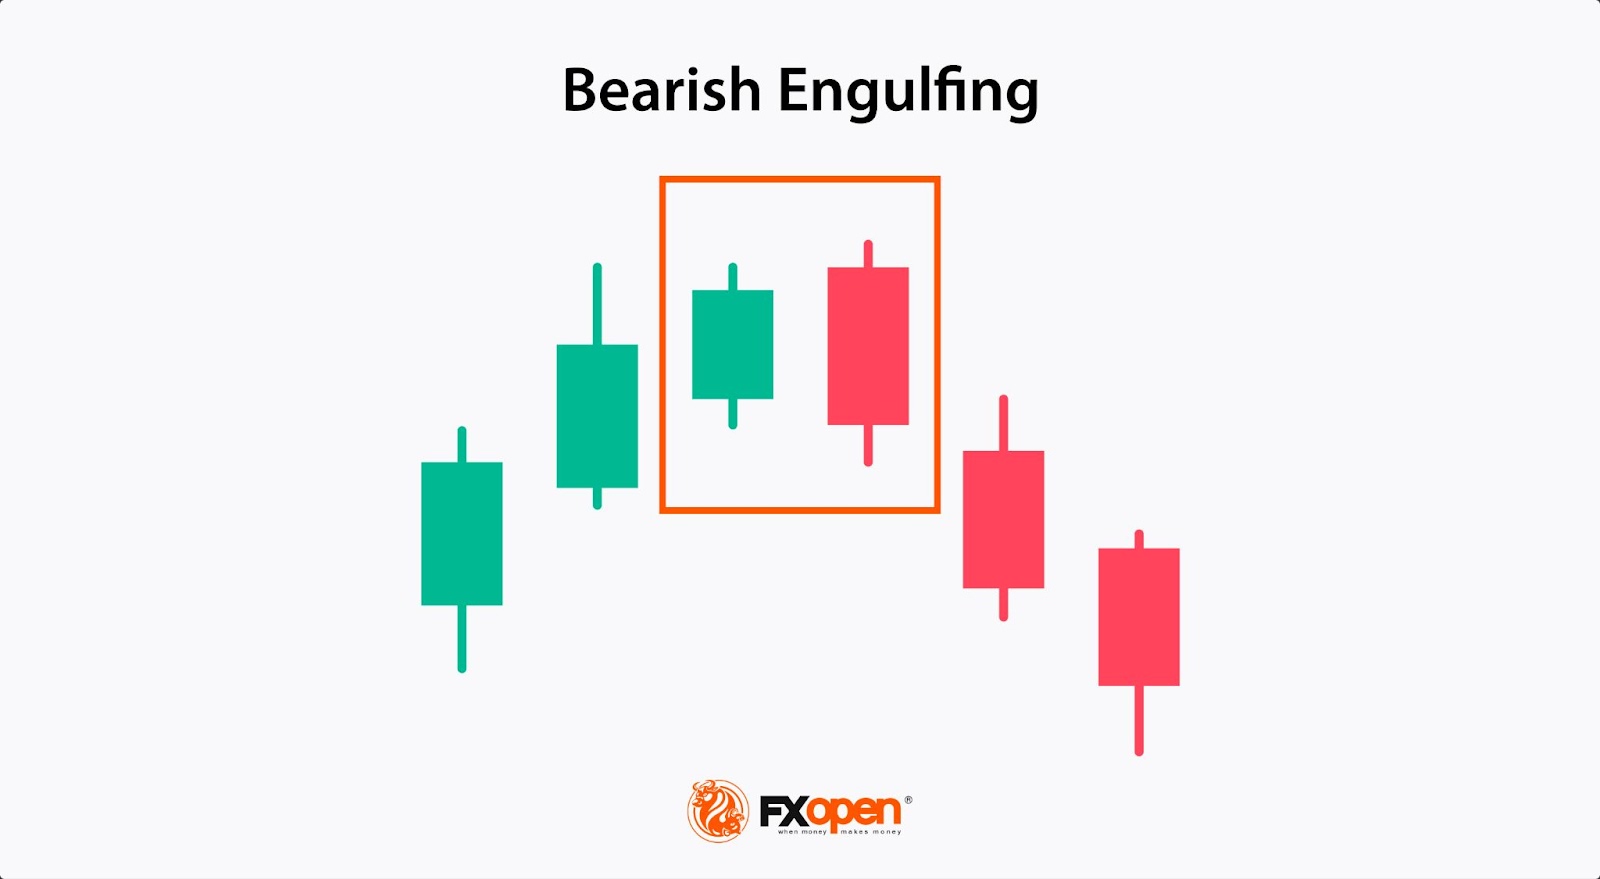
Bearish Engulfing
The Bearish Engulfing pattern signals a potential reversal during an uptrend, highlighting a shift to bearish sentiment.
It consists of two candles. The first candle is small and bullish, while the second is a large bearish candle that entirely engulfs the first’s body. This pattern suggests overwhelming selling pressure overtaking the previous buying momentum.
Traders view the Bearish Engulfing as a strong indicator of a potential downward trend and might place a stop loss above the high of the bearish candle to potentially manage risk.
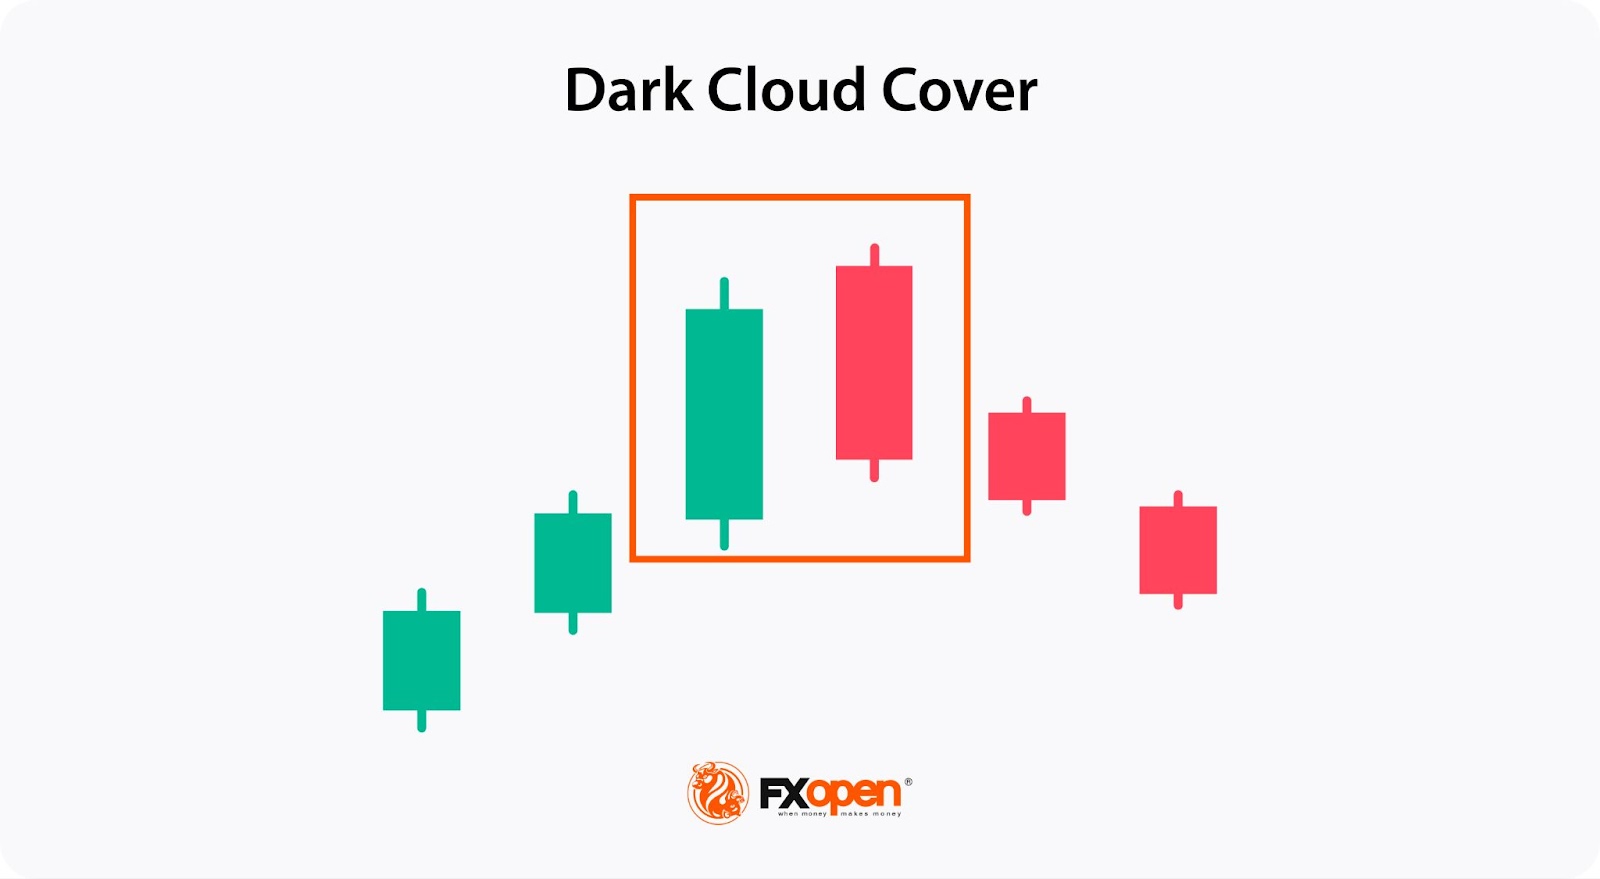
Dark Cloud Cover
The Dark Cloud Cover formation is a bearish reversal signal that occurs after an uptrend, suggesting a potential decline. It comprises two candles: the first is a long bullish candle, followed by a bearish candle that opens above the previous candle's close but closes below its midpoint.
Traders may place a stop loss above the high of the bearish candle. The Dark Cloud Cover is significant because it reveals a substantial change in market sentiment.
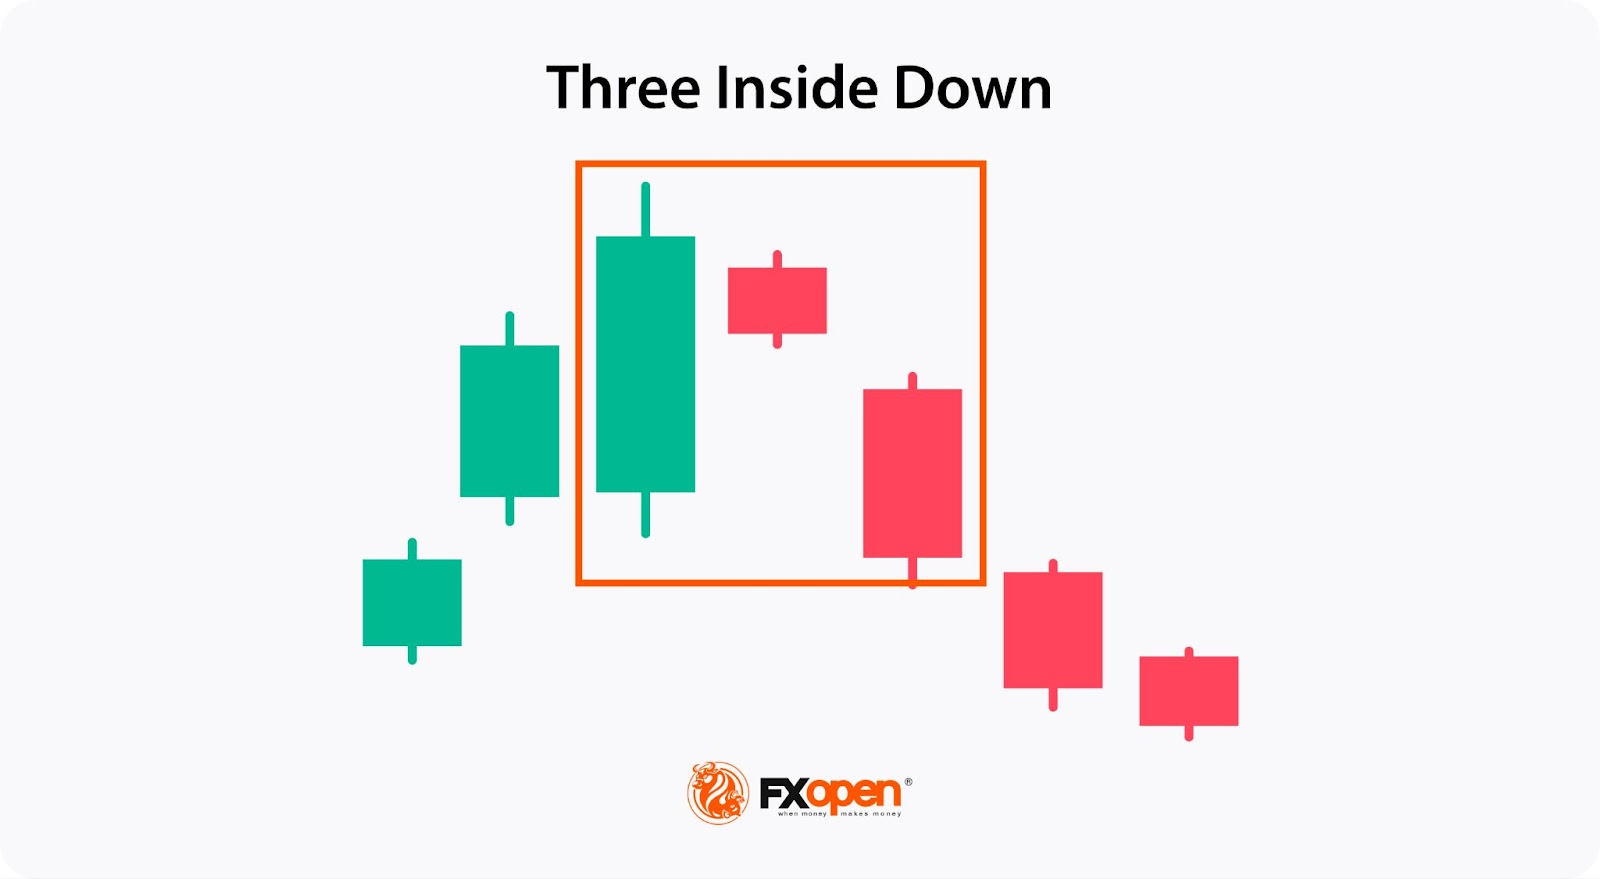
Three Inside Down
The Three Inside Down is a bearish reversal pattern indicating a potential shift in market direction after an uptrend. It comprises three candles: the first is a long bullish candle, followed by a smaller bearish candle within the first candle's body, and the third is a bearish candle closing below the first candle’s low. Although the common condition is that the second candle is closed within the first candlestick’s body, the theory states that if the second candle closes below half of the bullish candle, the reversal signal is stronger.
This sequence demonstrates a loss of buying momentum and increasing selling pressure. Traders often place a stop loss above the high of the second candle.
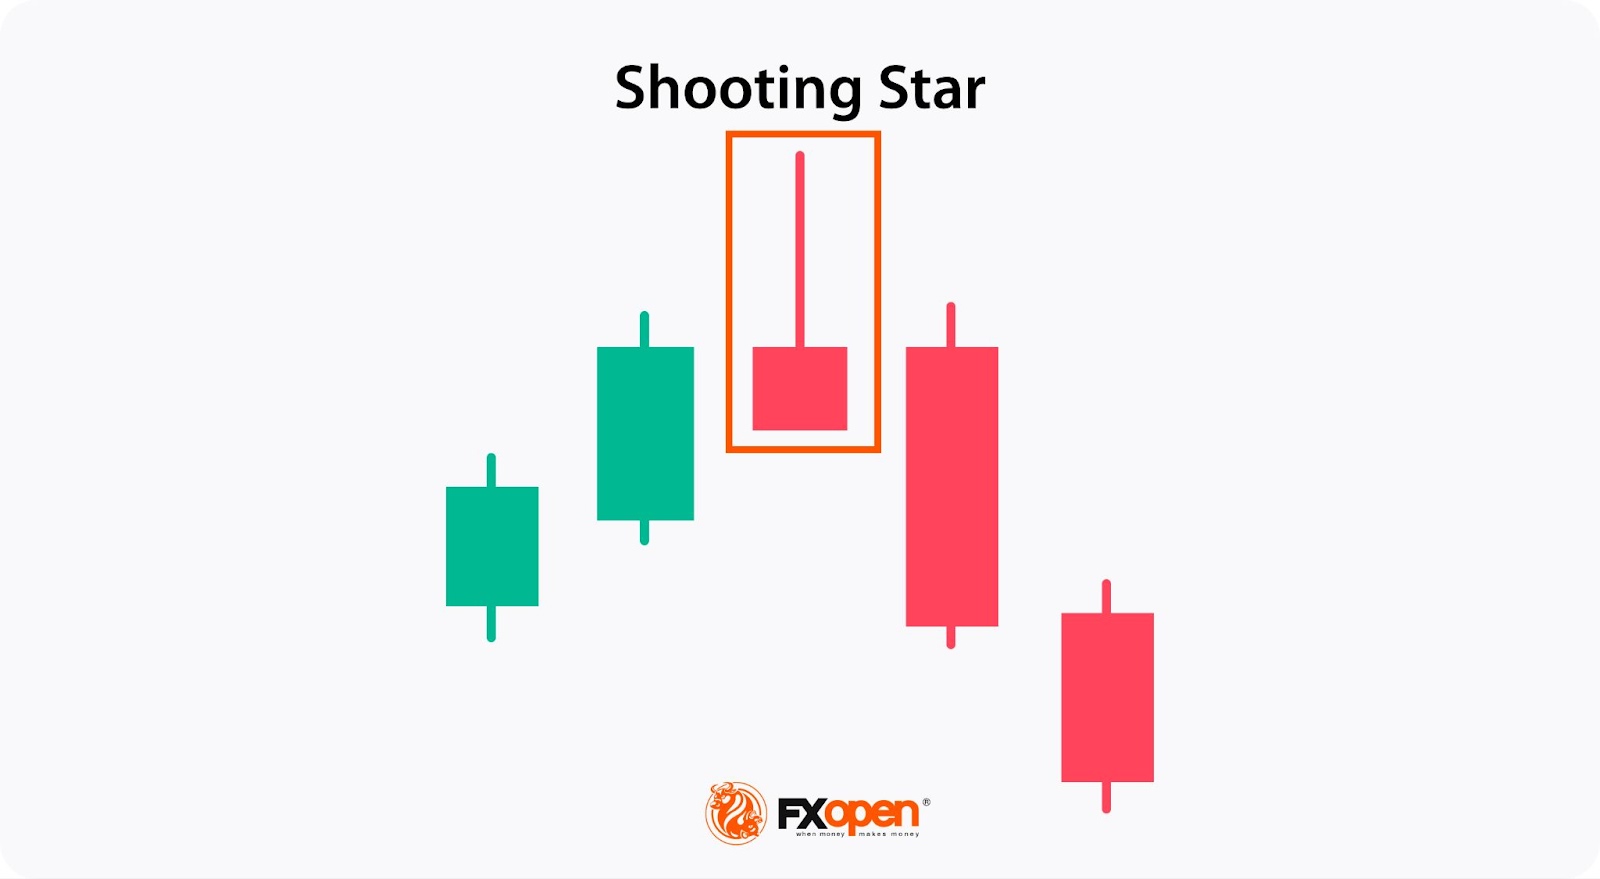
Shooting Star
The Shooting Star is a bearish reversal pattern that suggests a potential peak of an upward movement. It consists of a single candle with a small body near the low and a long upper wick, indicating that buyers pushed prices higher, but sellers drove them back down. This pattern shows that buying pressure is weakening.
Traders often look for confirmation with a subsequent bearish candle and may place a stop loss above the high of the Shooting Star. The formation is significant because it highlights increased selling interest at higher prices, suggesting a potential reversal to the downside.
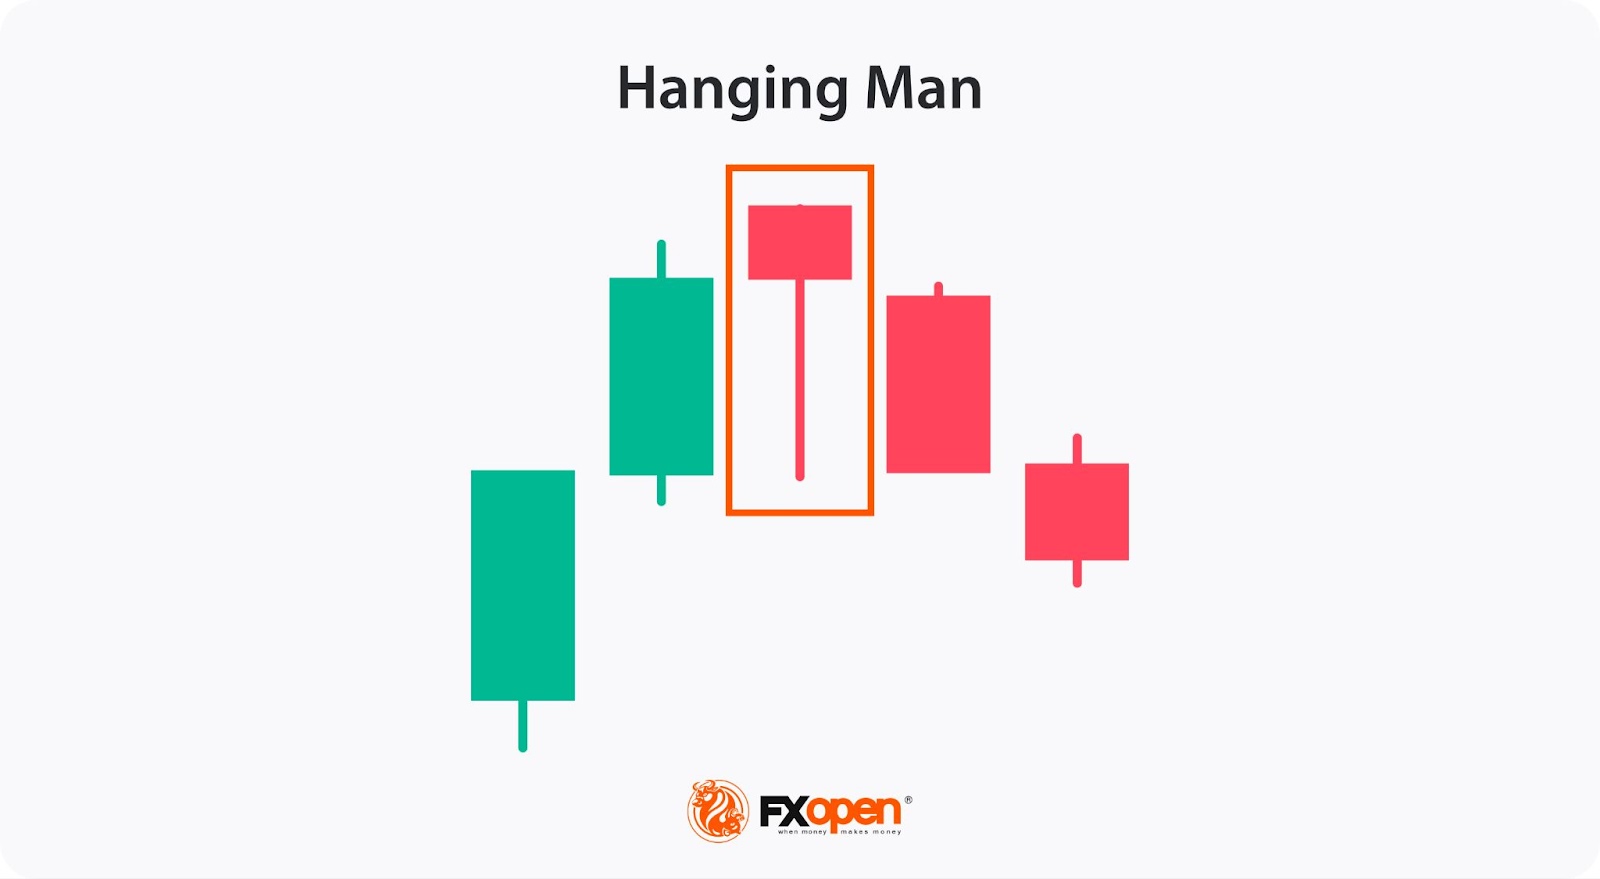
Hanging Man
The Hanging Man is a bearish reversal pattern that suggests a potential top or resistance level after an uptrend. It consists of a single candle with a small body at the top and a long lower wick, indicating that sellers drove prices down, but buyers pushed them back up near the opening level. Still, this pattern shows that selling pressure is emerging despite the bullish trend.
Traders look for confirmation with a subsequent bearish candle and may place a stop loss above the Hanging Man's high to potentially manage risk. The Hanging Man is significant because it marks the point where selling interest starts to outweigh buying interest.
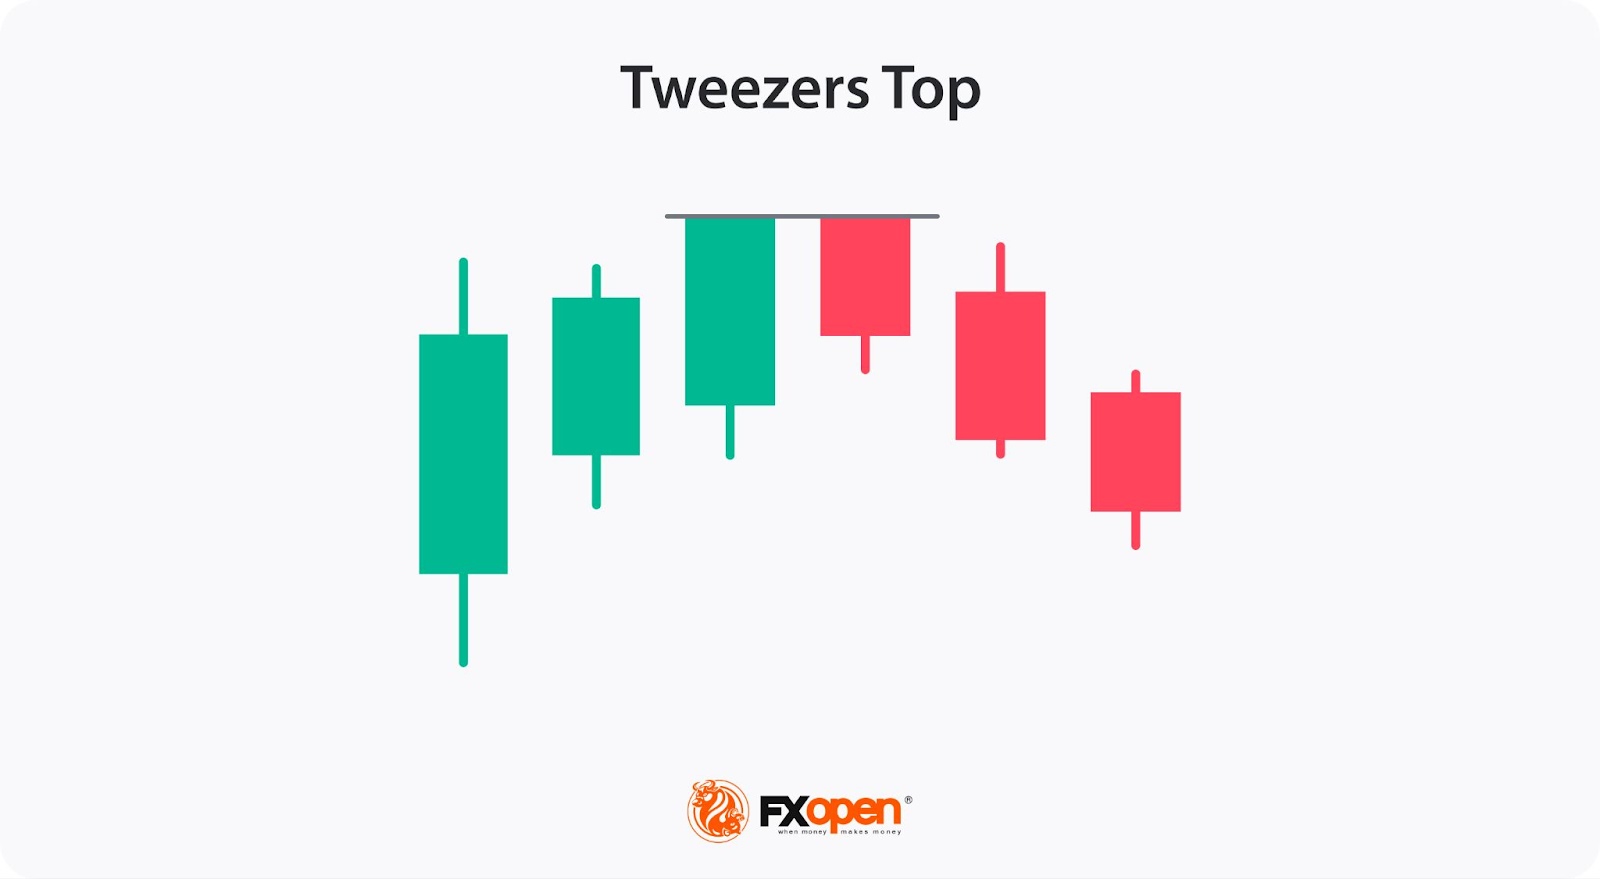
Tweezer Top
The Tweezer Top is a bearish reversal pattern that signals a potential market peak after an uptrend. It consists of two consecutive candles with matching highs. The first candle is bullish, reflecting ongoing buying pressure, while the second candle is bearish, indicating that sellers have entered the market. This formation highlights a strong resistance level, where buying momentum is halted.
Traders often view the Tweezer Top as an early indicator of a trend reversal and might place a stop loss above the matching highs to manage risk. The Tweezer Top is significant for identifying critical resistance points and potential downward movement.
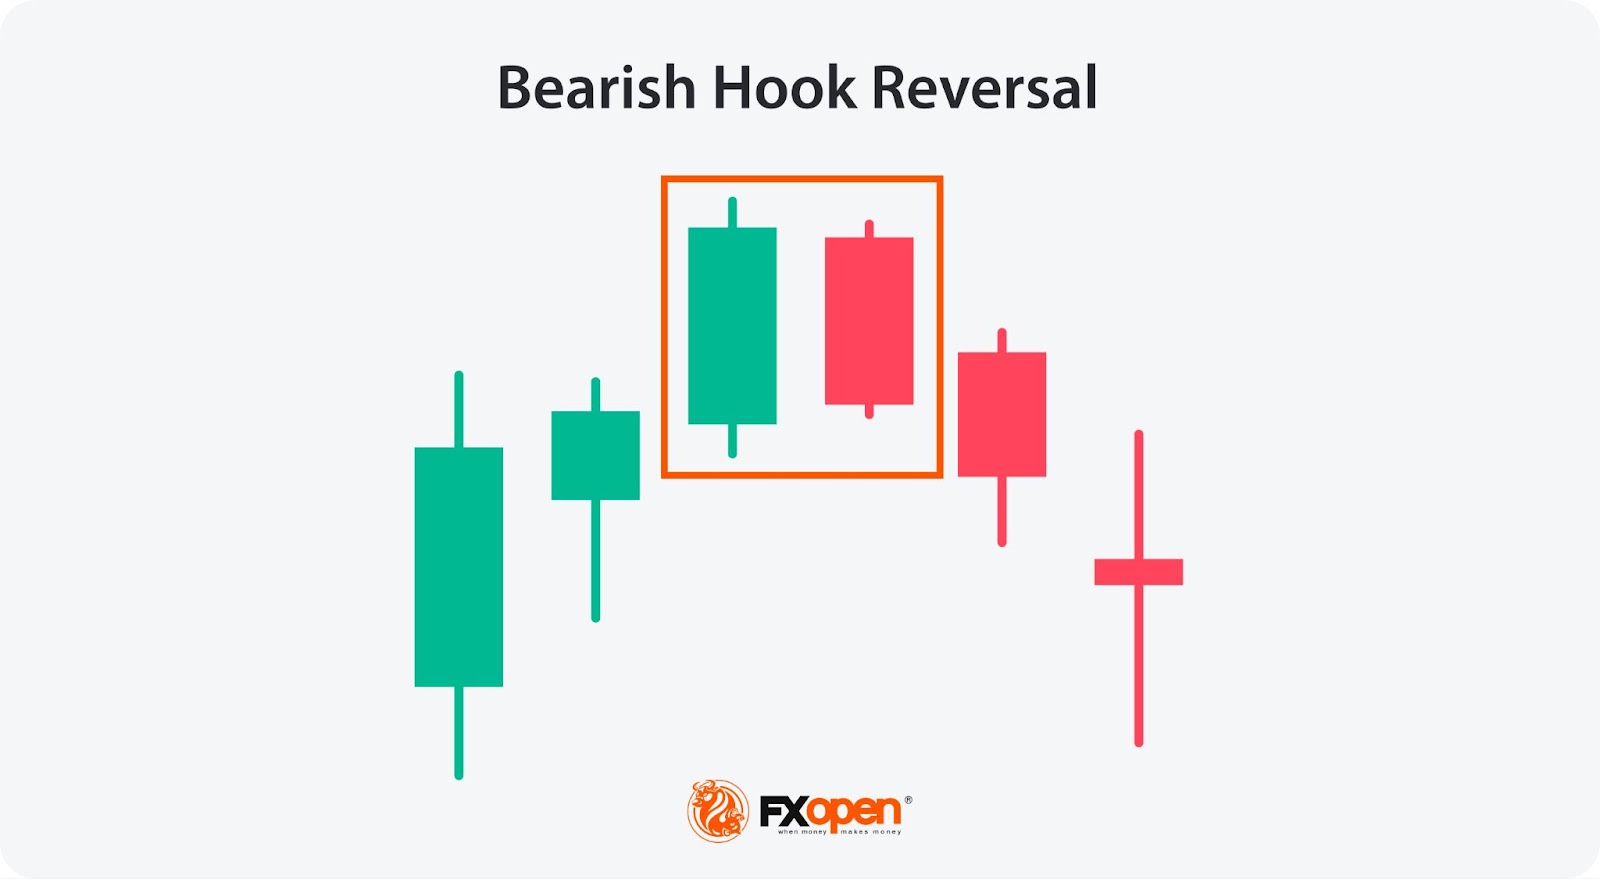
Hook Reversal
The bearish Hook Reversal is important for identifying shifts in market sentiment from bullish to bearish, signalling a potential decline. It involves two candles: the first is a bullish candle, followed by a bearish candle that is within the previous candle’s range. This pattern suggests that buying momentum is fading and selling pressure is taking over.
Traders usually place a stop loss above the high of the bullish candle.
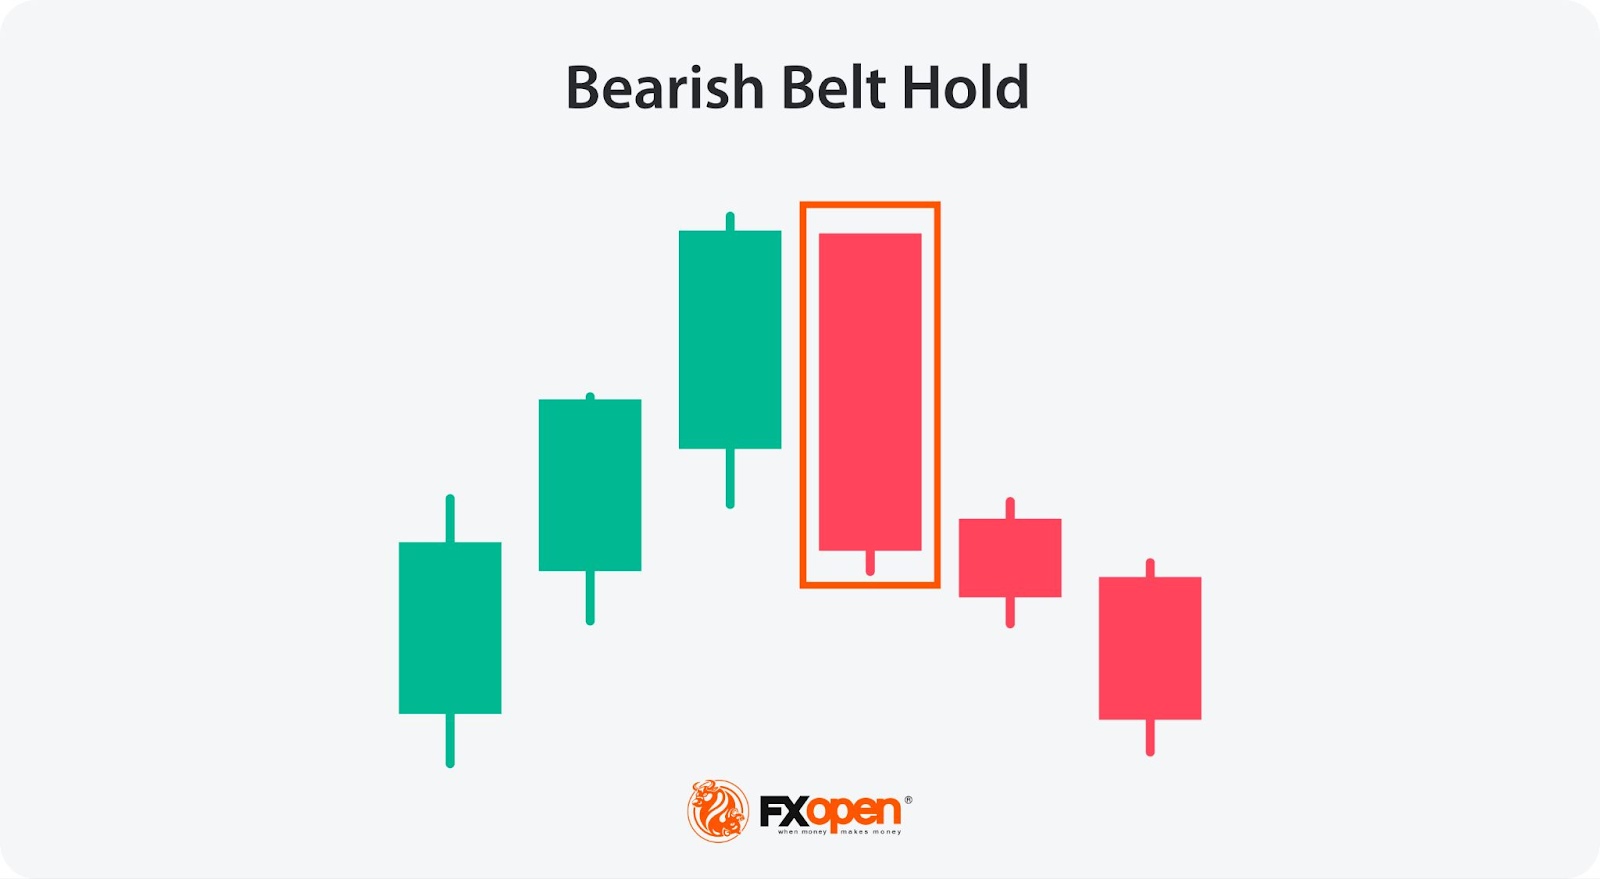
Belt Hold
The bearish Belt Hold pattern signals a potential reversal in an uptrend. It consists of a single long bearish candle that opens at or near the previous close and then closes lower. The candle has little to no wicks. This indicates strong selling pressure right from the opening, suggesting a shift in market sentiment.
Traders often view this pattern as an early warning of a possible downtrend and place a stop loss above the high of the candle. The Belt Hold is valuable for recognising sudden and decisive changes in market dynamics.
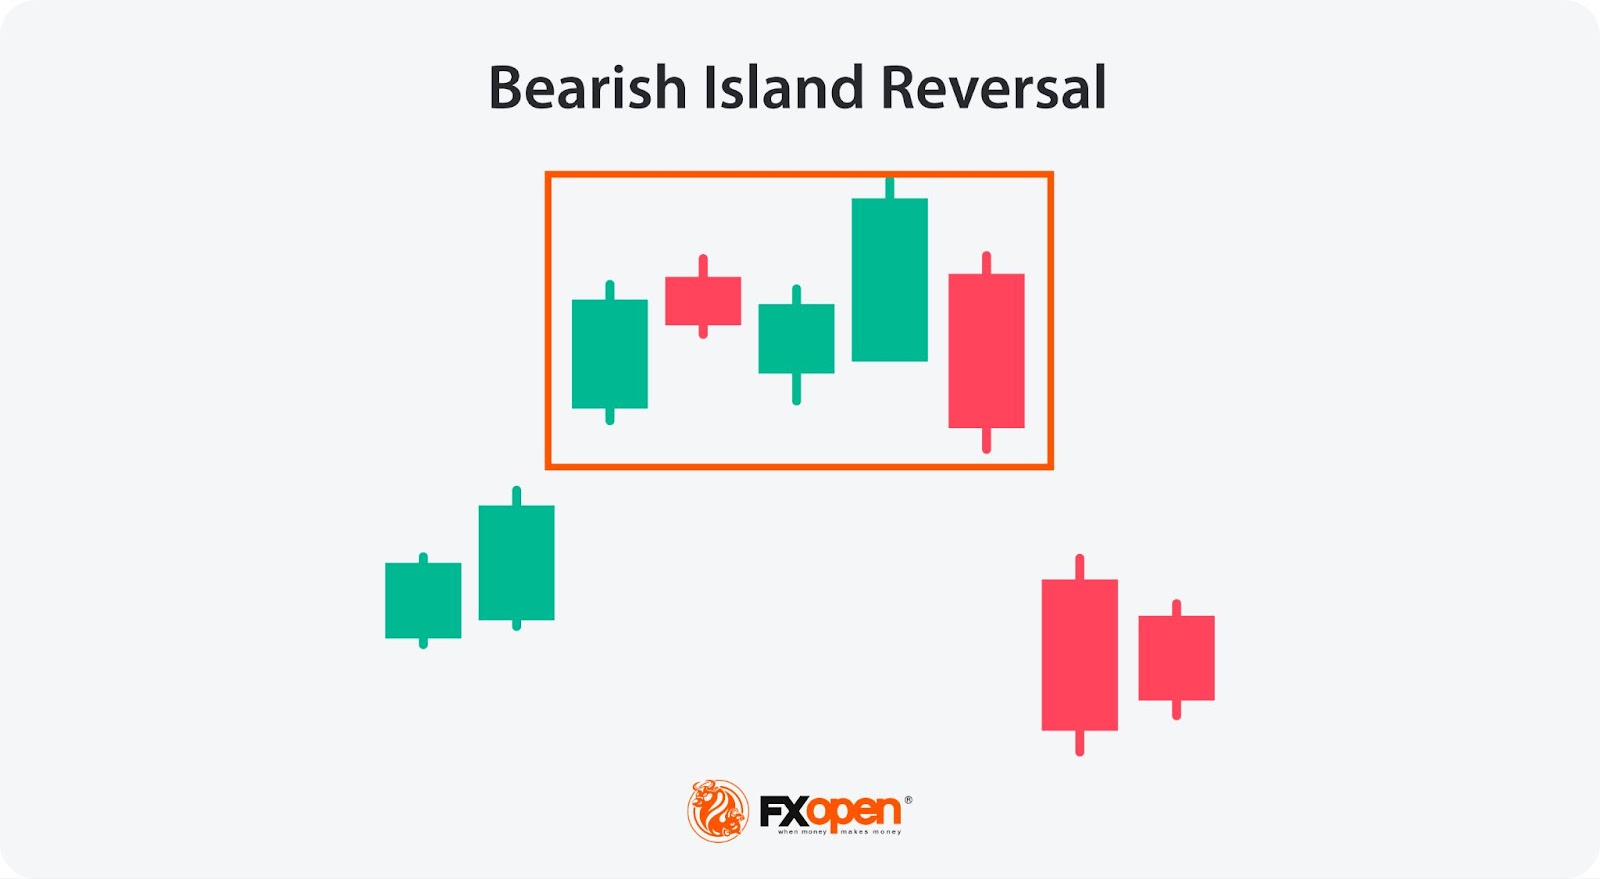
Island Reversal
An Island Reversal is a powerful bearish reversal pattern characterised by a gap on either side of a cluster of candles, occurring after an uptrend. It starts with a gap up, followed by a period of consolidation, and ends with a gap down. This formation indicates that buying pressure has peaked, and selling interest is taking over. The pattern can include a different number of candles.
Traders see the gaps as strong indicators of a shift in market sentiment. A stop loss is often placed above the consolidation area's high.
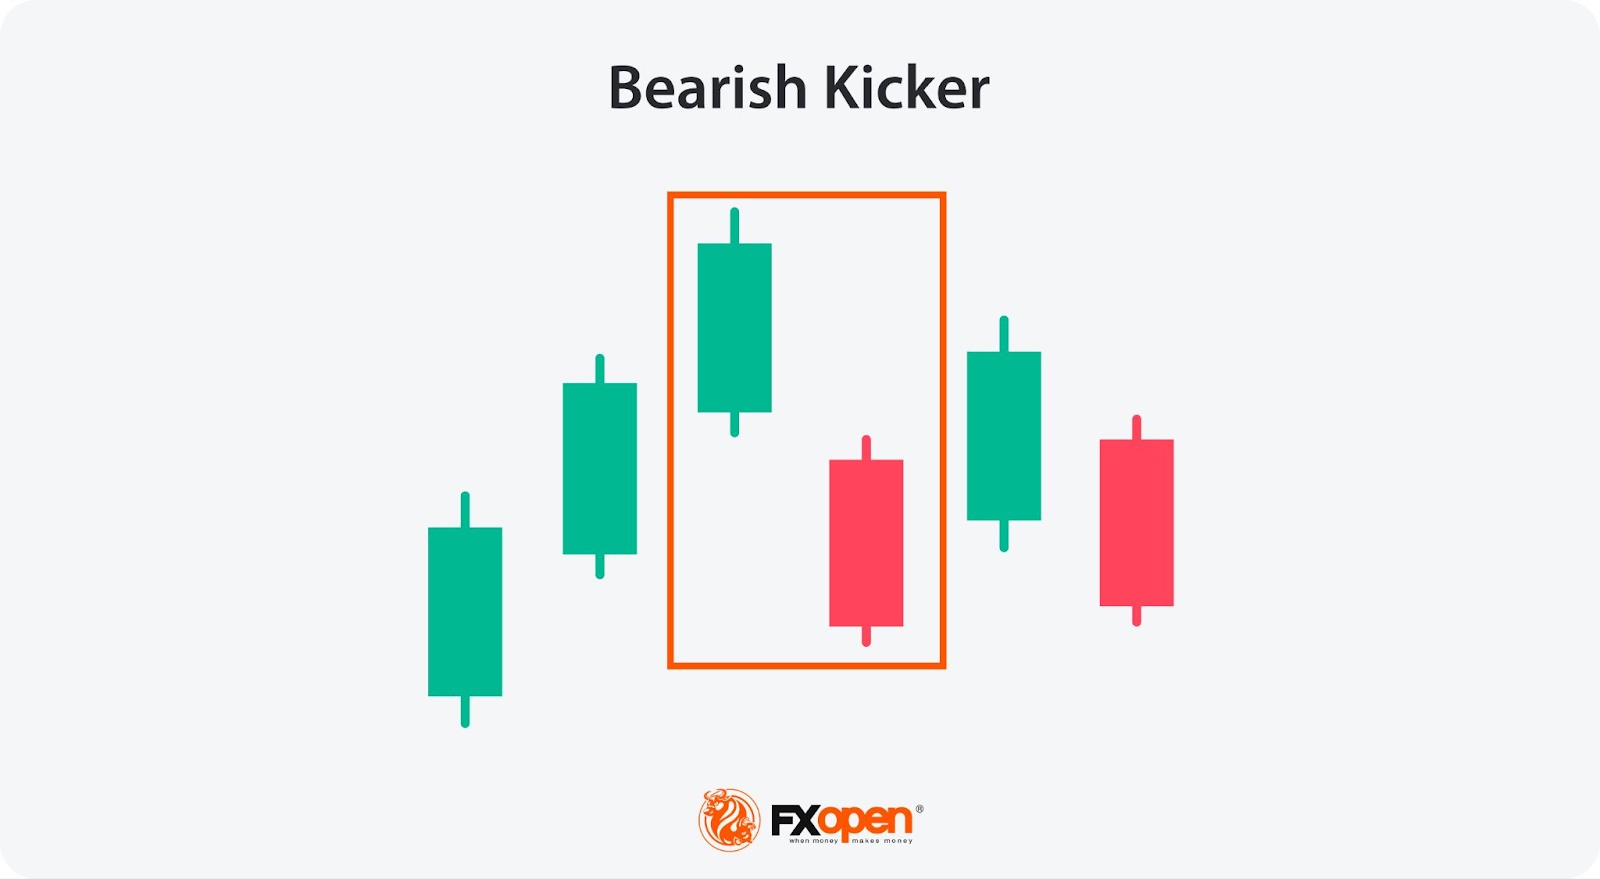
Kicker
The Kicker pattern is a strong bearish reversal signal indicating a dramatic shift in market sentiment.
In a bearish Kicker, the first candle is bullish, followed by a bearish candle that opens below the first candle’s open to create a gap. This formation signals a significant change from buying to selling pressure. Traders often place a stop loss above the high of the second candle. The Kicker is crucial for identifying abrupt reversals.
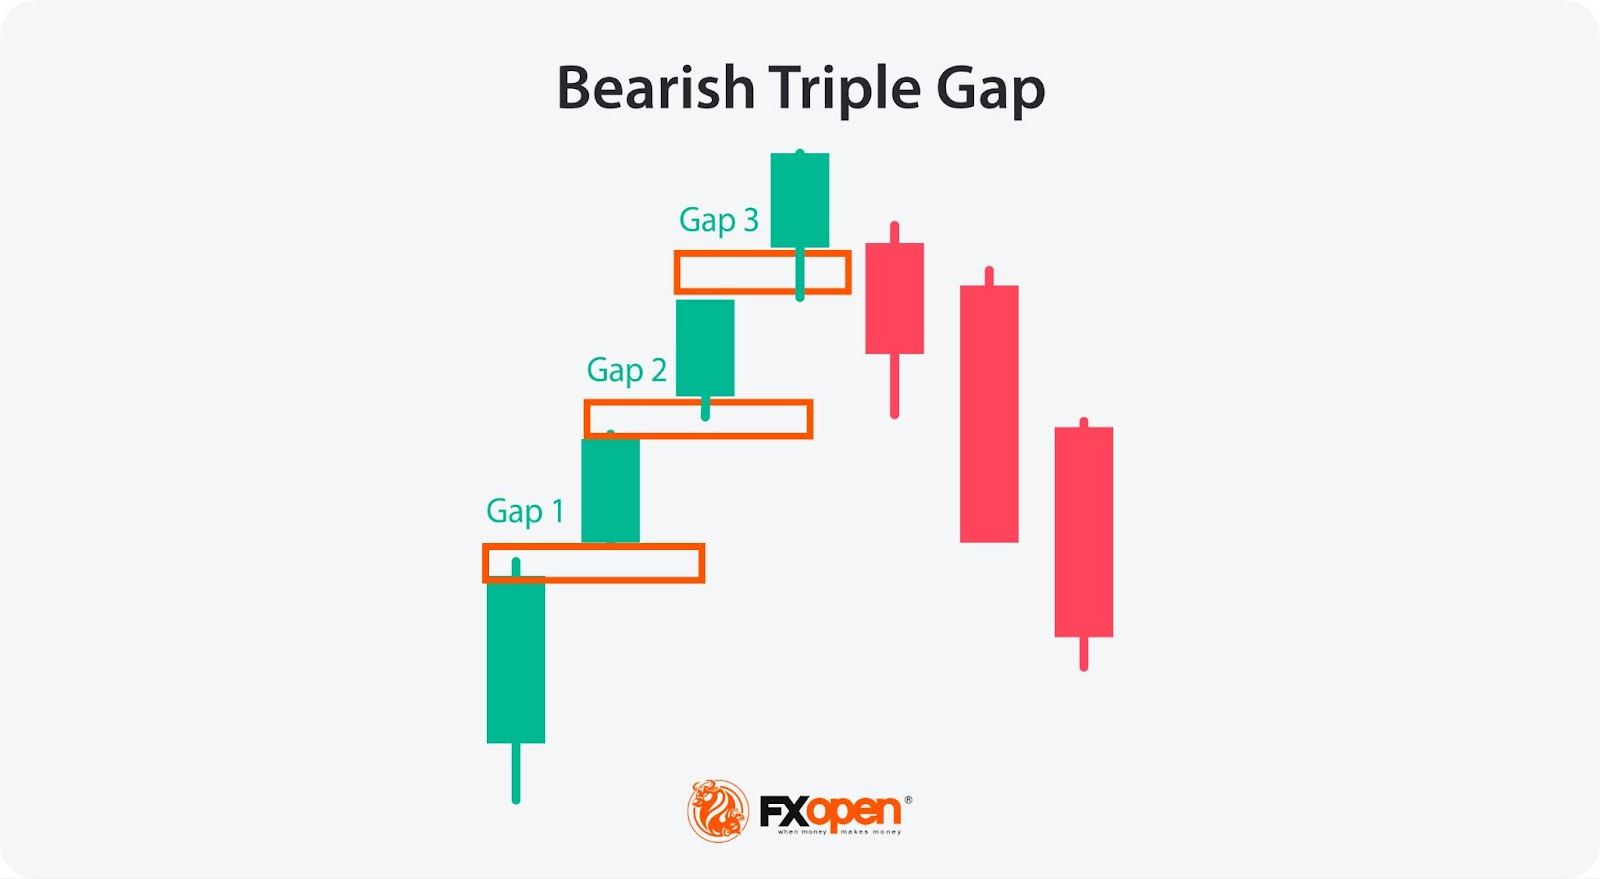
Bearish Triple Gap
The bearish Three Gaps (San-Ku) pattern signals a potential bearish reversal after a strong upward movement. It consists of three successive price gaps in the direction of the current uptrend, indicating exhaustion. The first gap shows strong momentum, the second continues this trend, and the third gap often marks the peak of buying interest, suggesting overextension.
Traders look for signs of reversal after the third gap, such as a bearish candle. A stop loss is typically placed above the highest point of the pattern to potentially manage risk. The Three Gaps pattern is valuable as it highlights market exuberance that could precede a downturn.
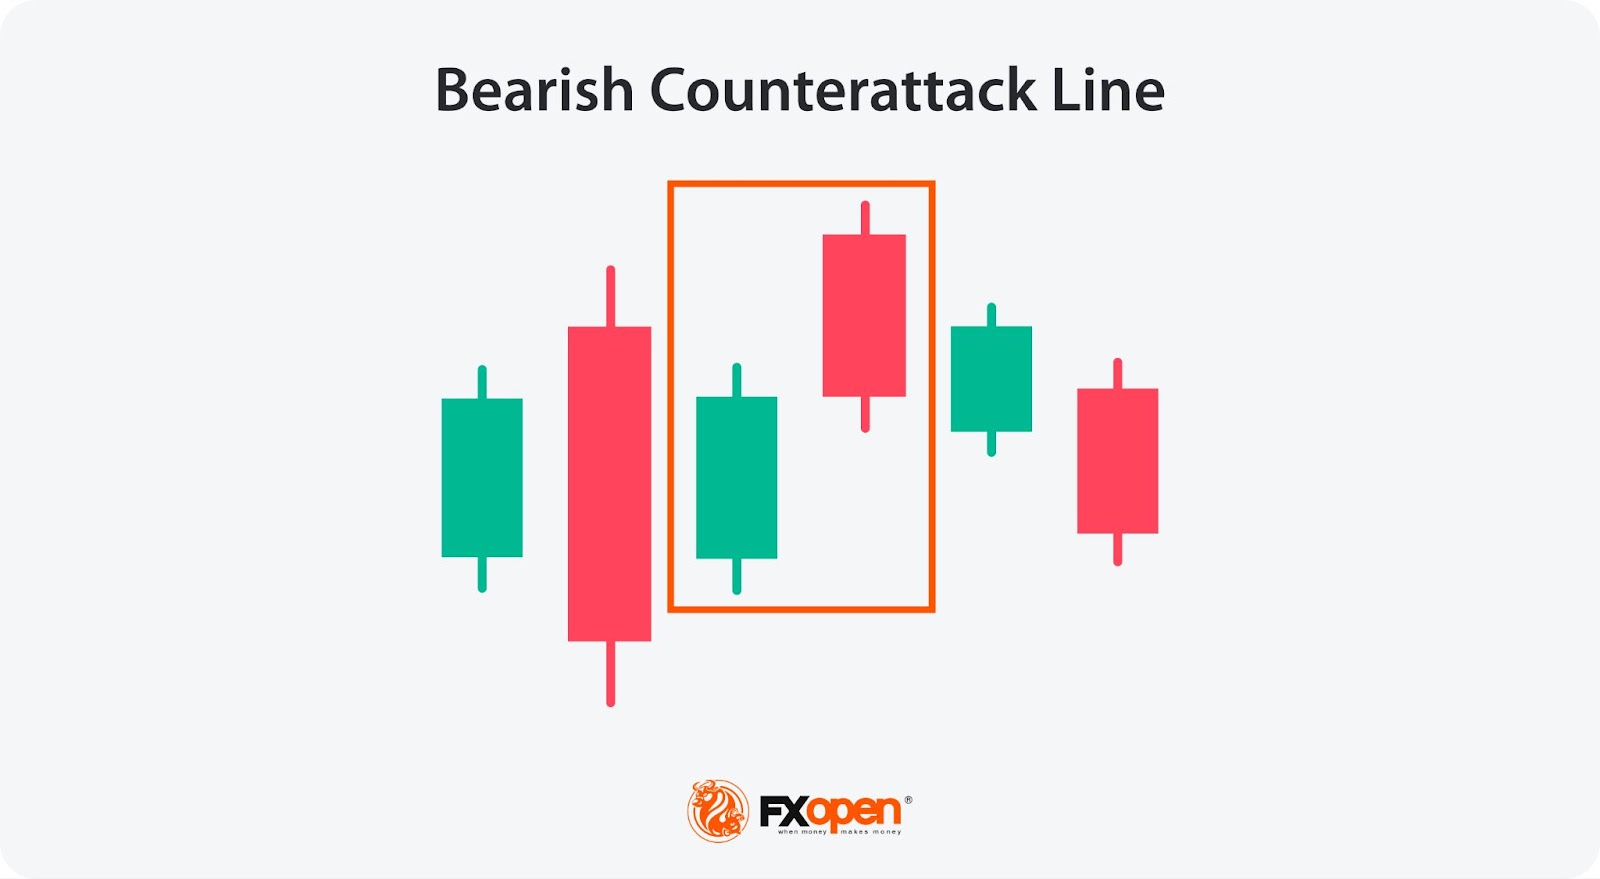
Bearish Counterattack Line
The Bearish Counterattack Line is significant for identifying changes in market dynamics. It indicates a potential reversal after an uptrend, highlighting a shift to bearish sentiment. The pattern consists of two candles: the first is a long bullish candle, and the second is a bearish candle that opens higher but closes at the same level as the previous candle's close. This pattern suggests that selling interest has matched the previous buying pressure, signalling a potential downward move.
Traders often place a stop loss above the high of the second candle.
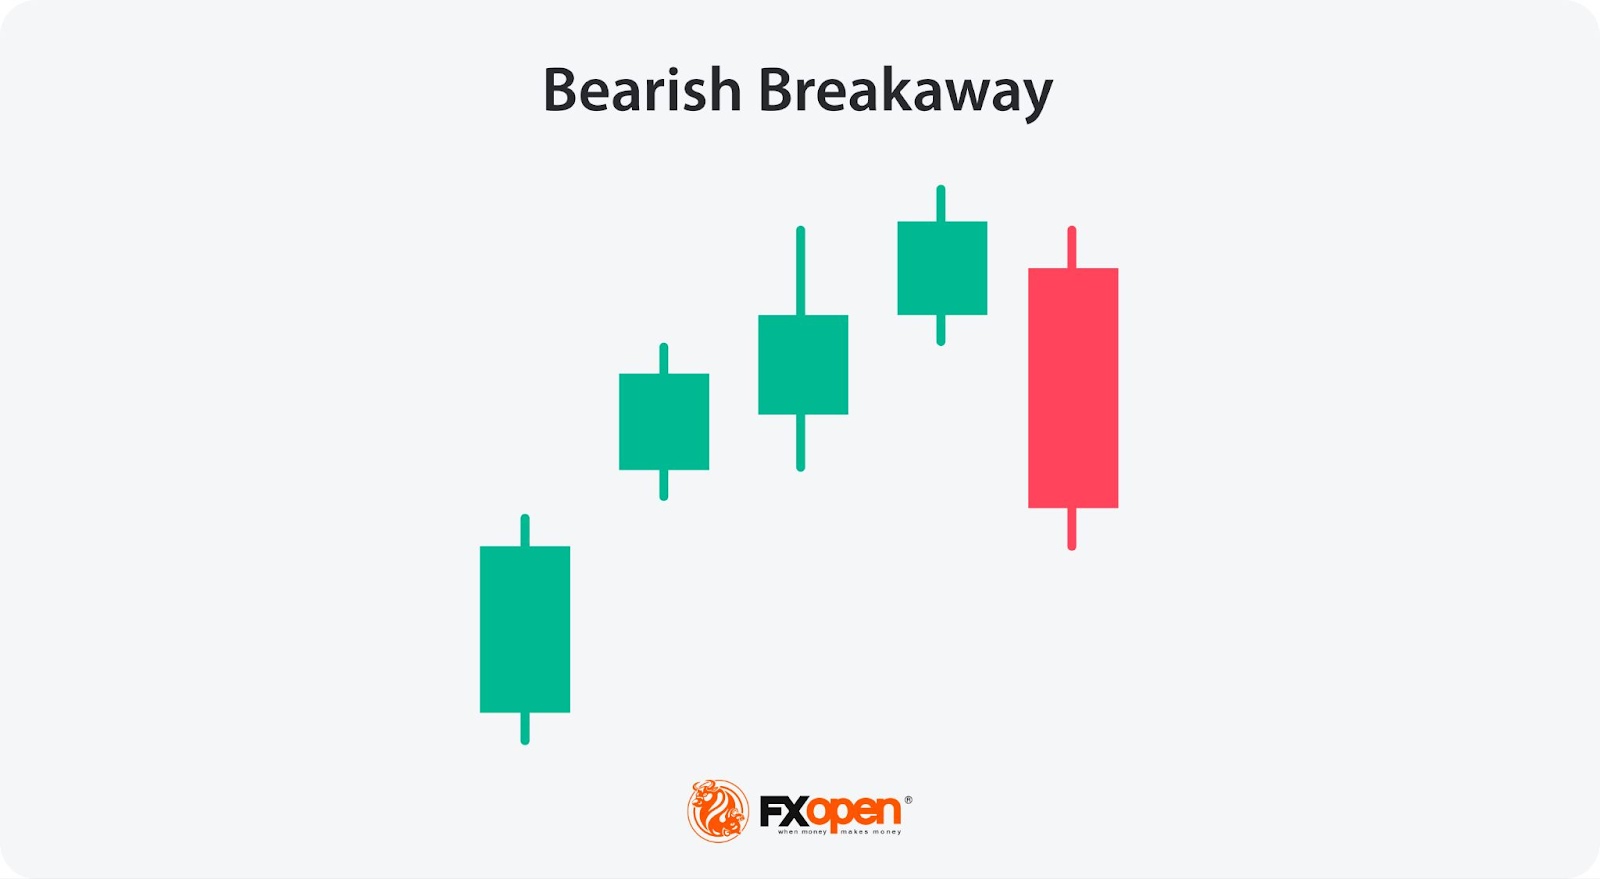
Bearish Breakaway
The Bearish Breakaway pattern signals a potential reversal in market direction after an uptrend. It consists of five candles: the first is a long bullish candle, followed by three smaller candles continuing the uptrend with diminishing momentum. The fifth candle is a large bearish candle that closes either within the gap formed by the first two candlesticks or below the first candle's open. This sequence suggests that buying pressure is waning and selling interest is increasing.
Traders often place a stop loss above the high of the fourth candle.
Continuation/Reversal Patterns
Most candlestick patterns provide reversal signals. However, there are those that signal a potential trend continuation or may provide both reversal and continuation signs, so traders should analyse market conditions carefully.
Doji Candlestick Patterns
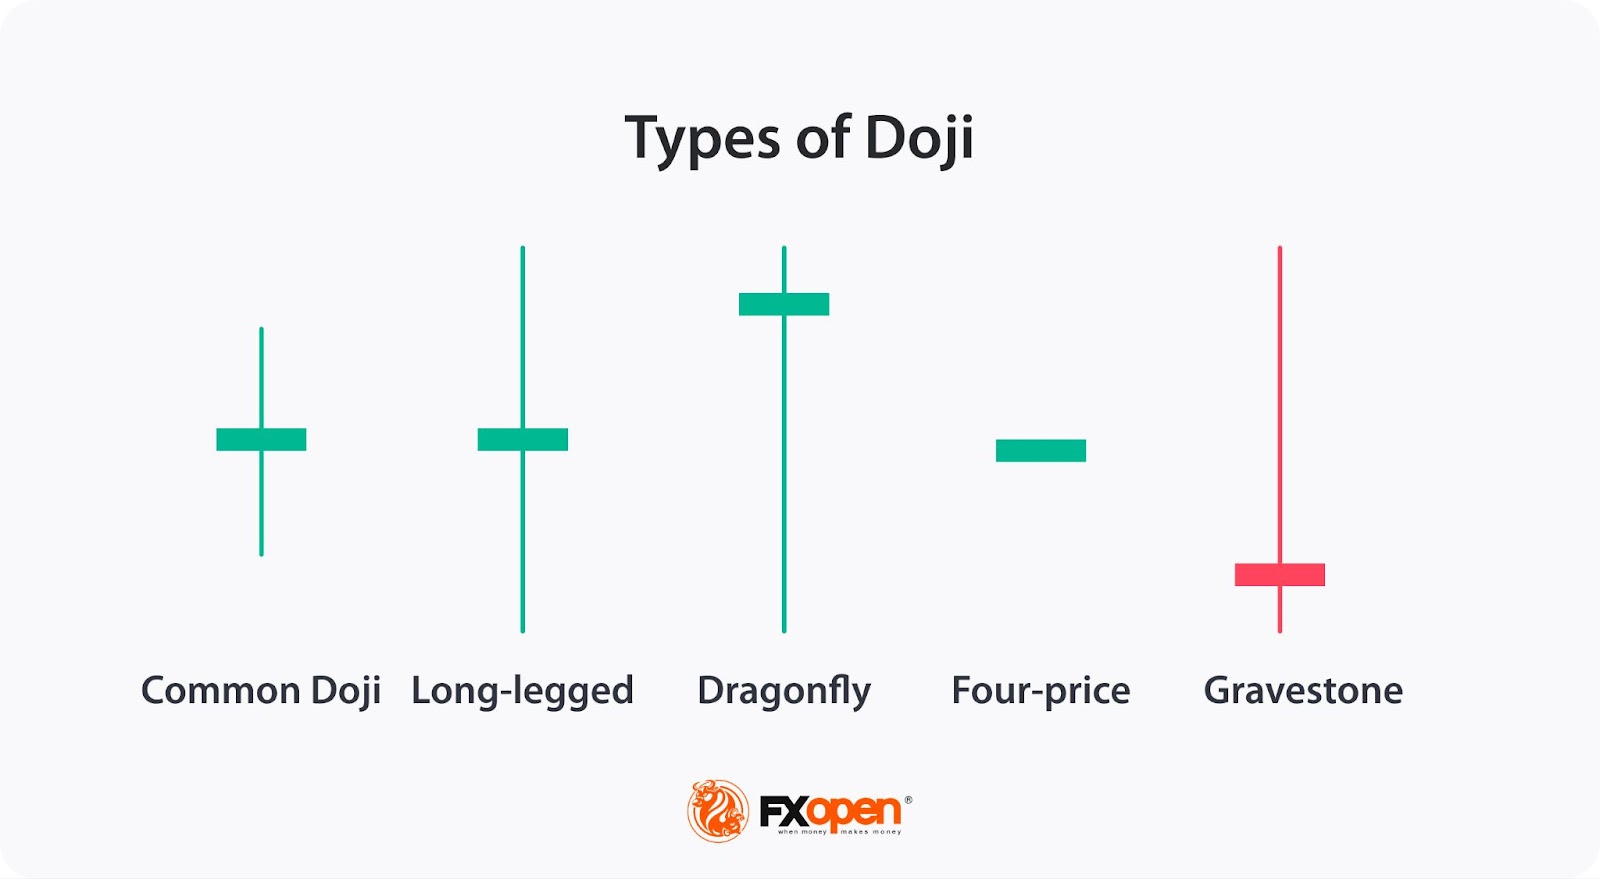
Doji candlestick patterns are important indicators of market indecision, where the opening and closing prices are nearly identical. They can signify potential reversals or areas of uncertainty in the market. There are five major candlestick types of Doji, each with unique characteristics and implications for traders.
Standard Doji
A Standard Doji forms when the open and close prices are almost equal, resulting in a small body. This pattern indicates a balance between buyers and sellers, suggesting market indecision. It often appears after significant price movements, signalling a potential reversal or pause in the current trend.
Long-Legged Doji
The Long-Legged Doji features long upper and lower wicks, showing high volatility and significant price swings during the session. This type of Doji reflects extreme indecision, as neither buyers nor sellers can maintain control, highlighting a possible turning point in the market.
Dragonfly Doji
The Dragonfly Doji has a long lower wick and little to no upper wick. It forms when the open and close prices are at or near the high of the candle. This formation suggests that sellers dominated early, but buyers regained control, pushing prices back up, indicating a potential bullish reversal.
Gravestone Doji
The Gravestone Doji is characterised by a long upper wick and minimal lower wick. It occurs when the open and close prices are at or near the low of the day. This pattern reflects initial buying pressure that was overwhelmed by sellers, pointing to a possible bearish reversal.
Four-Price Doji
The Four-Price Doji is a rare pattern where the open, high, low, and close prices are identical, forming a tiny, horizontal line. This extreme form of indecision shows a standoff between buyers and sellers, often preceding significant price movement as the market resolves this uncertainty.
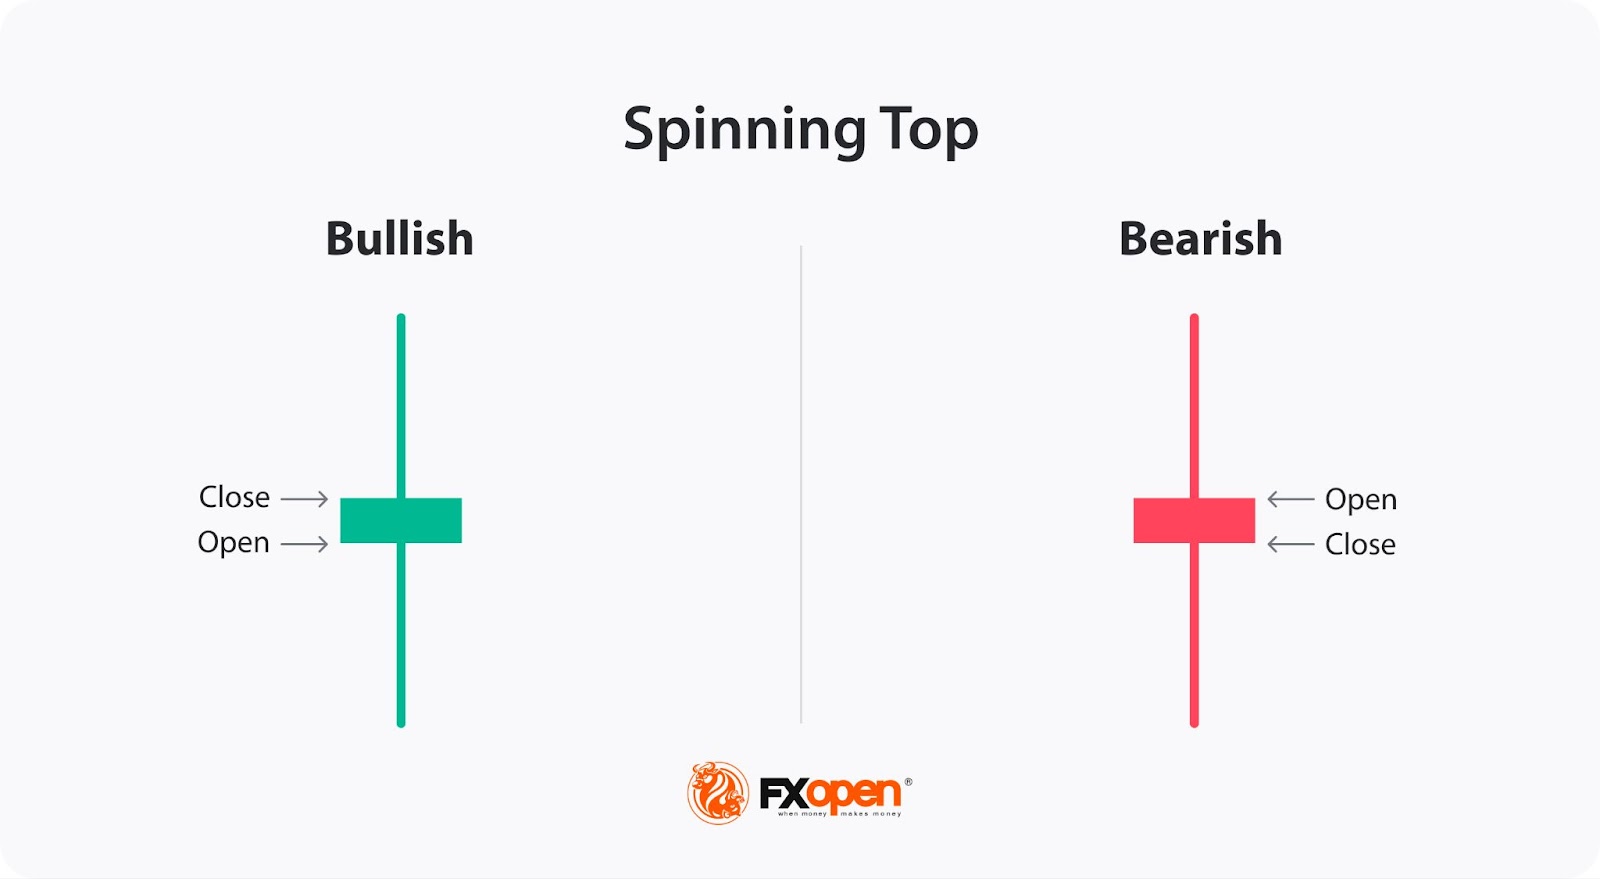
Spinning Top
The Spinning Top is a candlestick pattern indicating indecision in the market, where neither buyers nor sellers can gain control. It has a small body with long upper and lower wicks, showing that prices moved significantly during the session but closed near the opening price. This pattern suggests a potential pause or reversal in the current trend.
Traders interpret Spinning Tops as signs of market uncertainty and look for confirmation from subsequent candles to gauge the next move.
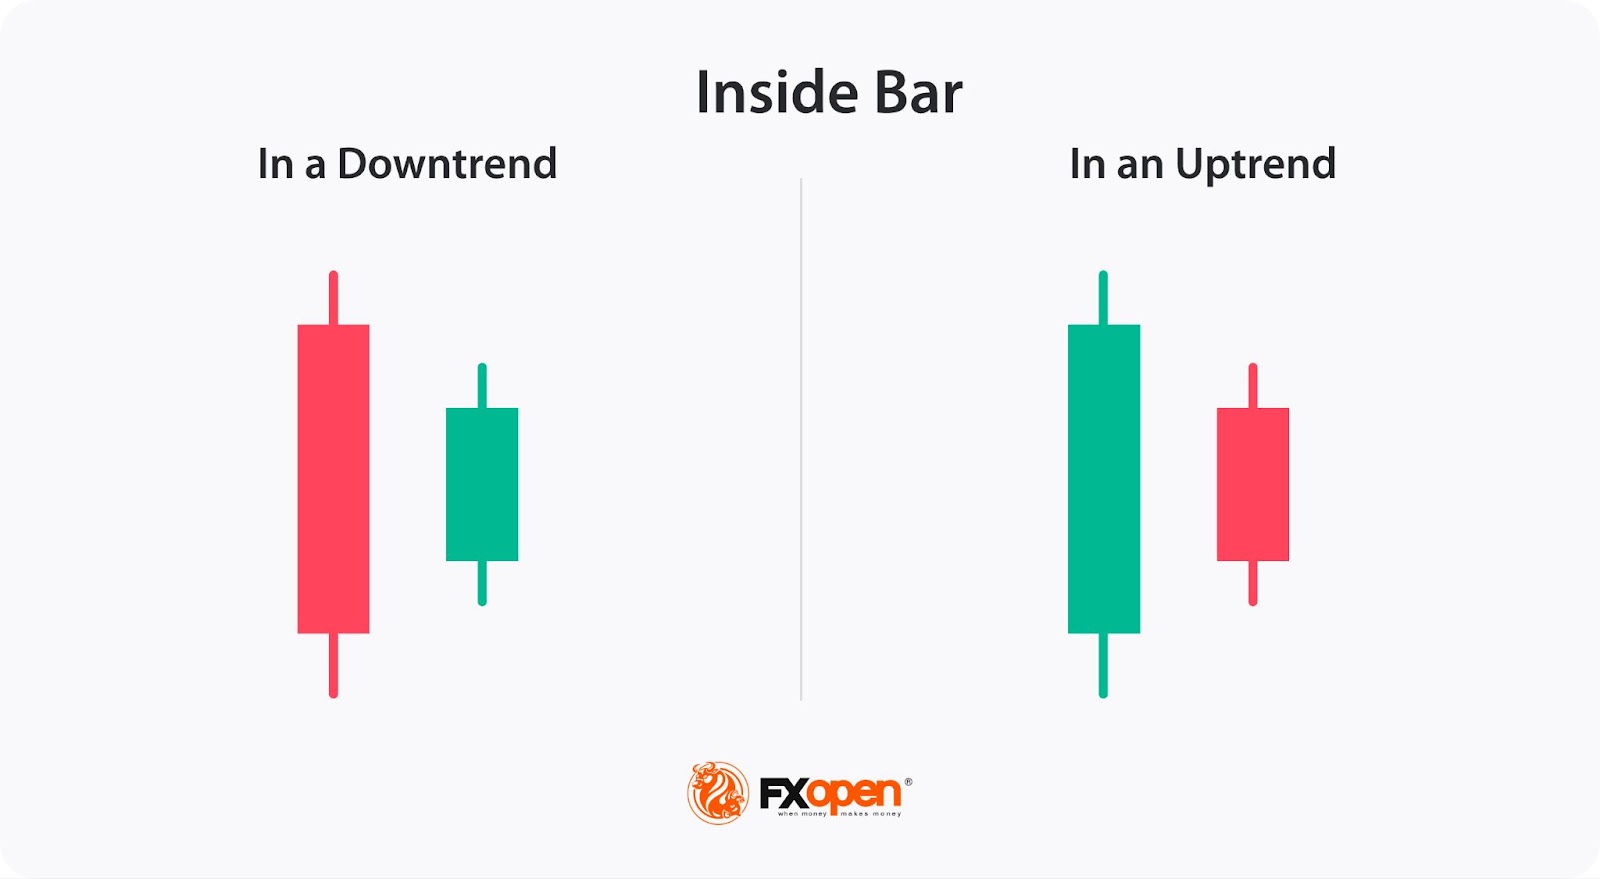
Inside Bar Pattern
The Inside Bar pattern consists of a smaller candle entirely within the range of the previous, larger candle. This pattern indicates consolidation and a decrease in volatility, often signalling a potential breakout in either direction. It reflects a period of indecision or equilibrium between buyers and sellers.
Traders look for this formation to identify upcoming volatility and potential trend continuation or reversal. The Inside Bar is essential for recognising moments when the market is gathering momentum for a significant move.
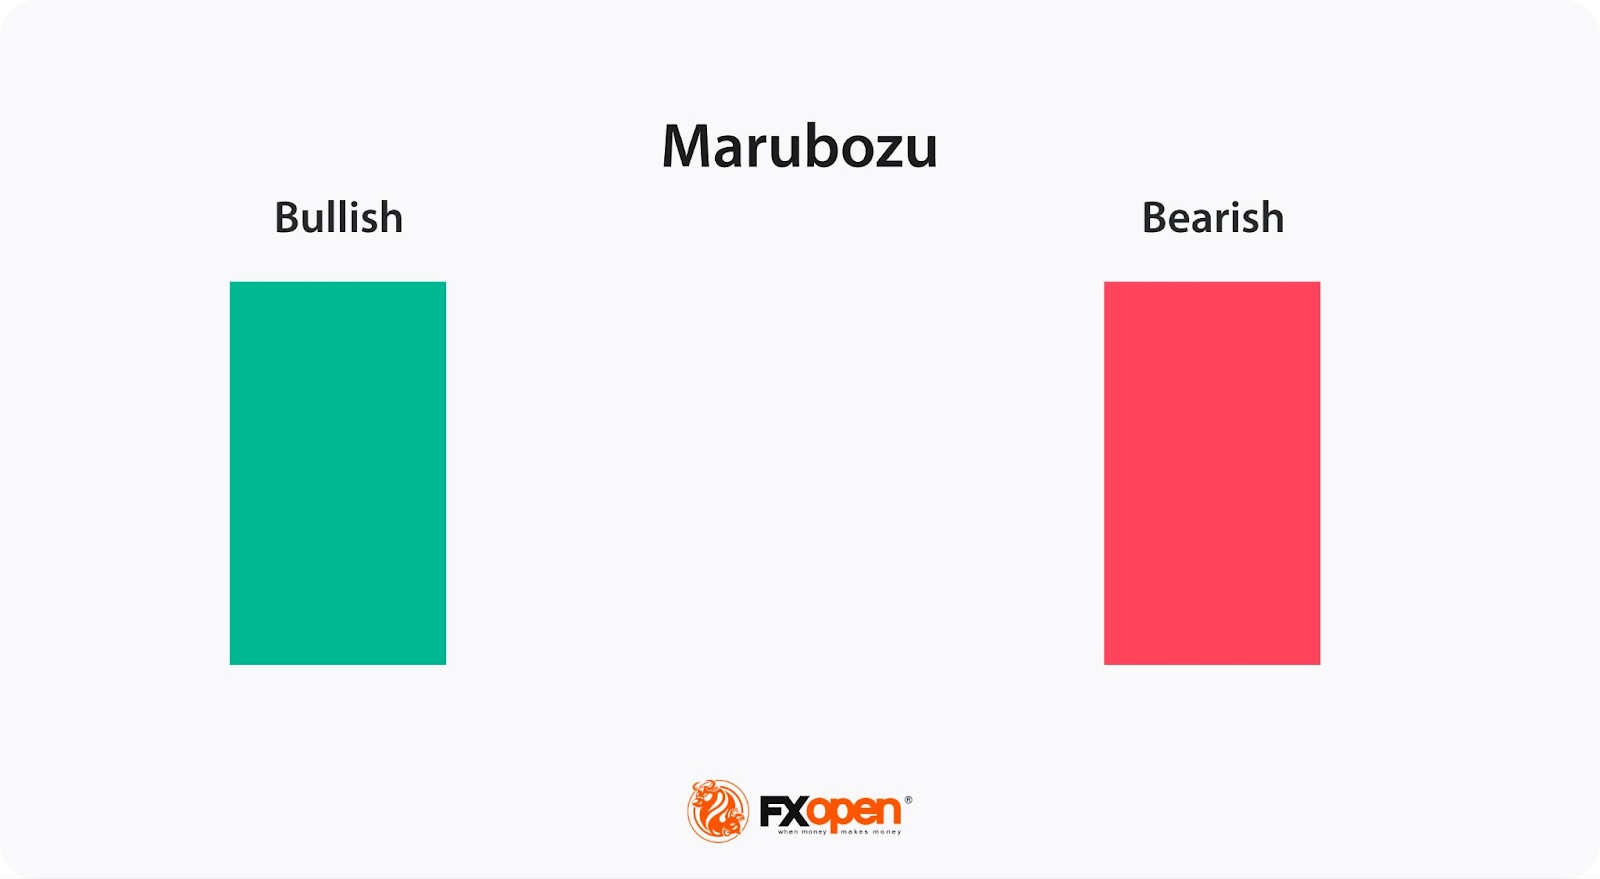
Marubozu
The Marubozu candlestick pattern is characterised by a long body with no wicks, indicating strong buying or selling pressure. In a bullish Marubozu, the candle opens at its low and closes at its high, showing consistent buying throughout the session. Conversely, a bearish Marubozu opens at its high and closes at its low, reflecting sustained selling pressure.
This pattern is significant for traders as it suggests a clear, strong momentum in the direction of the candle, signalling either the continuation or a reversal of the trend.
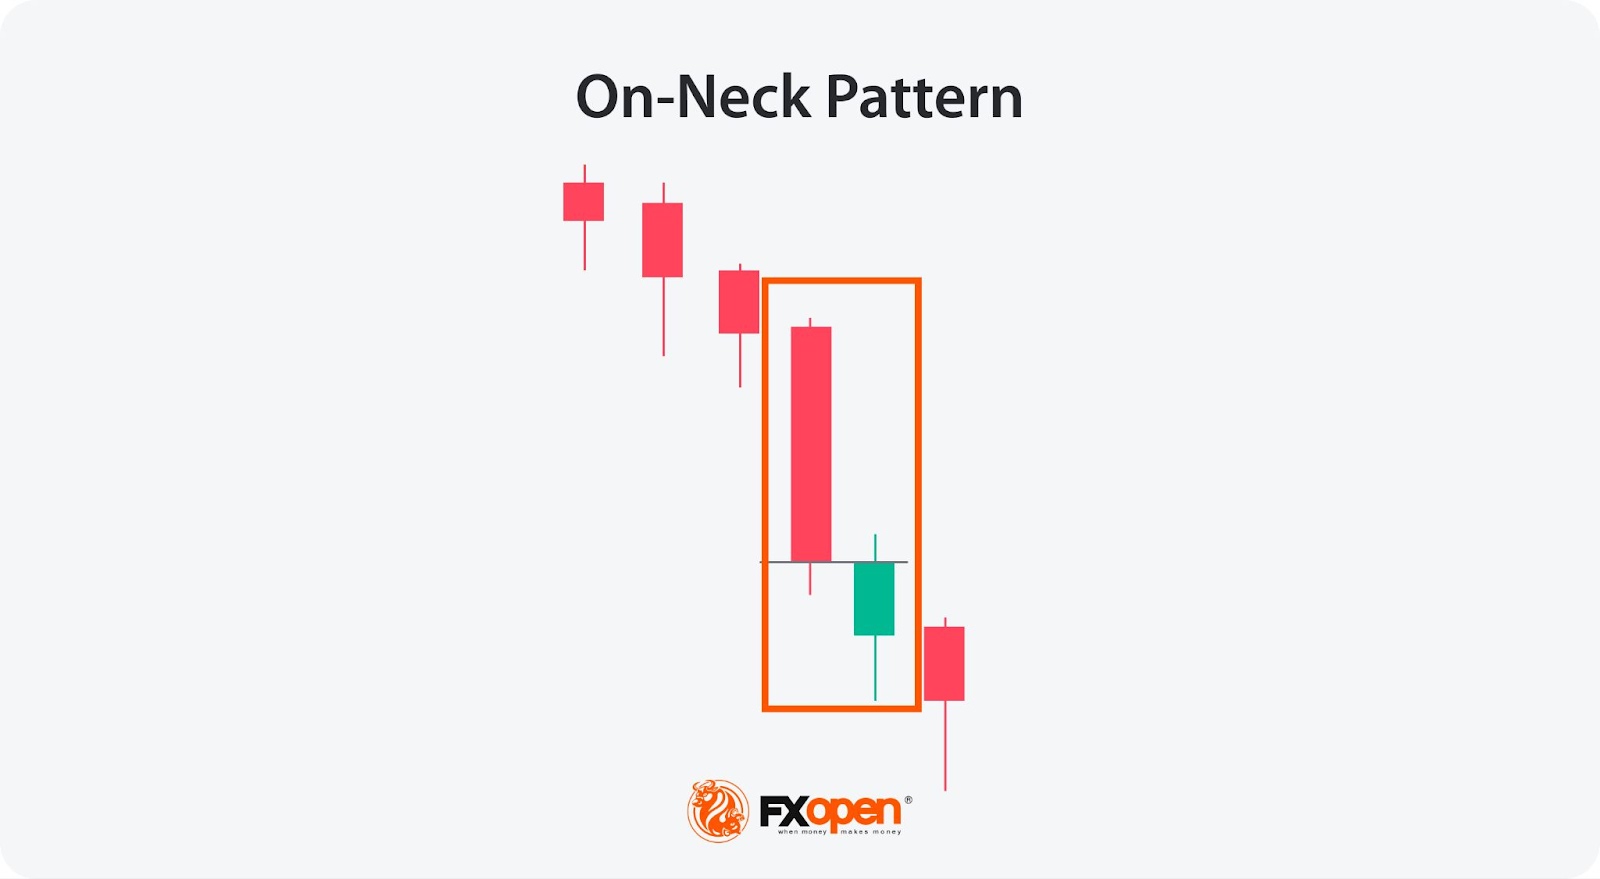
On-Neck Pattern
The On-Neck is a bearish continuation pattern found after a downtrend. It consists of a long bearish candle followed by a smaller bullish or bearish candle that opens below the first candle's close but closes near its close price. This formation indicates a brief pause in selling pressure, with sellers maintaining control. Traders interpret this formation as a signal that the downtrend will likely continue.
The On-Neck Pattern helps traders recognise temporary consolidation periods within a larger downward movement, preparing for further declines.
The Bottom Line
Mastering different types of candlesticks and their unique patterns may enhance trading strategies and decision-making. These formations provide crucial insights into market dynamics, helping traders anticipate potential price movements. Open an FXOpen account today to apply this knowledge and take advantage of comprehensive trading tools and resources.
FAQs
How Many Candlestick Patterns Are There?
There is no set number of candlestick patterns. However, there are the most frequently used patterns. These patterns can be broadly categorised into reversal and continuation formations. While mastering all patterns can be beneficial, traders often focus on the most popular ones for practical application.
How to Read Candle Patterns?
Reading candle patterns involves analysing the shape, the body and wicks, and the position of candlesticks within a price chart. Traders look for specific configurations that signal potential market turns or continuations, using these insights to inform trading decisions.
What Are the 4 Parts of a Candlestick?
A candlestick comprises four parts: the open, high, low, and close (OHLC) prices. The body represents the open-to-close range, with the colour indicating price direction (typically green for up, red for down). The wicks (or shadows) show the high and low prices within a particular period.
Are Candlesticks Enough for Trading?
Candlesticks provide valuable insights but should not be the sole basis for trading decisions. Potentially effective trading often combines candlestick analysis with other technical indicators, fundamental analysis, and risk management strategies to create a comprehensive approach.
How Many Minutes Candle Is Best for Trading?
The optimal candle duration depends on the trading style. Day traders might prefer 1-minute or 5-minute candles for quick insights, while swing traders might use hourly, 4-hour, or daily candles to capture broader trends. It’s essential to match the timeframe with the trader’s strategy and objectives.
Do Professional Traders Use Candlestick Patterns?
Yes. Across forex, commodities, cryptocurrencies*, and stocks, candle patterns are used by professional traders as part of their technical analysis toolkit. These patterns help identify potential market movements and inform trading strategies. However, professionals also integrate other tools and analyses to enhance decision-making and manage risk effectively.
*At FXOpen UK and FXOpen AU, Cryptocurrency CFDs are only available for trading by those clients categorised as Professional clients under FCA Rules and Professional clients under ASIC Rules, respectively. They are not available for trading by Retail clients.
This article represents the opinion of the Companies operating under the FXOpen brand only. It is not to be construed as an offer, solicitation, or recommendation with respect to products and services provided by the Companies operating under the FXOpen brand, nor is it to be considered financial advice.
Stay ahead of the market!
Subscribe now to our mailing list and receive the latest market news and insights delivered directly to your inbox.


Latest articles

Market Analysis: GBP/USD Dips Further As EUR/GBP Regains Traction
GBP/USD failed to climb above 1.3500 and corrected some gains. EUR/GBP started a decent increase and might aim for more gains above 0.8700.
Important Takeaways for GBP/USD and EUR/GBP Analysis Today
· The British Pound


Market Insights with Gary Thomson: Oil, US Retail Sales & NFP in Focus
In this video, we’ll explore the key economic events and market trends, shaping the financial landscape. Get ready for insights into financial markets to help you navigate the week ahead. Let’s dive in!
In this episode of Market