


FXOpen

Candlestick patterns are widely used in technical analysis to identify potential shifts in market sentiment and price momentum. One formation that traders frequently monitor during market declines is the inverted hammer candlestick pattern.
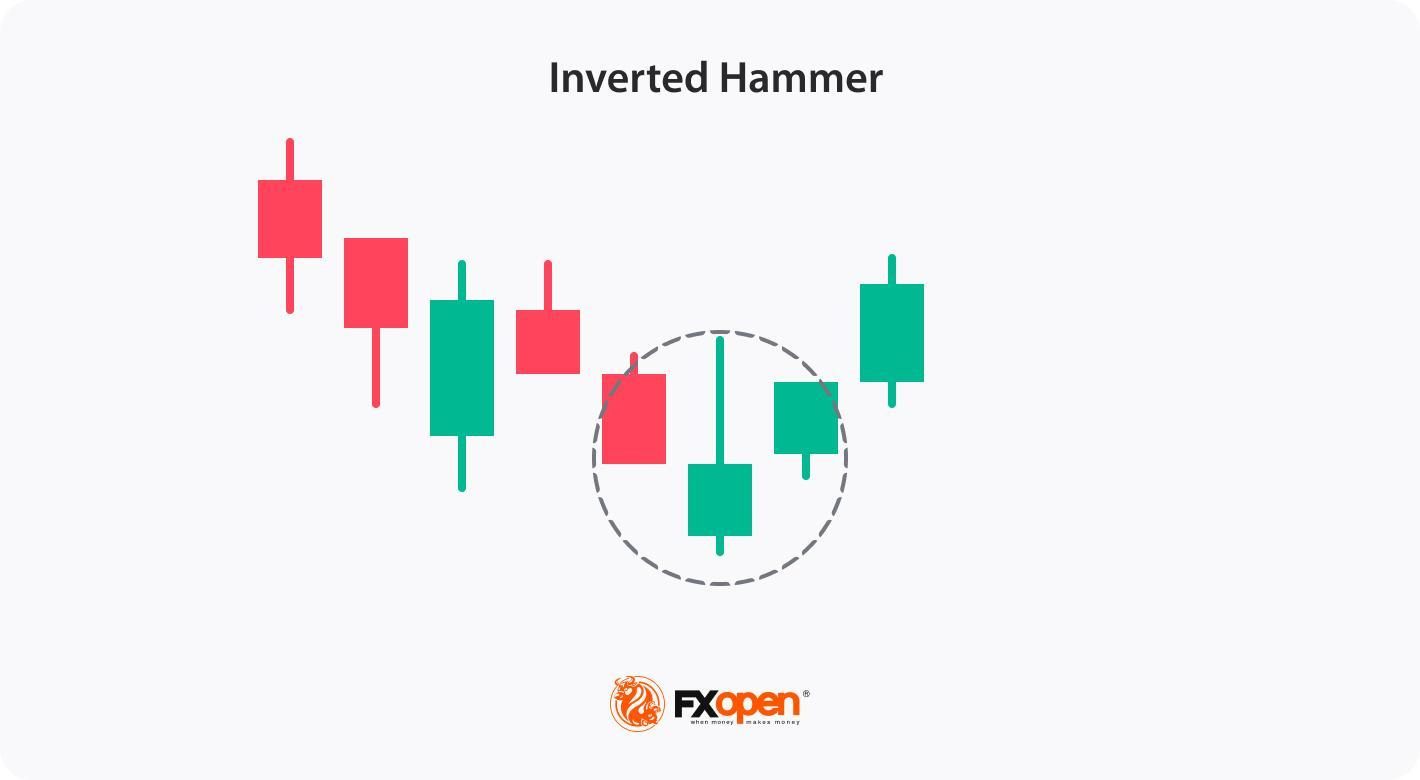
An inverted hammer is a single-candle formation characterised by a small real body near the lower end of the price range and a long upper shadow, typically at least twice the length of the body, with little or no lower shadow. It usually appears after a downtrend and may indicate that buyers attempted to push prices higher during the session, suggesting that selling pressure could be weakening.
In this article, we explain the meaning of the inverted hammer candlestick, examine its key characteristics, outline how traders identify it on charts, and discuss common ways it may be incorporated into technical analysis and trading strategies.
What Is an Inverted Hammer?
An inverted hammer is a candlestick pattern that appears at the end of a downtrend, typically signalling a potential bullish reversal. It has a distinct shape—a small body at the lower end of the candle and a long upper wick that is at least twice the size of the body. This structure suggests that although sellers initially dominated, buyers stepped in, pushing prices higher. While the inverted hammer alone does not confirm a reversal, it’s often considered a sign of a possible trend change when followed by a bullish move on subsequent candles.
The pattern can have any colour so that you can find a red inverted hammer candlestick or upside down green hammer. Although both will signal a bullish reversal, an inverted green hammer candle is believed to provide a stronger signal, reflecting the strength of bulls.
One of the unique features of this pattern is that traders may apply it to various financial instruments, such as stocks, cryptocurrencies*, ETFs, indices, and forex, across different timeframes. To test strategies with an inverted hammer formation, you may consider using FXOpen’s TickTrader trading platform, which provides access to over 700 markets.
Hammer Candlestick vs Inverted Hammer
The hammer candlestick pattern and inverted hammer are both single-candle patterns that appear in downtrends and signal potential bullish reversals, but they have distinct formations and implications:
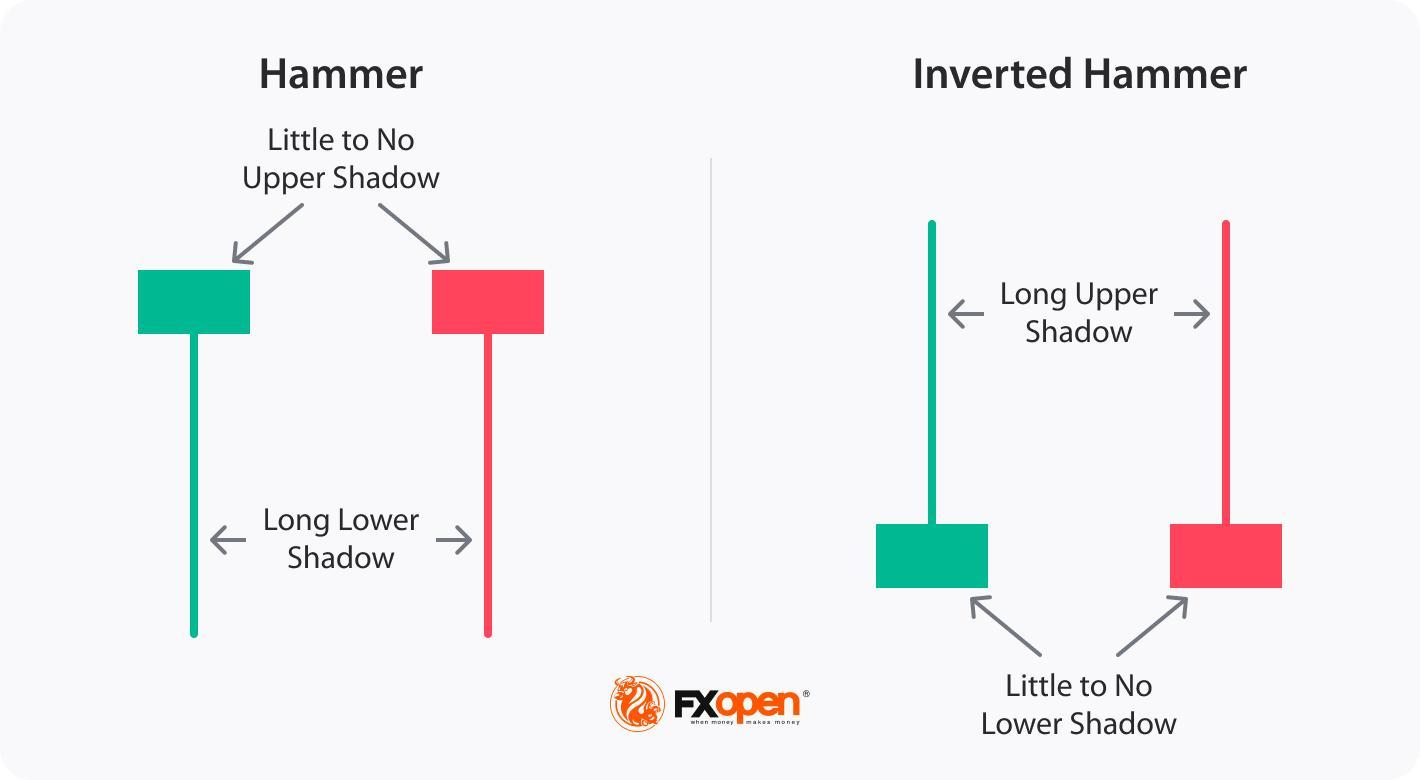
- Hammer: The reversal hammer candle has a small body at the top with a long lower wick, indicating that buyers pushed prices back up after a period of selling pressure. This bullish hammer pattern shows that sellers were initially strong, but buyers regained control, potentially signalling a reversal.
- Inverted Hammer: The inverted hammer, by contrast, has a small body at the bottom with a long upper wick. This structure indicates initial buying pressure, but sellers prevented a complete takeover. This pattern suggests that buyers may soon regain strength, hinting at a possible trend reversal.
Both patterns signal possible bullish sentiment, but while the green or red hammer candlestick focuses on buyer strength after selling, the inverted hammer suggests buyer interest in an overall bearish context, needing further confirmation for a trend shift.
How Traders Identify the Inverted Hammer Candlestick in Charts
Although the inverted hammer is a recognisable pattern, traders often apply additional rules to potentially strengthen the reversal signal it provides.
Step 1: Identify the Pattern in a Downtrend
- Traders ensure the market is in a downtrend, as the inverted hammer is only significant when it appears after a period of sustained selling pressure.
- Then, they look for a candlestick with a small body at the lower end and a long upper wick that’s at least twice the size of the body. This upper shadow shows initial buying pressure followed by selling, suggesting a potential reversal in sentiment.
Step 2: Choose Appropriate Timeframes
- The pattern can appear across various timeframes, but higher timeframe charts are more popular among traders, as shorter timeframes, like 5 or 15-minute charts, may provide false signals.
Step 3: Use Indicators to Strengthen Identification
- Volume: A rise in bullish trading volume after the inverted hammer can indicate stronger interest from buyers, increasing the likelihood of a trend reversal.
- Oscillators: Oscillators like Stochastic, Awesome Oscillator, or RSI showing an oversold reading alongside the candle can further suggest that the asset might be due for a reversal.
Step 4: Look for Confirmation Signals
- Gap-Up Opening: A gap-up opening in the next trading session indicates buyers stepping in, giving further weight to the bullish reversal.
- Bullish Candle: Following the inverted hammer with a strong bullish candle confirms that buying pressure has continued. This is a key signal that a trend reversal may be underway.
By following these steps and waiting for confirmation signals, traders might increase the reliability of the inverted hammer’s signals.
Trading the Inverted Hammer Candlestick Pattern: Real-Market Examples
Inverted hammer trading is based on a systematic approach to potential bullish reversals. Here are some steps traders may consider:
- Identify the Inverted Hammer: Spot the setup on a price chart by following the rules discussed earlier.
- Assess the Context: Analyse the broader market context and consider the pattern's location within the prevailing trend. Look for support levels, trendlines, or other significant price areas that could strengthen the reversal signal.
- Set an Entry: Candlestick patterns don’t provide accurate entry and exit points as chart patterns or some indicators do. However, traders can consider some general rules. Usually, traders wait for at least several candles to be formed upwards after the pattern is formed.
- Set Stop Loss and Take Profit Levels: The theory states that traders use a stop-loss order to limit potential losses if the trade doesn't go as anticipated. It may be placed below the low of the candlestick or based on a risk-reward ratio. The take-profit target might be placed at the next resistance level.
Inverted Hammer Candlestick: Live Market Example
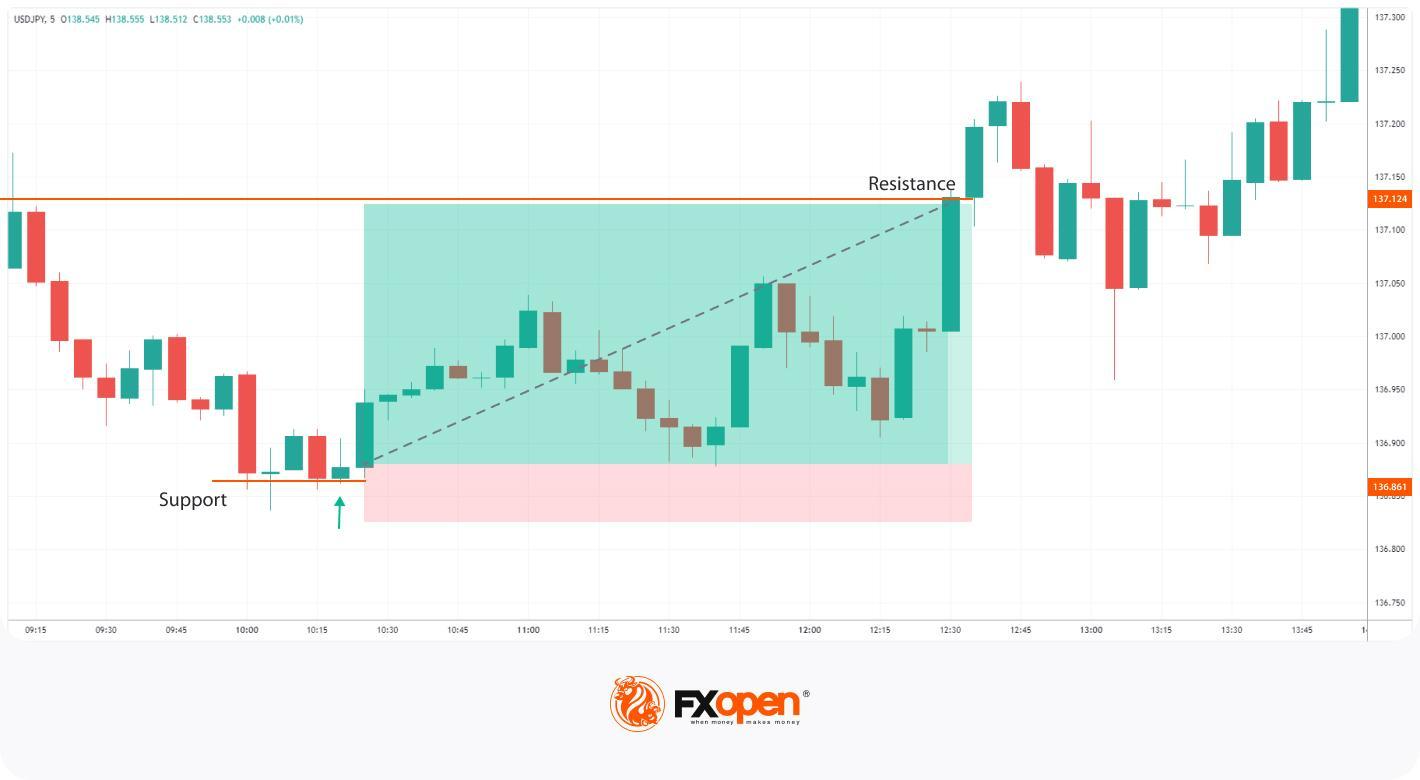
The trader looks for a bullish inverted hammer on the USDJPY chart. After a subsequent downtrend, the inverted hammer appearing at a support level signals a potential trend reversal. They enter the market at the close of the inverted hammer candle and place a stop loss below the support level. Their take-profit target is at the next resistance level.
A trader could implement a more conservative approach and wait for at least a few candles to form in the uptrend direction. However, as the pattern was formed at the 5-minute chart, a trader could enter the market too late or with a poor risk-reward ratio.
Advantages and Limitations of the Inverted Hammer
The inverted hammer has its strengths and limitations. Here’s a closer look:
Advantages
- Recognisable: The pattern has a unique shape, making it accessible for traders at all experience levels.
- Can Be Spot in Different Markets: The candle can be found on charts of different assets across all timeframes.
- Clear Idea: When it appears on a chart, it reflects a trend reversal, allowing traders to incorporate it into broader trading strategies, especially when there are additional confirming signals.
Limitations
- Reliability Depends on Confirmation: The candle alone does not guarantee a market reversal; it requires confirmation from the next candlestick or other indicators. Without this, the reversal signal may be weak.
- Works Only in Strong Downtrends: The pattern might be more useful in strong downtrends; in ranging or weak trends, it generates less reliable signals.
- False Signals Can Occur: False signals are possible, especially in volatile markets. Over-reliance on this pattern without additional analysis may lead to poor trade outcomes.
Final Thoughts
While the inverted hammer can provide valuable insights into potential trend reversals, it should not be the sole basis for trading decisions. It is important to supplement analysis with other technical indicators and tools to strengthen the overall trading strategy. Also, risk management is crucial while trading this formation.
If you want to develop your own trading strategy, you may consider opening an FXOpen account and access over 700 markets with tight spreads from 0.0 pips and low commissions from $1.50.
FAQ
Is an Inverted Hammer Bullish?
Yes, it is considered a bullish reversal pattern. It indicates a potential shift from a downtrend to an uptrend in the market. While it may seem counterintuitive due to its name, the setup suggests that buying pressure has overcome selling pressure and that bulls are gaining strength.
How Can an Inverted Hammer Be Traded?
When using an inverted hammer, traders wait for confirmation in the next session, such as a gap-up or strong bullish candle. They usually open a buy position with a stop-loss below the low of the pattern to potentially manage risk and a take-profit level at the closest resistance level.
Is the Inverted Hammer a Trend Reversal Signal?
It is generally considered a potential trend reversal signal. An inverted hammer in a downtrend suggests a shift in market sentiment from bearish to bullish. An inverted hammer in an uptrend does not signify anything.
What Happens After a Reverse Hammer Candlestick?
After a reverse (or inverted) hammer candle, there may be a potential bullish reversal if confirmed by a strong bullish candle in the next session. However, without confirmation, the pattern alone does not guarantee a trend change.
Can an Inverted Hammer Candlestick Be Traded in an Uptrend?
In an uptrend, an inverted hammer isn’t generally considered significant because it’s primarily a reversal signal in a downtrend.
Are Inverted Hammer and Shooting Star the Same?
No, the inverted hammer and shooting star look similar but occur in opposite trends; the former appears in a downtrend as a bullish reversal signal, while the latter appears in an uptrend as a bearish reversal signal.
What Is the Difference Between a Hanging Man and an Inverted Hammer?
The hanging man and inverted hammer differ in both appearance and context. The former appears at the end of an uptrend as a bearish signal and has a small body and a long lower shadow, while the latter appears at the end of a downtrend as a bullish signal and has a small body and a long upper shadow.
What Is the Difference Between Red and Green Inverted Hammer Candlesticks?
A bullish (green) inverted hammer candlestick closes higher than its opening price, indicating a stronger bullish sentiment. A bearish (red) inverted hammer candlestick closes lower than its opening, which might indicate less buying strength, but both colours may signal a reversal if followed by confirmation.
*Important: At FXOpen UK, Cryptocurrency trading via CFDs is only available to our Professional clients. They are not available for trading by Retail clients. To find out more information about how this may affect you, please get in touch with our team.
This article represents the opinion of the Companies operating under the FXOpen brand only. It is not to be construed as an offer, solicitation, or recommendation with respect to products and services provided by the Companies operating under the FXOpen brand, nor is it to be considered financial advice.
Stay ahead of the market!
Subscribe now to our mailing list and receive the latest market news and insights delivered directly to your inbox.


Latest articles

Tesla (TSLA) Shares Surge Following Musk’s Announcements
According to the chart, Tesla (TSLA) shares had been under significant pressure since the start of 2026: from their December high, they had lost around 25% of their value. The main bearish drivers included:
→ Intense competition from Chinese automakers, particularly

XTI/USD Analysis: WTI Oil Prices Under Pressure from Trump’s Statements
Yesterday, following a false bullish breakout above the psychological $100 level, WTI crude prices fell sharply towards the $85 area. The primary driver of this rapid decline was comments made by the US President.
According to Donald Trump:
→ the United
