


FXOpen
Technical analysis indicators are essential tools for traders to analyse every aspect of market movements, including market trends, momentum, volume, and volatility. This article explores ten key technical indicators you could add to your toolkit. Read detailing definitions, uses, and the signals they provide to potentially enhance trading strategies.
To get started with these indicators, head over to FXOpen’s free TickTrader trading platform.
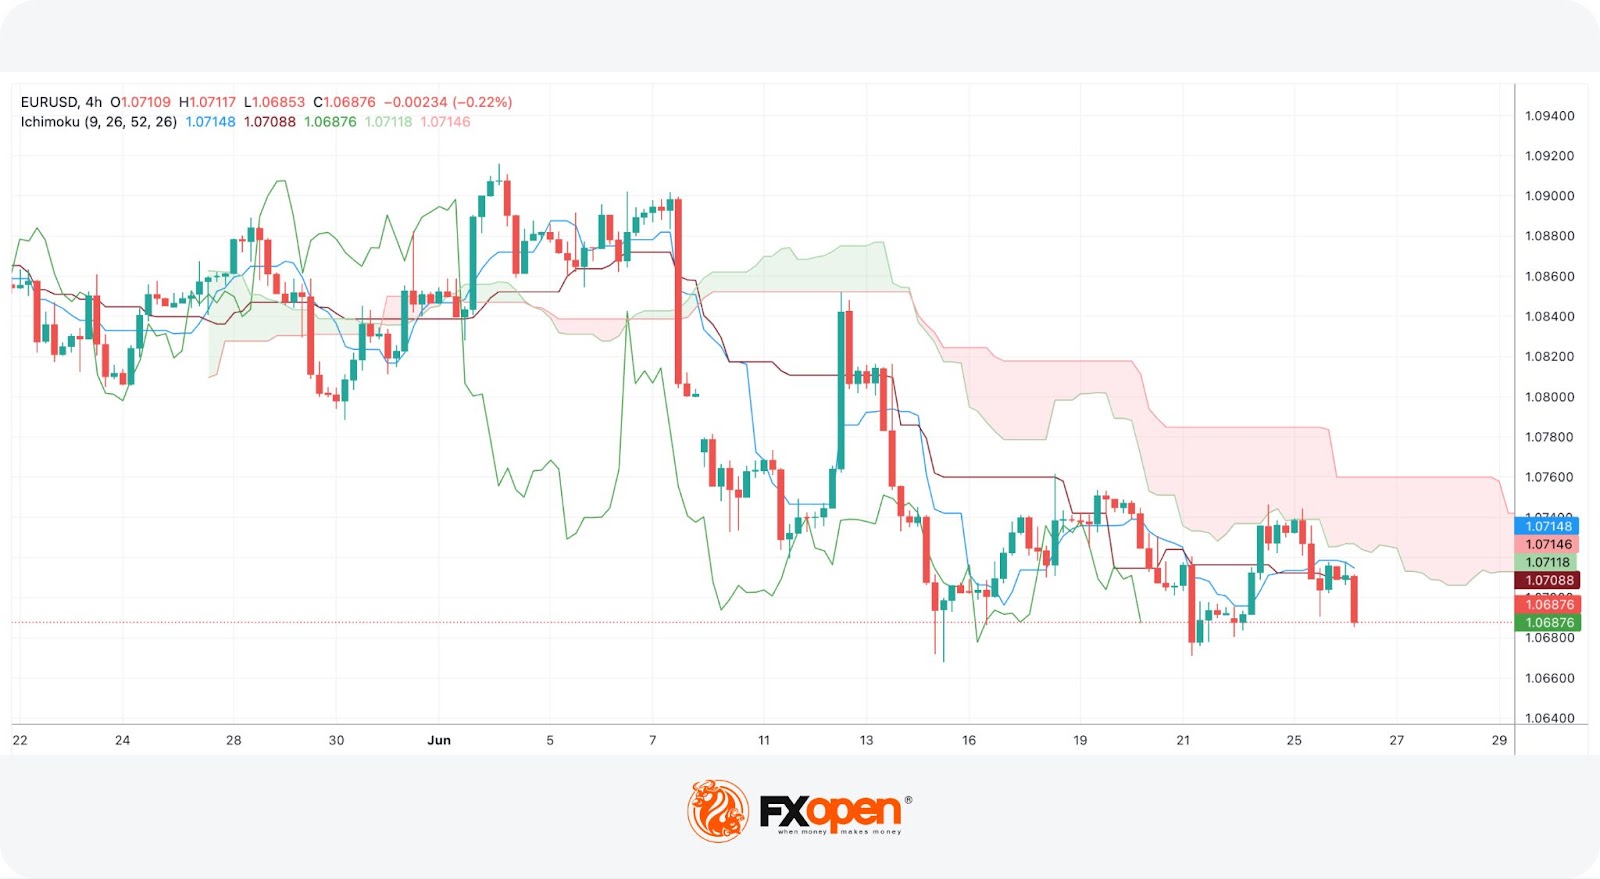
Ichimoku Cloud
The Ichimoku Cloud, also known as Ichimoku Kinko Hyo, is a comprehensive technical analysis tool designed to provide a clear picture of market trends, momentum, and support and resistance levels. Considered one of the best stock market indicators, this Japanese tool is widely used for its ability to offer a panoramic view of the market.
Definition
The Ichimoku Cloud comprises five main components:
- Tenkan-sen (Conversion Line): The average of the highest high and the lowest low over the past 9 periods.
- Kijun-sen (Base Line): The average of the highest high and the lowest low over the past 26 periods.
- Senkou Span A (Leading Span A): The average of the Tenkan-sen/Conversion Line and Kijun-sen/Base Line, offset by 26 periods ahead.
- Senkou Span B (Leading Span B): The average of the highest high and lowest low over the past 52 periods, plotted 26 periods ahead.
- Chikou Span (Lagging Span): The most recent closing price positioned 26 periods behind.
These components create the "Kumo" or cloud, which projects future support and resistance levels.
Signals
1. TK Cross:
- Bullish Signal: Tenkan-sen crosses above Kijun-sen above the Kumo.
- Bearish Signal: Tenkan-sen crosses below Kijun-sen below the Kumo.
2. Kumo Breakout:
- Bullish Signal: Price breaks above the Kumo.
- Bearish Signal: Price breaks below the Kumo.
3. Chikou Span Confirmation:
- Bullish Signal: Chikou Span is above the price and Kumo.
- Bearish Signal: Chikou Span is below the price and Kumo.
4. Kumo Twist:
- Indicates a potential trend reversal when the cloud changes colour (from red to green for bullish, green to red for bearish).
For cryptocurrency* trading, the standard settings (9, 26, 52) are often adjusted to 20, 60, 120 to accommodate the 24/7 trading cycle. More details on using Ichimoku in crypto* markets can be found on the FXOpen dedicated page.
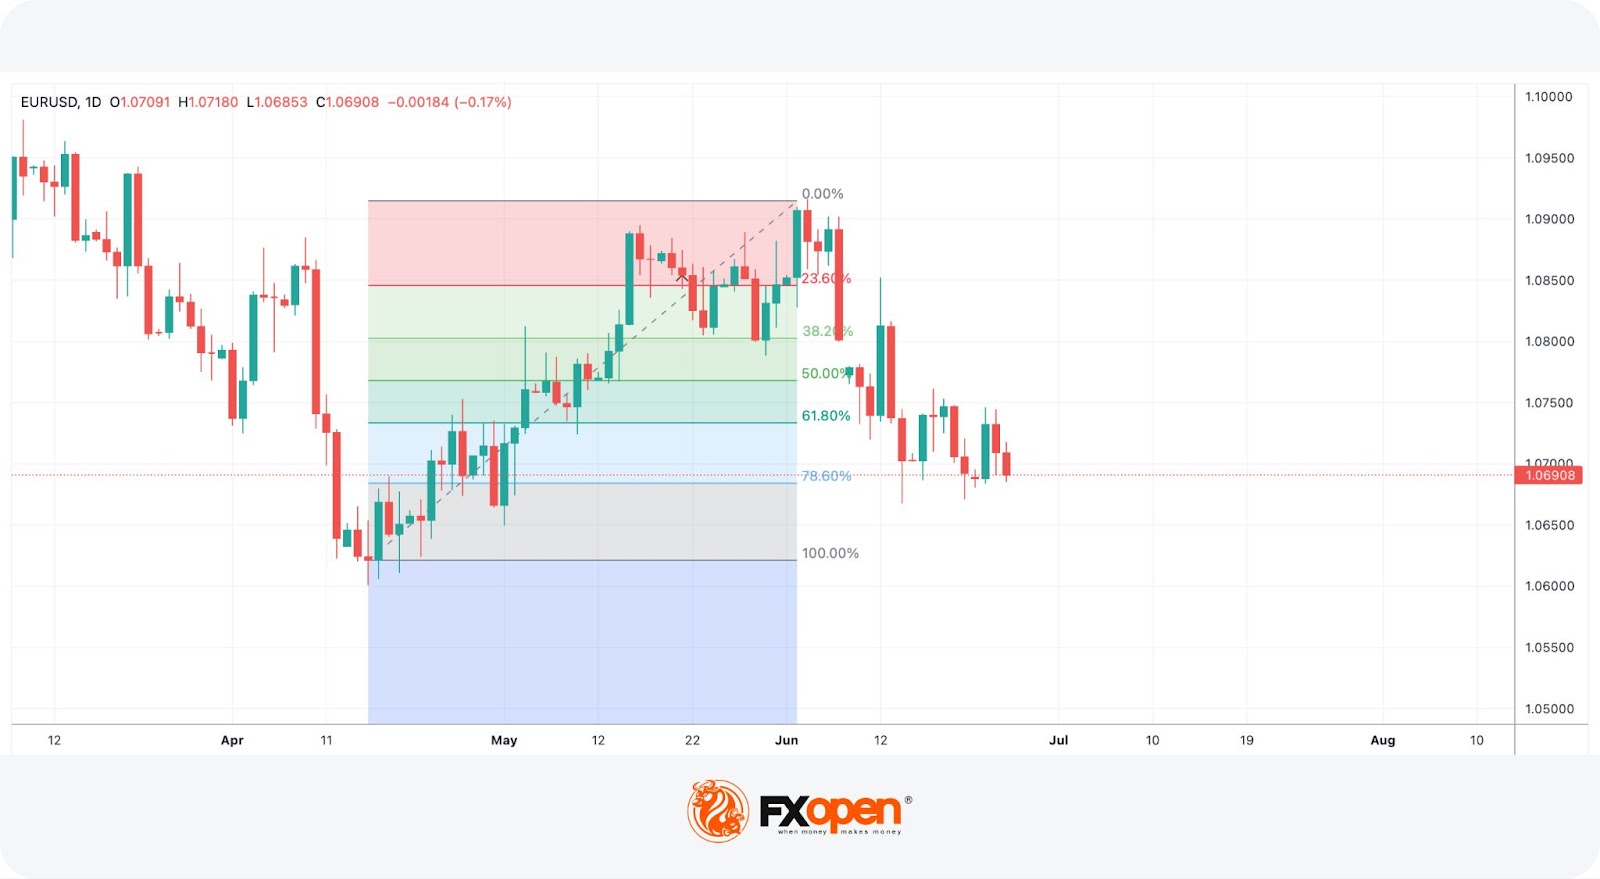
Fibonacci Retracements
Fibonacci retracements are a technical tool that helps traders identify potential areas of support and resistance in a given market. This method is based on the Fibonacci sequence, a series of numbers where each number is the sum of the two preceding ones. In trading, key Fibonacci levels are 38.2%, 50%, and 61.8%, which are used to analyse potential reversal points.
Definition
Fibonacci retracements are widely used stock chart indicators that help traders determine where the price might reverse during a correction in a prevailing trend. The tool involves plotting horizontal lines at these key levels, calculated from a significant high to a significant low when the price corrects after a strong downward movement or from a significant low to a significant high when the price corrects after a strong upward movement.
Signals
1. Support and Resistance Levels:
- 38.2%, 50%, and 61.8% Levels: These are the primary retracement levels where the price is likely to reverse.
2. Trend Identification:
- Uptrend: Place the tool from a swing low to a swing high.
- Downtrend: Place the tool from a swing high to a swing low.
3. Trade Setup:
- Entry Points: Traders often look for the price to reach and react at these levels before entering a trade.
- Stop Loss: Typically set just beyond the nearest Fibonacci level the price targets.
- Take Profit: Targets are often placed at the next Fibonacci level.
For cryptocurrency* trading, settings may vary. We provide a detailed explanation on using Fibonacci retracements in crypto markets with adjustments to fit this unique trading environment.
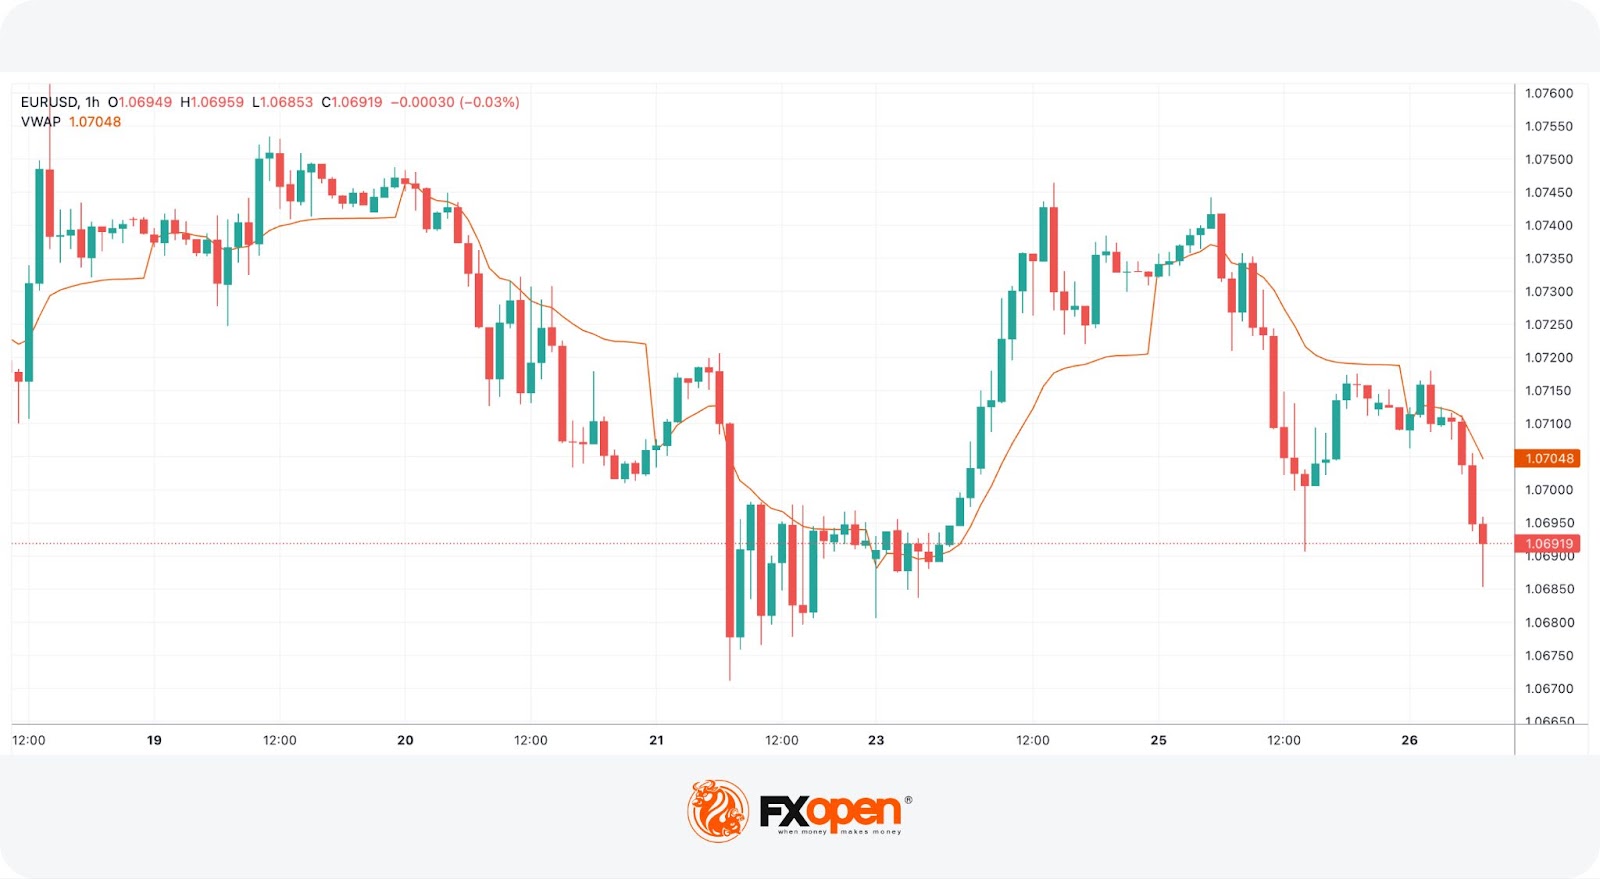
Volume Weighted Average Price (VWAP)
The Volume Weighted Average Price (VWAP) is a technical indicator that provides the average price an asset has traded at throughout a particular period (usually one day), weighted by volume. It offers a more comprehensive view than simple moving averages by incorporating both price and volume data and is considered one of the best intraday trading indicators.
Calculation
VWAP is calculated using the formula:
- VWAP = Sum(Typical Price * Volume) / SumVolume,
where Typical Price is the average of the high, low, and close prices for each period.
Signals
1. Assessing Fair Value: A price above VWAP indicates overvaluation, while a price below suggests undervaluation.
2. Market Sentiment and Trends:
- Bullish Trend: Price above VWAP.
- Bearish Trend: Price below VWAP.
3. Support and Resistance Levels:
- Support: VWAP acts as support in a bullish market.
- Resistance: VWAP acts as resistance in a bearish market.
4. Entry Quality:
- Entry near VWAP suggests buying or selling at a reasonable market value.
For cryptocurrency* trading, the VWAP settings remain similar to traditional markets, but the tool's application may vary due to the 24/7 nature of crypto* trading. Check out FXOpen’s page on how to use VWAP in crypto markets for more information.
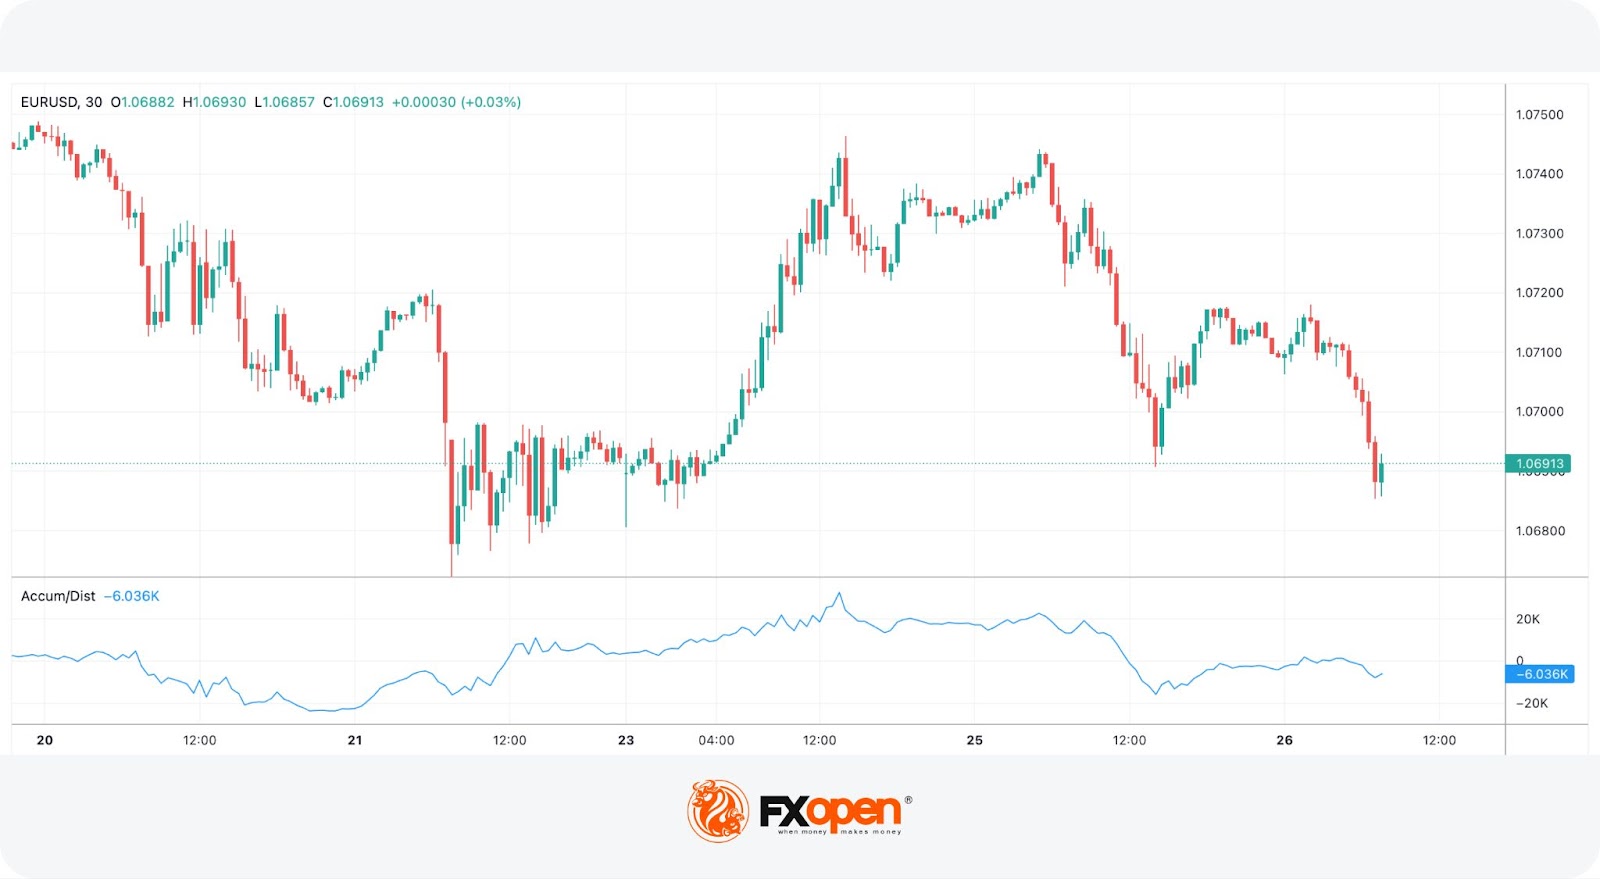
Accumulation/Distribution Indicator (A/D)
The Accumulation/Distribution (A/D) indicator is a volume-based tool that assesses the cumulative flow of money into and out of an asset. It’s widely used as an indicator for day trading. It helps traders determine the underlying buying and selling pressure, making it one of the valuable forex and stock indicators for analysing potential price trends and reversals.
Calculation
The A/D indicator calculates the Money Flow Multiplier (MFM), which ranges from -1 to 1 based on the closing price's position within the period’s high-low range. If the closing price is in the upper half, the MFM is positive; if in the lower half, it is negative. This multiplier is then multiplied by the period’s volume to get the Money Flow Volume (MFV). The A/D line represents the cumulative sum of these MFVs over time, reflecting net volume flow.
Signals
Identifying Reversals:
- Bullish Divergence: Price makes lower lows while the A/D line makes higher lows, indicating waning selling pressure and a potential price increase.
- Bearish Divergence: Price makes higher highs while the A/D line makes lower highs, suggesting decreasing buying pressure and a possible price decline.
Trend Confirmation:
- Uptrend: Both price and A/D line rise, indicating sustained buying pressure.
- Downtrend: Both price and A/D line fall, showing continuous selling pressure.
Trading Breakouts:
- The A/D indicator can confirm breakouts beyond support or resistance levels. A breakout in price aligned with a similar movement in the A/D line signals the start of a new trend.
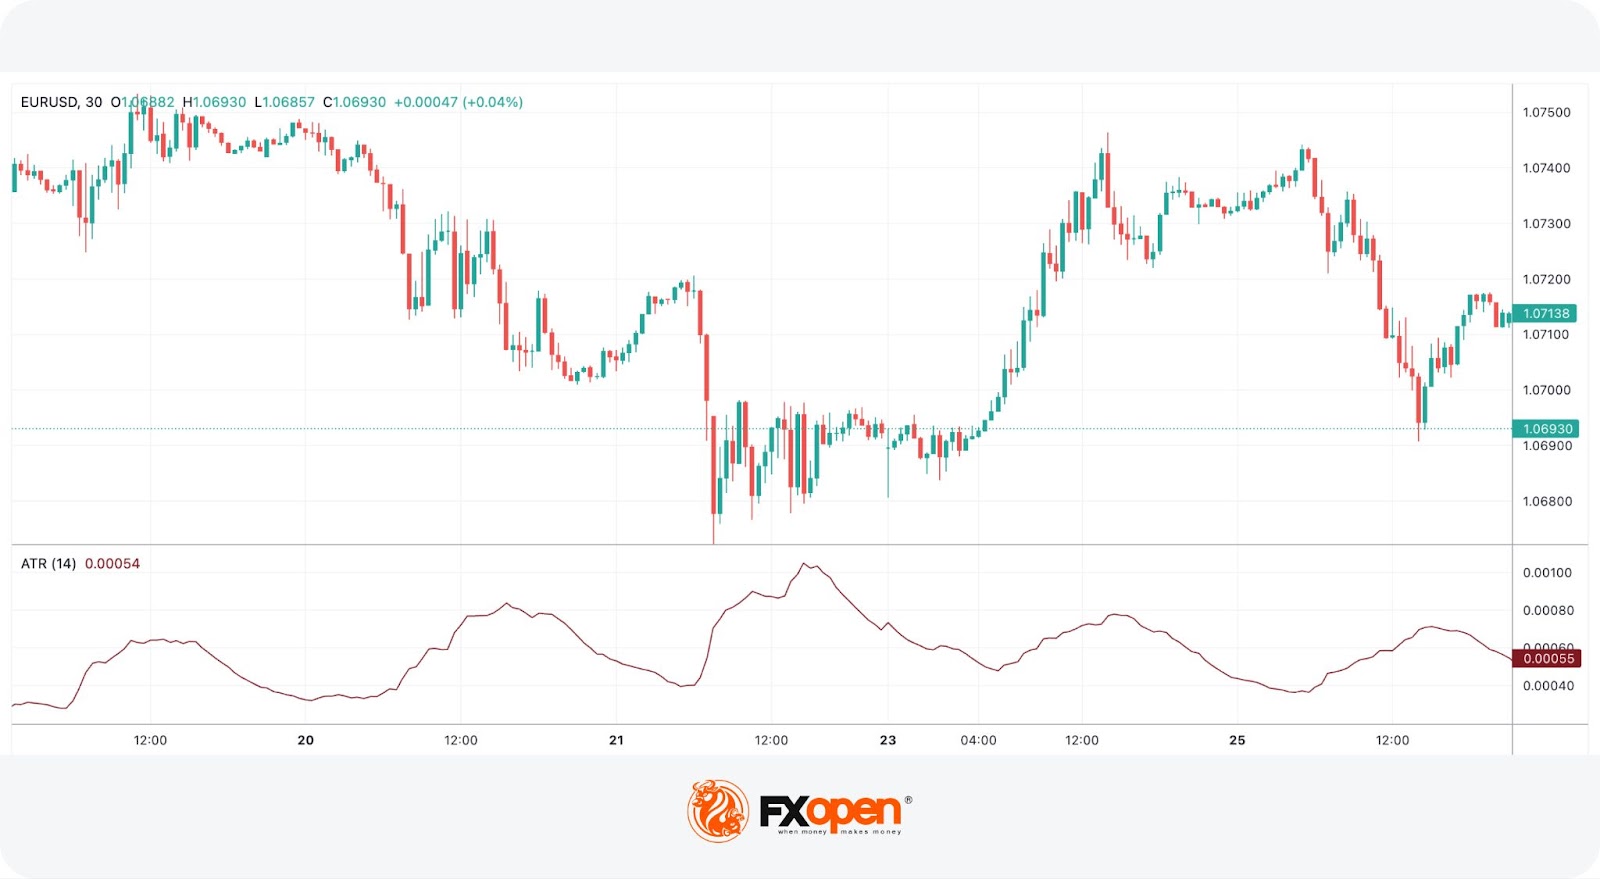
Average True Range (ATR)
The Average True Range (ATR) is a technical tool used to measure market volatility. It reflects the degree of price movement over a specified period, helping traders understand the level of volatility in an asset.
Calculation
ATR calculation includes several steps. Find more details in our article.
Signals
ATR does not indicate the price direction but rather the degree of price movement. Traders use ATR to make informed decisions about stop-loss levels and to gauge the potential for market moves. It’s one of the popular day trading indicators.
1. Volatility Measurement:
- A high ATR value indicates high volatility, while a low ATR suggests low volatility. This helps traders adjust their strategies based on market conditions.
2. Setting Stop-Loss Levels:
- Traders often set stop-loss orders at a multiple of the ATR value. For instance, a stop loss might be placed at twice the ATR below the entry price in a long position to account for volatility and reduce the risk of being stopped out prematurely.
3. Identifying Potential Breakouts:
- Sudden increases in ATR values can indicate the start of a new trend or a significant price move, alerting traders to potential trading opportunities.
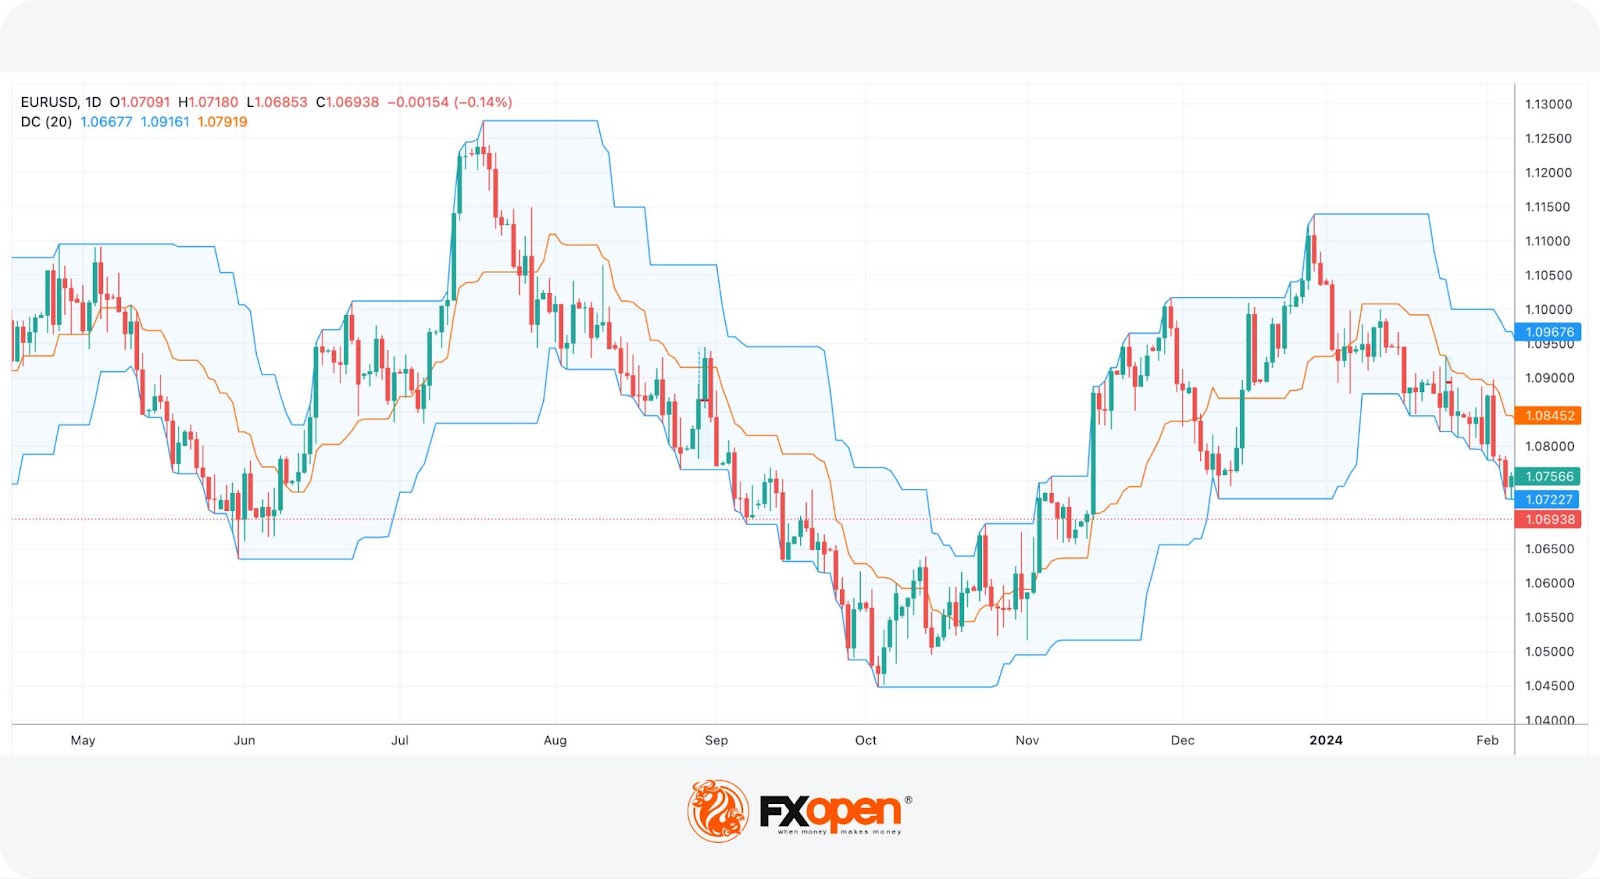
Donchian Channel Indicator
The Donchian Channel is a technical analysis tool designed to identify volatility, market trends, price reversals, and potential breakout points. It consists of three lines based on the highest high and lowest low over a specified period, typically 20 periods.
Definition
- Upper Boundary: The highest high over N periods.
- Lower Boundary: The lowest low over N periods.
- Middle Line: The average of the upper and lower boundaries.
These lines help traders determine market volatility and identify potential buy and sell signals based on price movements.
Signals
1. Tracking Volatility:
- Widening Channel: Indicates high volatility.
- Narrowing Channel: Indicates low volatility.
2. Identifying Trends:
- Bullish Trend: The upper boundary rises while the lower boundary stays flat.
- Bearish Trend: The lower boundary falls while the upper boundary stays flat.
3. Trading Breakouts:
- Above Middle Line: Potential bullish signal.
- Below Middle Line: Potential bearish signal.
4. Trading Reversals:
- In range-bound markets, the upper boundary acts as resistance and the lower boundary as support, guiding traders to close or open positions accordingly.
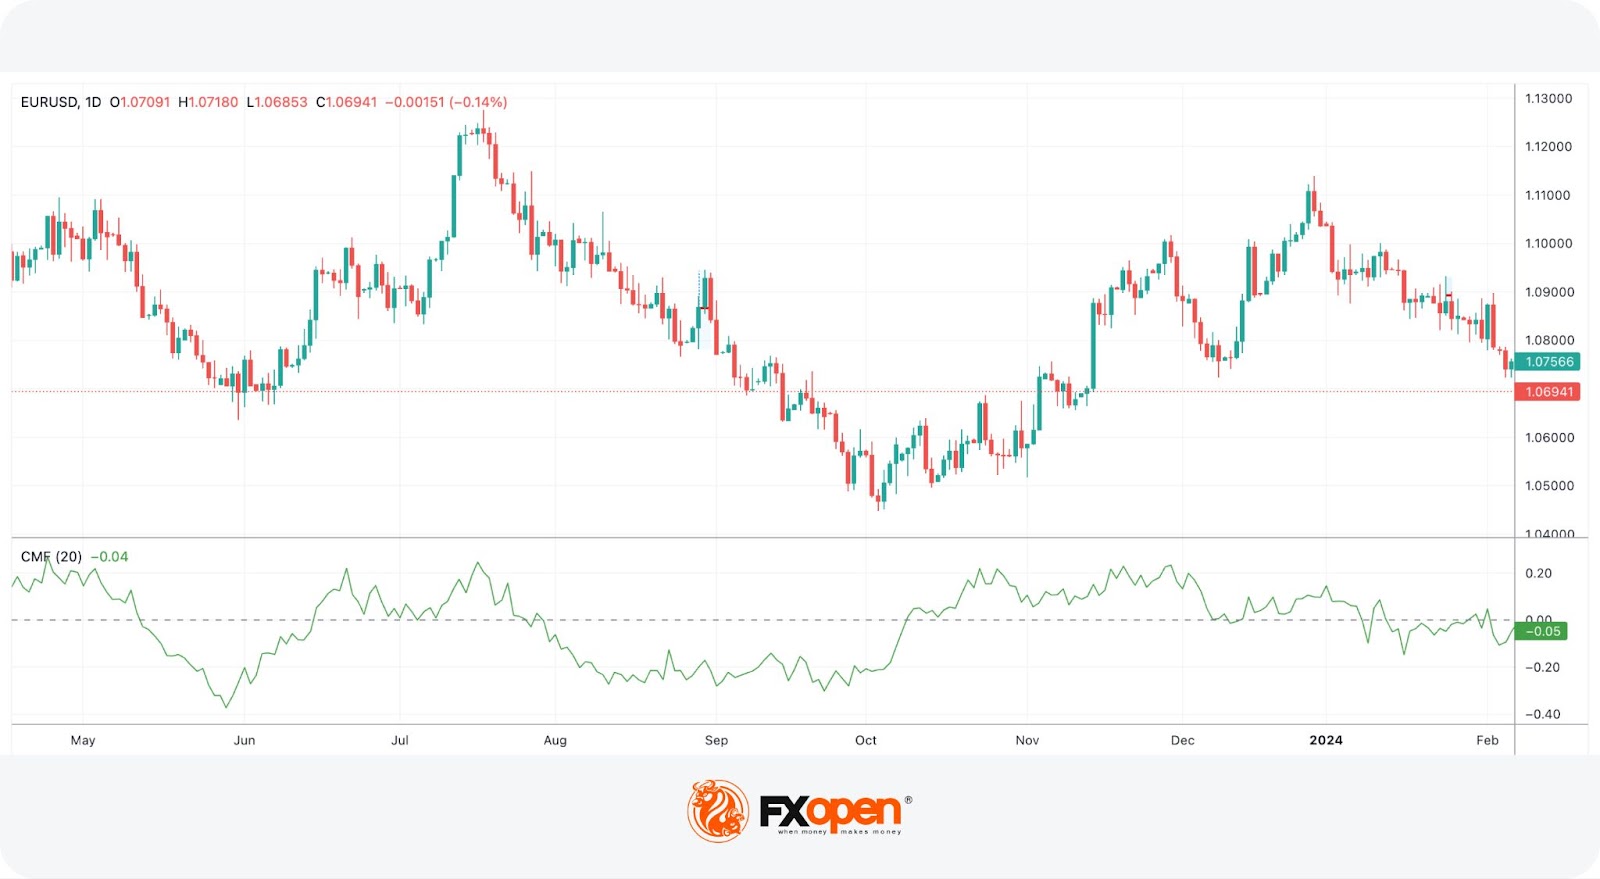
Chaikin Money Flow (CMF)
The Chaikin Money Flow (CMF) is a volume-weighted average indicator measuring the buying and selling pressure on an asset over a specific period, typically 20 or 21 periods. It combines price and volume data to provide insights into market sentiment and potential price movements, making it one of the key forex and stock market technical indicators.
Calculation
The CMF calculation involves three main steps:
- Money Flow Multiplier (MFM): (Close - Low) - (High - Close) / High - Low. This value ranges from -1 to 1 and is positive when the closing price is in the upper half of the period's range and negative when in the lower half.
- Money Flow Volume (MFV): Calculated by multiplying the MFM by the period's volume.
- CMF Value: The sum of MFVs over the period divided by the sum of volumes over the same period.
The resulting CMF values fluctuate between -1 and +1, providing a visual representation of money flow into and out of the asset.
Signals
1. Trend Strength:
- Positive CMF: Indicates buying pressure, suggesting a bullish trend.
- Negative CMF: Indicates selling pressure, suggesting a bearish trend.
2. Trend Reversal:
- Bullish Divergence: Occurs when the price makes lower lows, but the CMF makes higher lows, indicating a potential reversal to the upside.
- Bearish Divergence: Occurs when the price makes higher highs, but the CMF makes lower highs, indicating a potential reversal to the downside.
3. Breakout Confirmation:
- A breakout in price above/below a key level accompanied by a breakout in the CMF value above/below previous highs/lows can confirm the strength of the move.
Average Directional Movement Index (ADX)
The Average Directional Movement Index (ADX) is an indicator traders apply on a chart to measure the strength of a trend. It is particularly useful for traders who want to determine whether a market is trending or ranging.
Definition
The ADX consists of a single line that fluctuates between 0 and 100. It does not indicate the direction of the trend but rather its strength. The standard ADX setting is a 14-period, but this can be adjusted to suit different trading styles.
- 0-25: Indicates a weak or non-existent trend.
- 25-50: Signals a strong trend.
- 50-75: Suggests a very strong trend.
- 75-100: Reflects an extremely strong trend.
Signals
1. Trend Strength:
- A rising ADX value above 25 indicates a strengthening trend, regardless of whether it is bullish or bearish.
- A falling ADX below 25 suggests a weakening trend or a ranging market.
2. Trend Momentum:
- When ADX peaks and starts to decline, it can signal a potential weakening of the current trend, indicating that traders might consider closing or reducing positions.
Combining ADX with DI Lines
The ADX is often used in conjunction with the Positive Directional Indicator (+DI) and Negative Directional Indicator (-DI) lines:
- +DI > -DI: Suggests a bullish trend.
- -DI > +DI: Indicates a bearish trend.
A rising ADX alongside these signals confirms the strength of the current trend.
Traders use this indicator to enter trades. For this, they look for ADX to rise above 25 to confirm the beginning of a strong trend before entering trades in the direction of the trend indicated by the +DI and -DI lines.
Commodity Channel Index (CCI)
The Commodity Channel Index (CCI) is a momentum-based indicator that measures the deviation of an asset's price from its historical average. It helps traders identify potential overbought or oversold conditions, trend reversals, and divergence signals.
Calculation
CCI is calculated using the formula:
- CCI = (Typical Price − SMA) / 0.015 * Mean Deviation,
where:
- Typical Price = (High + Low + Close) / 3
- SMA = Simple Moving Average of the Typical Price
- Mean Deviation = Average of the absolute differences between the Typical Price and its SMA
The constant 0.015 normalises the CCI values, ensuring that approximately 70-80% of the values fall between -100 and +100.
Signals
1. Overbought and Oversold Conditions:
- Above +100: Indicates the asset is overbought, suggesting a potential price pullback or a downward reversal.
- Below -100: Indicates the asset is oversold, suggesting a potential pullback or an upward reversal.
2. Trend Reversals:
- Bullish Divergence: When the market is making lower lows while the CCI makes higher lows, potentially preceding a bullish reversal.
- Bearish Divergence: When the market is making higher highs while the CCI makes lower highs, potentially preceding a bullish reversal.
3. Trade Entries:
- Traders consider entering long positions when CCI breaks above -100 from below.
- Conversely, traders might enter short positions when CCI moves below +100 from above.
Keltner Channel
The Keltner Channel is a popular technical analysis tool used to determine market trends, price volatility, and potential reversal points. It consists of three lines: an exponential moving average (EMA) in the middle, and upper and lower bands calculated by adding and subtracting a multiple of the Average True Range (ATR) to the EMA.
Definition
The standard settings for Keltner Channels typically use a 20-period EMA and an ATR multiplier of 2. These settings can be adjusted to suit different trading styles and timeframes, making Keltner Channels effective technical indicators for day trading. The EMA provides a smoothed average price, while the ATR measures volatility. The bands expand and contract based on market volatility, creating a channel around the price.
Signals
1. Trend Identification:
- Upward-Sloping Channel: Indicates a bullish trend.
- Downward-Sloping Channel: Indicates a bearish trend.
- Flat Channel: Suggests a ranging market.
2. Dynamic Support and Resistance:
- The upper and lower bands of the Channels serve as dynamic levels of support and resistance. Price action within these bands can help traders identify potential entry and exit points.
3. Breakout Signals:
- Bullish Breakout: Price closing above the upper band.
- Bearish Breakout: Price closing below the lower band.
The Bottom Line
These ten technical indicators could be added to your toolkit to potentially enhance your trading strategies. By understanding their signals and applications, traders can better navigate the worlds of forex, stocks, commodities, and cryptocurrencies*. Open an FXOpen account today to access advanced trading tools and start implementing these indicators in live markets.
FAQs
Which Types of Trading Indicators Are Common to Use?
4 common types of technical indicators include trend (Moving Averages, ADX), momentum (RSI, Stochastic Oscillator), volume (On-Balance Volume, VWAP), and volatility (Bollinger Bands, ATR) indicators. These help traders analyse trends, momentum, volume, and volatility.
How Many Indicators Should a Trader Use?
Traders often use 2-3 indicators to avoid overcomplication and conflicting signals. Combining different types of indicators can provide a more comprehensive analysis.
Why Do Indicators Fail?
Indicators can fail due to market volatility, news events, and their inherent lag. They may also produce false signals in choppy markets. Combining indicators with risk management can potentially improve reliability.
Is It Better to Trade Without Indicators?
Trading without indicators, known as price action trading, can be effective for experienced traders. However, using a few indicators can provide valuable insights and confirm price movements for most traders.
*At FXOpen UK and FXOpen AU, Cryptocurrency CFDs are only available for trading by those clients categorised as Professional clients under FCA Rules and Professional clients under ASIC Rules, respectively. They are not available for trading by Retail clients.
This article represents the opinion of the Companies operating under the FXOpen brand only. It is not to be construed as an offer, solicitation, or recommendation with respect to products and services provided by the Companies operating under the FXOpen brand, nor is it to be considered financial advice.
Stay ahead of the market!
Subscribe now to our mailing list and receive the latest market news and insights delivered directly to your inbox.


Latest articles

USD/CAD Rises to a Two-Month High
Today, the USD/CAD currency pair climbed above the 1.3787 level for the first time since late January.
→ Demand for the US dollar is being supported by concerns over escalating tensions in the Middle East. Market participants are favouring

Alphabet (GOOGL) Shares Fall to 2026 Low
As the chart shows, Alphabet (GOOGL) shares have dropped to their lowest level of 2026, with trading closing well below the psychological $300 per share mark.
Why Have Alphabet (GOOGL) Shares Declined?
The bearish move is driven by a combination

FX Market Awaits Macro Data: EUR/USD and GBP/USD Near Range Boundaries
European currencies are trading without a clear direction against the US dollar, remaining in a consolidation phase following the earlier decline driven by USD strength. At the start of the week, both EUR/USD and GBP/USD attempted a recovery,