


FXOpen

Markets can trick even experienced traders. A dead cat bounce describes a short-lived recovery during a prolonged market downtrend. While it may seem like a rebound, it often precedes further declines. This article delves into what a dead cat bounce is, its causes, how to identify it, and strategies for trading it.
What Is the Dead Cat Bounce Pattern?
A dead cat bounce is a temporary recovery in the price of a falling asset, followed by a continuation of the downtrend. This phenomenon occurs in all types of financial markets, including stocks, forex, and crypto*, and can mislead traders into believing that a market or asset has started to recover, only to see prices fall again.
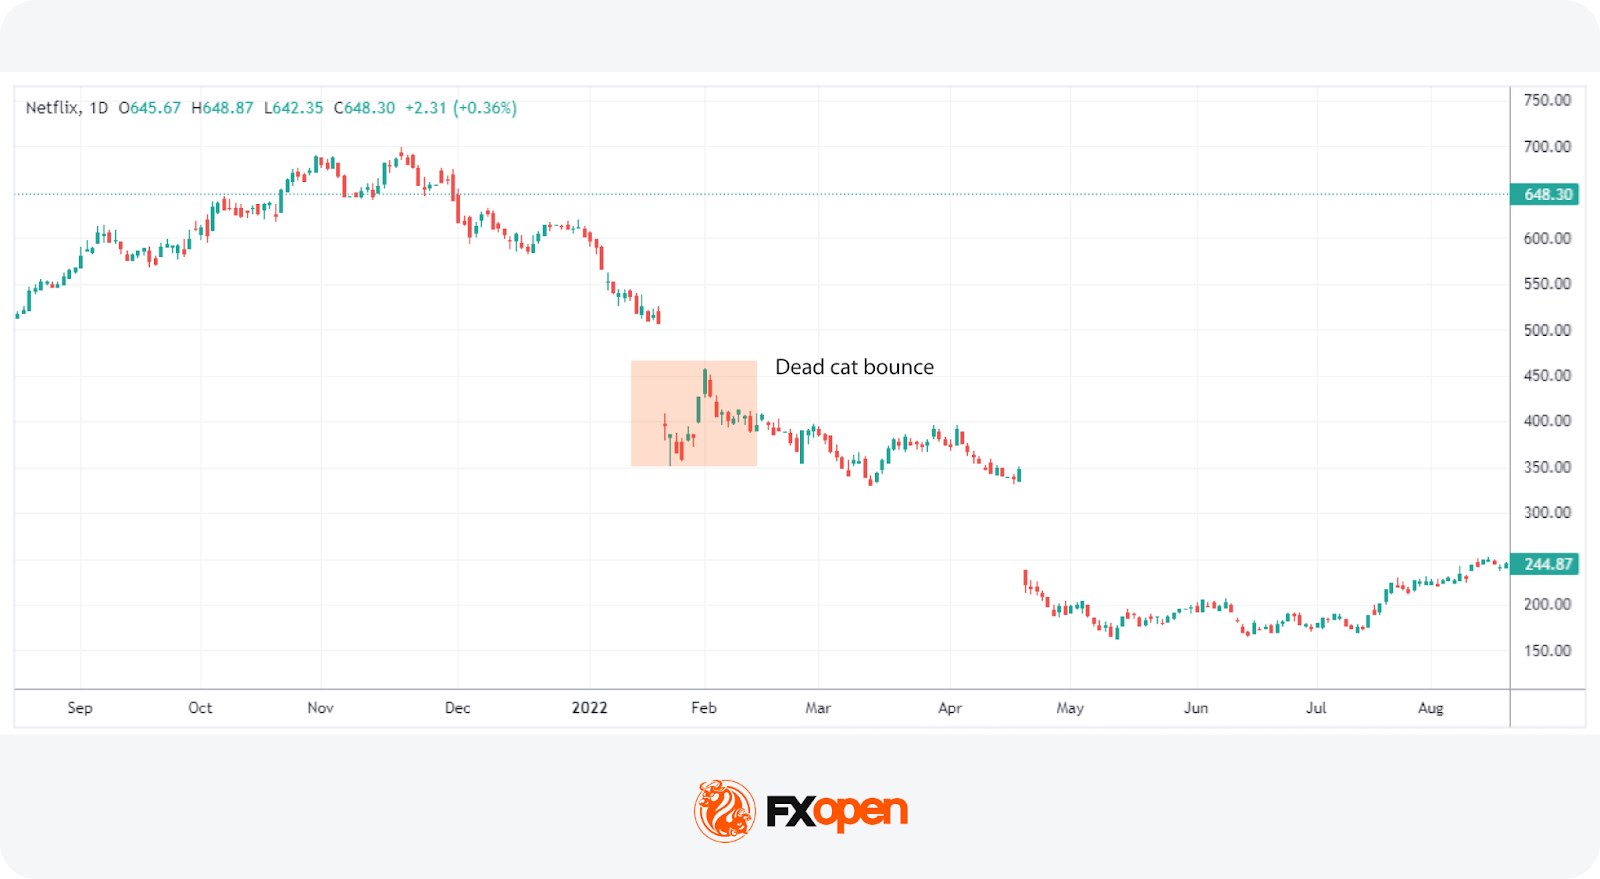
The term "dead cat bounce" originates from the saying that "even a dead cat will bounce if it falls from a great height." In financial terms, this means that a sharp decline is often followed by a brief, albeit false, recovery. For example, during the 2008 financial crisis, many stocks experienced dead cat bounces as they briefly recovered before continuing their downward trajectory.
Identifying a dead cat bounce requires careful analysis. For instance, in a dead cat bounce in a crypto* asset, a sudden 10% rise might appear promising. However, if this increase is followed by another decline surpassing the recent lows, it confirms a dead cat bounce.
Traders often use volume analysis and resistance levels to spot these patterns, noting that a true recovery is usually accompanied by sustained volume and breaking through significant resistance levels.
Characteristics of a Dead Cat Bounce
A dead cat bounce is characterised by a specific market behaviour that signals a temporary recovery amidst a prolonged downtrend. Recognising these features may help traders avoid being misled by false recoveries.
- Sharp Decline Preceding the Bounce: A significant drop in asset prices that breaks through single or multiple support levels.
- Brief and Sudden Rebound: The asset experiences a quick, short-lived rise in price.
- Low Trading Volume: The bounce usually occurs with lower trading volume compared to the initial decline, indicating weak buyer interest.
- Continuation of Downtrend: After the brief rebound, the asset's price continues to fall, often reaching new lows.
- Lack of Strong Fundamentals: The recovery lacks strong fundamental support, often driven by short-covering or speculative buying rather than genuine positive news.
Causes of a Dead Cat Bounce
A dead cat bounce is typically caused by several common factors that create a temporary illusion of recovery in a declining market.
- Short-Covering: Traders who have previously sold the asset buy it back to cover their positions, causing a temporary price increase.
- Speculative Buying: Some investors buy into the declining asset, hoping to capitalise on what they perceive as a bargain, which briefly drives prices up.
- Technical Support Levels: The asset hits a technical support level, prompting a temporary rebound as traders react to these key price points.
- Positive News: Positive news related to the asset, such as cost-cutting measures in a company, strong country GDP growth, or even rumours can cause temporary optimism and buying interest.
However, while these factors may provide some support for the asset, it’s rare for the market to recover fully. Given that the sharp fall preceding the bounce is often due to a significant shift in fundamentals or indicative of strong selling pressure, the bearish trend is likely to prevail.
Identifying a Dead Cat Bounce
Identifying a dead cat bounce involves careful analysis of price movements, trading volume, resistance levels, momentum indicators, and market sentiment.
Price Movements
A dead cat bounce typically follows a sharp decline that clears previous support levels with little resistance, often prompted by significant news releases. After this steep fall, the price may find a temporary base at another support level and begin to rise. However, this recovery generally regains less than 50% of the initial drop.
Volume
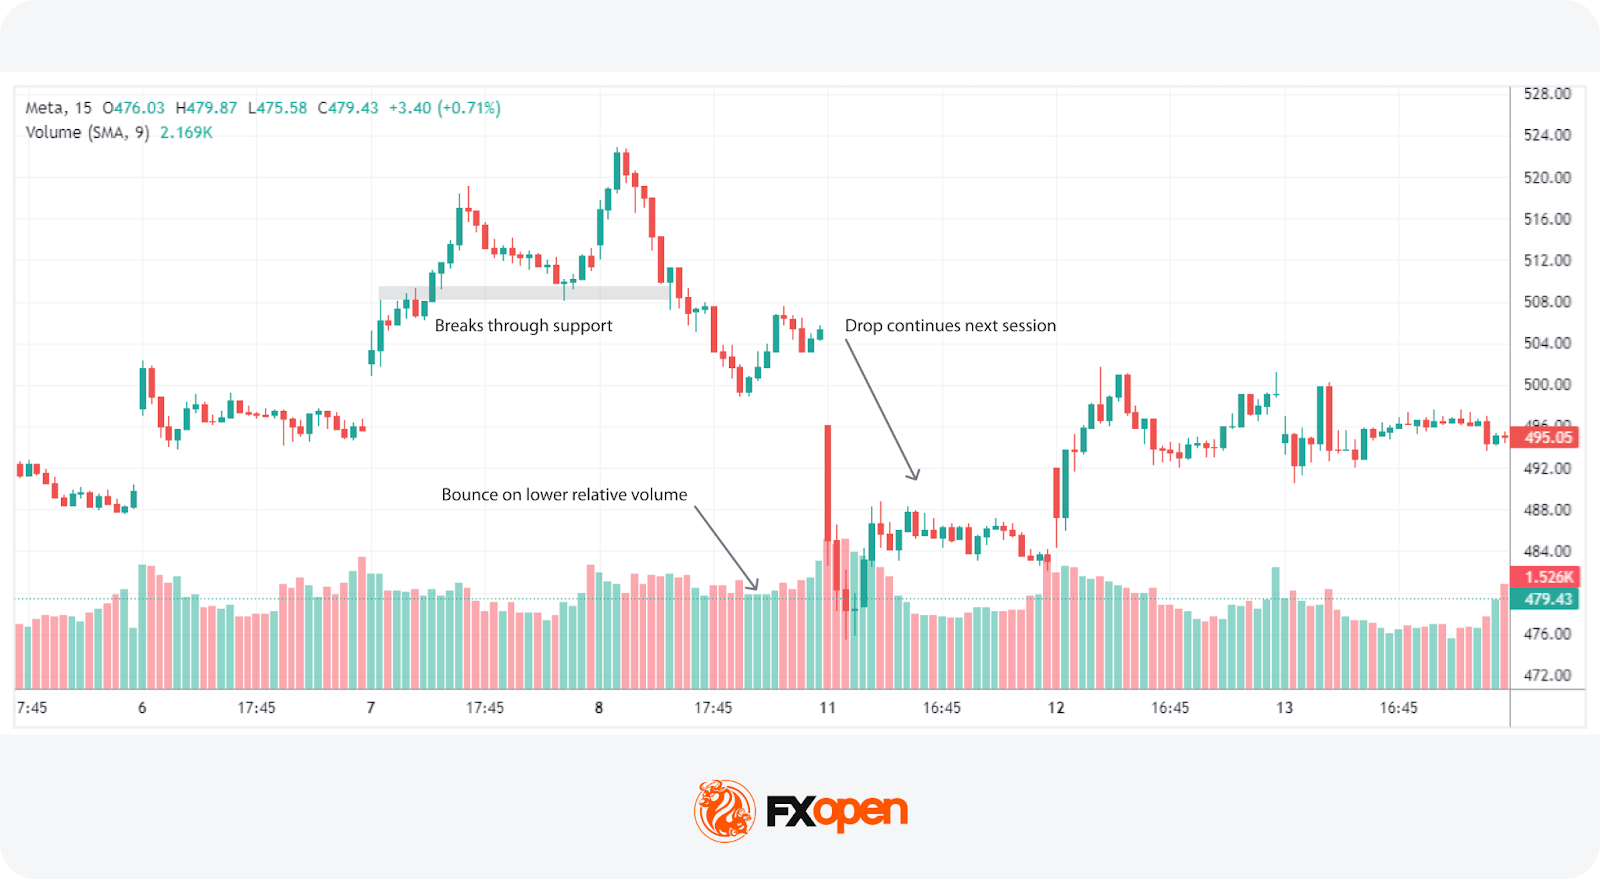
The rebound in a dead cat bounce often occurs on weaker volume, indicating less conviction behind the recovery. This is especially noticeable in assets traded on centralised exchanges, like stocks or crypto*. In forex, assessing volume can be challenging due to its decentralised nature.
It’s important to consider the timeframe; daily charts may help traders detect volume patterns in a dead cat bounce, while intraday volumes can be misinterpreted due to natural ebbs and flows as trading sessions progress.
Resistance Levels
The rebound may fail to break through significant resistance levels, such as a prior support level turned resistance or the last swing high in the downtrend. If the price approaches but cannot surpass these levels and subsequently drops again, it's a strong indication of a dead cat bounce. Monitoring these resistance points may help validate the pattern.
Momentum Indicators
Using technical indicators like the Stochastic Oscillator or Awesome Oscillator (AO) can provide clues about a dead cat bounce. These indicators may show only a slight improvement or remain in bearish territory, indicating weak momentum.
It’s important to recognise that these indicators might show false bullish signals, such as an oversold Stochastic or a bullish AO zero-line crossover, as the bounce begins. Therefore, they may have the most value in detecting continuation, such as a bearish hidden divergence.
To explore these indicators among 1,200+ trading tools, you can head over to FXOpen’s TickTrader trading platform.
Market Sentiment
If broader market conditions and sentiment remain negative or if the news driving the rebound is not substantial, the bounce is likely temporary. It’s important to consider the overall picture and what has fundamentally changed for the asset rather than reacting to temporary retracement.
Trading a Dead Cat Bounce: The Strategy
When a trader recognises a potential dead cat bounce, they might consider entering a short position to capitalise on the continuing downtrend. Here are some strategies that may be used for trading this pattern.
Since a bounce may sometimes be genuine and lead to a quick recovery, it's prudent for traders to wait for confirmation that the downtrend is ready to continue. This cautious approach also allows for placing a stop loss in a defined area—specifically, just above the high of the bounce.
Trading Signals
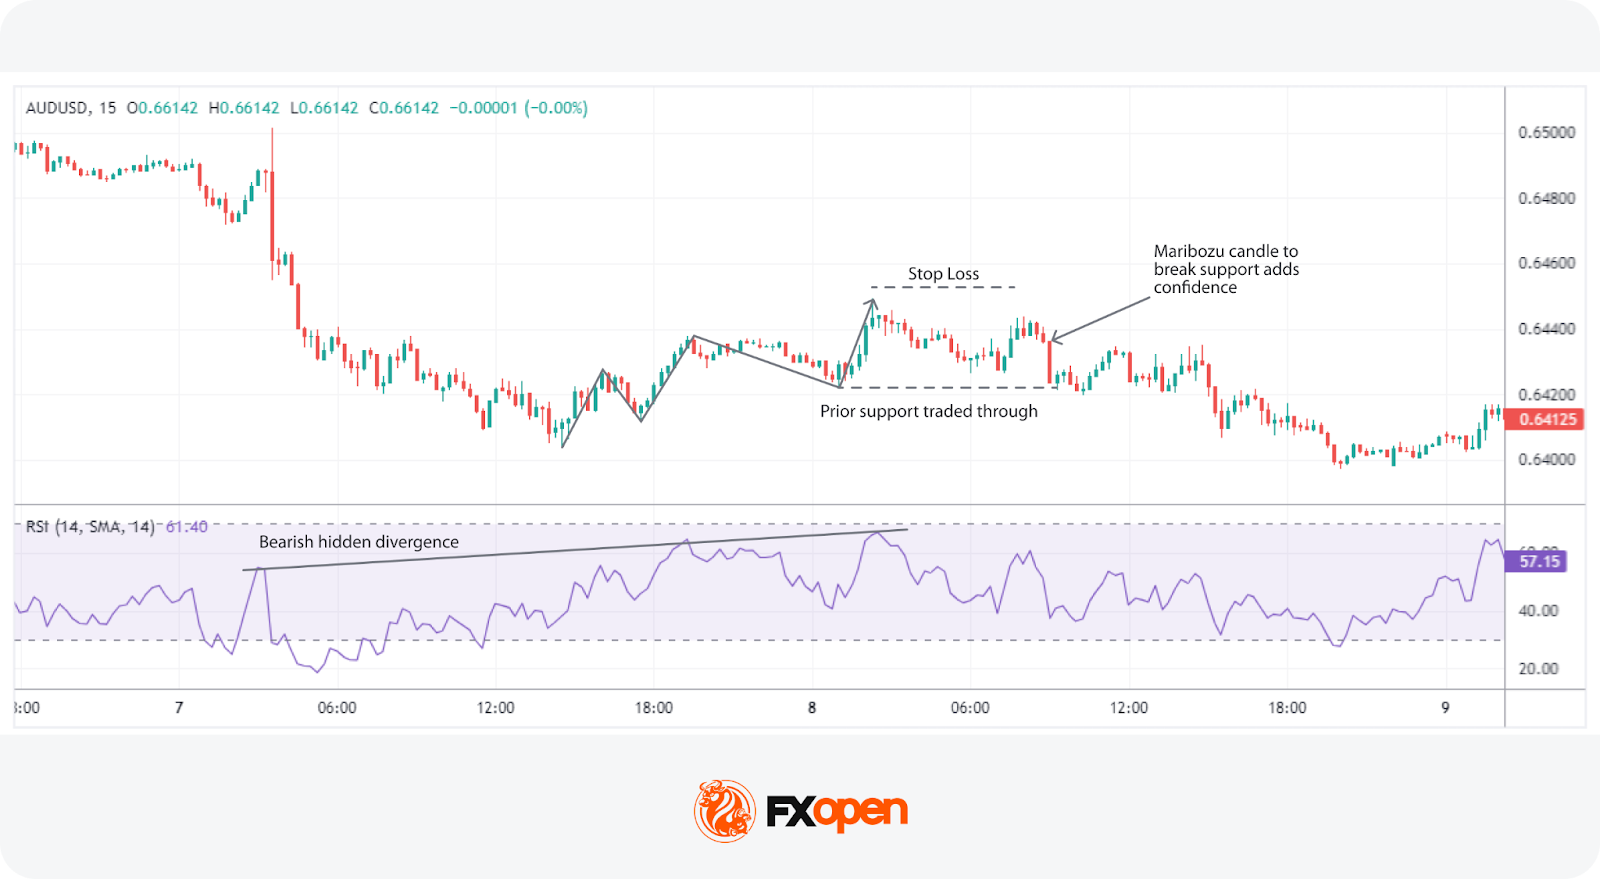
Traders typically watch for the last higher low established during the bounce to be traded through. In other words, they wait for the short-term bullish trend to appear to falter with a lower low. As seen in the dead cat bounce chart above, this indicates that the most recent support level during the bounce has failed, signalling the downtrend might continue.
If the price fails to break through a prior area of resistance or a previous support level now acting as resistance, it may add some confirmation of the downtrend continuation.
Momentum Indicators
Momentum indicators can be used to confirm that the downtrend is ready to continue.
Specifically, a hidden bearish divergence, where the RSI makes a high higher than the high before or at the beginning of the downtrend; the RSI showing the asset is overbought; or the RSI struggling to break above 50 on a slightly higher timeframe (RSI < 50 indicates bearish conditions) can add confirmation.
With the MACD, the signal line may cross under the MACD line or struggle to break out of negative territory.
Chart Patterns and Candlestick Patterns
- Bearish Chart Patterns: Breaking out of patterns like a rising wedge, bearish quasimodo, or descending triangle can confirm the move lower.
- Bearish Candlestick Patterns: Patterns such as a shooting star, tweezer top, or marubozu candle can add confluence and confidence to the trade.
Setting Stop Loss and Take Profit
- Stop Loss: Traders usually set a stop loss just above the high of the dead cat bounce to potentially limit losses if the price unexpectedly rises.
- Take Profit: Given the likelihood of another significant downward leg, a take-profit order might be set at the next major support level. According to theory, this might help traders capture potential returns before the market finds new support and reverses.
Context-Dependent Strategy
Ultimately, there is no single way to trade a dead cat bounce in stocks or any other asset. However, using these factors to seek confirmation and waiting for a further breakdown before taking a position may help traders deal with this pattern.
The Bottom Line
The dead cat bounce reminds traders that not every rebound signals recovery. Understanding its causes, confirming signals with broader market analysis, and applying disciplined risk control can make the difference between a strategic entry and a wrong trade. Staying patient and data-driven is important when navigating volatile markets.
If you want to trade in over 700 markets with tight spreads from 0.0 pips, you may consider opening an FXOpen account.
FAQ
What Is a Dead Cat Bounce?
The dead cat bounce meaning refers to a temporary recovery in the price of a falling asset, followed by a continuation of the downtrend. It often misleads traders into believing that the market or asset is recovering, only to see prices fall again.
What Causes a Dead Cat Bounce?
Several factors can cause a dead cat bounce, including short-covering, speculative buying, and hitting technical support levels. Temporary improvements in market sentiment or positive news can also trigger these short-lived recoveries.
How May Traders Spot a Dead Cat Bounce?
A dead cat bounce can be identified by a sharp decline followed by a brief recovery that regains less than 50% of the initial drop. Low trading volume during the rebound, failure to break significant resistance levels, and weak momentum indicators are among major signals.
Is a Dead Cat Bounce Bullish or Bearish?
A dead cat bounce is a bearish pattern. It represents a brief, false recovery in a downtrend, followed by a continuation of the falling market.
How Long Does a Dead Cat Bounce Last?
The duration of a dead cat bounce varies depending on the timeframe but is typically short. On a daily chart, it may take between a few days and a few weeks; on a 5-minute chart, potentially less than a few hours.
How May Traders Analyse a Dead Cat Bounce?
Traders analyse a dead cat bounce by combining technical and fundamental analysis. They look for a sharp decline, a brief rebound on low volume, and then a continuation of the downtrend. Tools like moving averages, trendlines, and volume indicators may help confirm whether the bounce is temporary rather than a true reversal.
*Important: At FXOpen UK, Cryptocurrency trading via CFDs is only available to our Professional clients. They are not available for trading by Retail clients. To find out more information about how this may affect you, please get in touch with our team.
This article represents the opinion of the Companies operating under the FXOpen brand only. It is not to be construed as an offer, solicitation, or recommendation with respect to products and services provided by the Companies operating under the FXOpen brand, nor is it to be considered financial advice.
Stay ahead of the market!
Subscribe now to our mailing list and receive the latest market news and insights delivered directly to your inbox.


Latest articles

Market Analysis: GBP/USD Dips Further As EUR/GBP Regains Traction
GBP/USD failed to climb above 1.3500 and corrected some gains. EUR/GBP started a decent increase and might aim for more gains above 0.8700.
Important Takeaways for GBP/USD and EUR/GBP Analysis Today
· The British Pound


Market Insights with Gary Thomson: Oil, US Retail Sales & NFP in Focus
In this video, we’ll explore the key economic events and market trends, shaping the financial landscape. Get ready for insights into financial markets to help you navigate the week ahead. Let’s dive in!
In this episode of Market