


5 Popular Trading Strategies in 2026
FXOpen

Trading strategies provide a structured approach to participating in financial markets. They may help traders organise their decision-making process by using technical indicators, market patterns, and predefined rules. This article reviews five commonly used trading strategies and outlines how traders may apply them when developing their own approach to trading.
Understanding Different Types of Trading Strategies
Trading strategies provide a structured approach for varying trading styles, which may help traders make decisions based on specific criteria and market conditions, rather than on intuition and guesswork. Here are some key types of trading strategies:
- Trend Following: Traders aim to identify and get involved in trends, exploiting the trending nature of markets. Common indicators include moving averages and trendlines.
- Mean Reversion: Based on the idea that prices will revert to their mean or average level over time. Traders use indicators like Bollinger Bands and RSI to identify overbought or oversold conditions.
- Momentum: Focuses on assets that are moving strongly in one direction with high volume. Momentum traders use indicators such as the Moving Average Convergence Divergence (MACD) and Relative Strength Index (RSI).
- Breakout: Involves entering positions when the price breaks through a predefined level of support or resistance. Breakouts can be confirmed using volume data.
- Scalping: Aims to take advantage of small price changes over short periods. Scalpers typically rely on technical indicators like order flow data.
Types of Indicators and Patterns Used in Traders’ Strategies
In trading, various indicators and patterns are utilised to analyse market conditions and identify potential entry and exit points. These tools can be broadly categorised into several groups, each serving a specific purpose across different trading strategies.
1. Trend Indicators
Trend indicators offer a way for traders to identify a trend’s direction and strength. Some popular trend indicators include:
- Moving Averages (Simple, Exponential)
- Moving Average Convergence Divergence (MACD)
- Average Directional Index (ADX)
- Parabolic SAR
2. Momentum Indicators
Momentum indicators measure the speed and strength of price movements. They are used to identify overbought or oversold conditions. Common momentum indicators include:
3. Volatility Indicators
Volatility indicators gauge the degree of price variation over time, providing insights into market turbulence. Key volatility indicators are:
4. Volume Indicators
Volume indicators analyse the trading volume to confirm the strength of a price movement or trend. Notable volume indicators include:
- On-Balance Volume (OBV)
- Chaikin Money Flow (CMF)
- Volume Weighted Average Price (VWAP)
- Accumulation/Distribution Line
5. Reversal Patterns
Reversal patterns signal potential changes in market direction, allowing traders to anticipate trend reversals. Some reversal patterns are:
6. Continuation Patterns
Continuation patterns may help traders understand whether a current trend is likely to continue. Popular continuation patterns include:
7. Candlestick Patterns
Candlestick patterns are formed by one or more candlesticks on a chart and provide insights into market sentiment. Some candlestick patterns are:
These indicators and patterns form the foundation of many strategies, enabling traders to analyse market behaviour and make entry decisions. Below, we’ll use some of them in several different trading strategies.
Five Strategies for Traders
Now, let’s examine five trading strategies that may work if you modify them in accordance with your trading plan and common trading rules. While we’ve used the EUR/USD pair to demonstrate the examples, they can also be applied as commodity, crypto*, and stock market trading strategies.
You can consider heading over to FXOpen’s TickTrader platform to access the indicators discussed in these strategies and more than 1,200 trading tools.
VWAP and RSI
- Volume Weighted Average Price (VWAP): An indicator that shows the average price a security has traded at throughout the day, based on both volume and price.
- Relative Strength Index (RSI): A well-known momentum indicator that gauges the magnitude and change of market movements. It also indicates overbought and oversold market conditions.
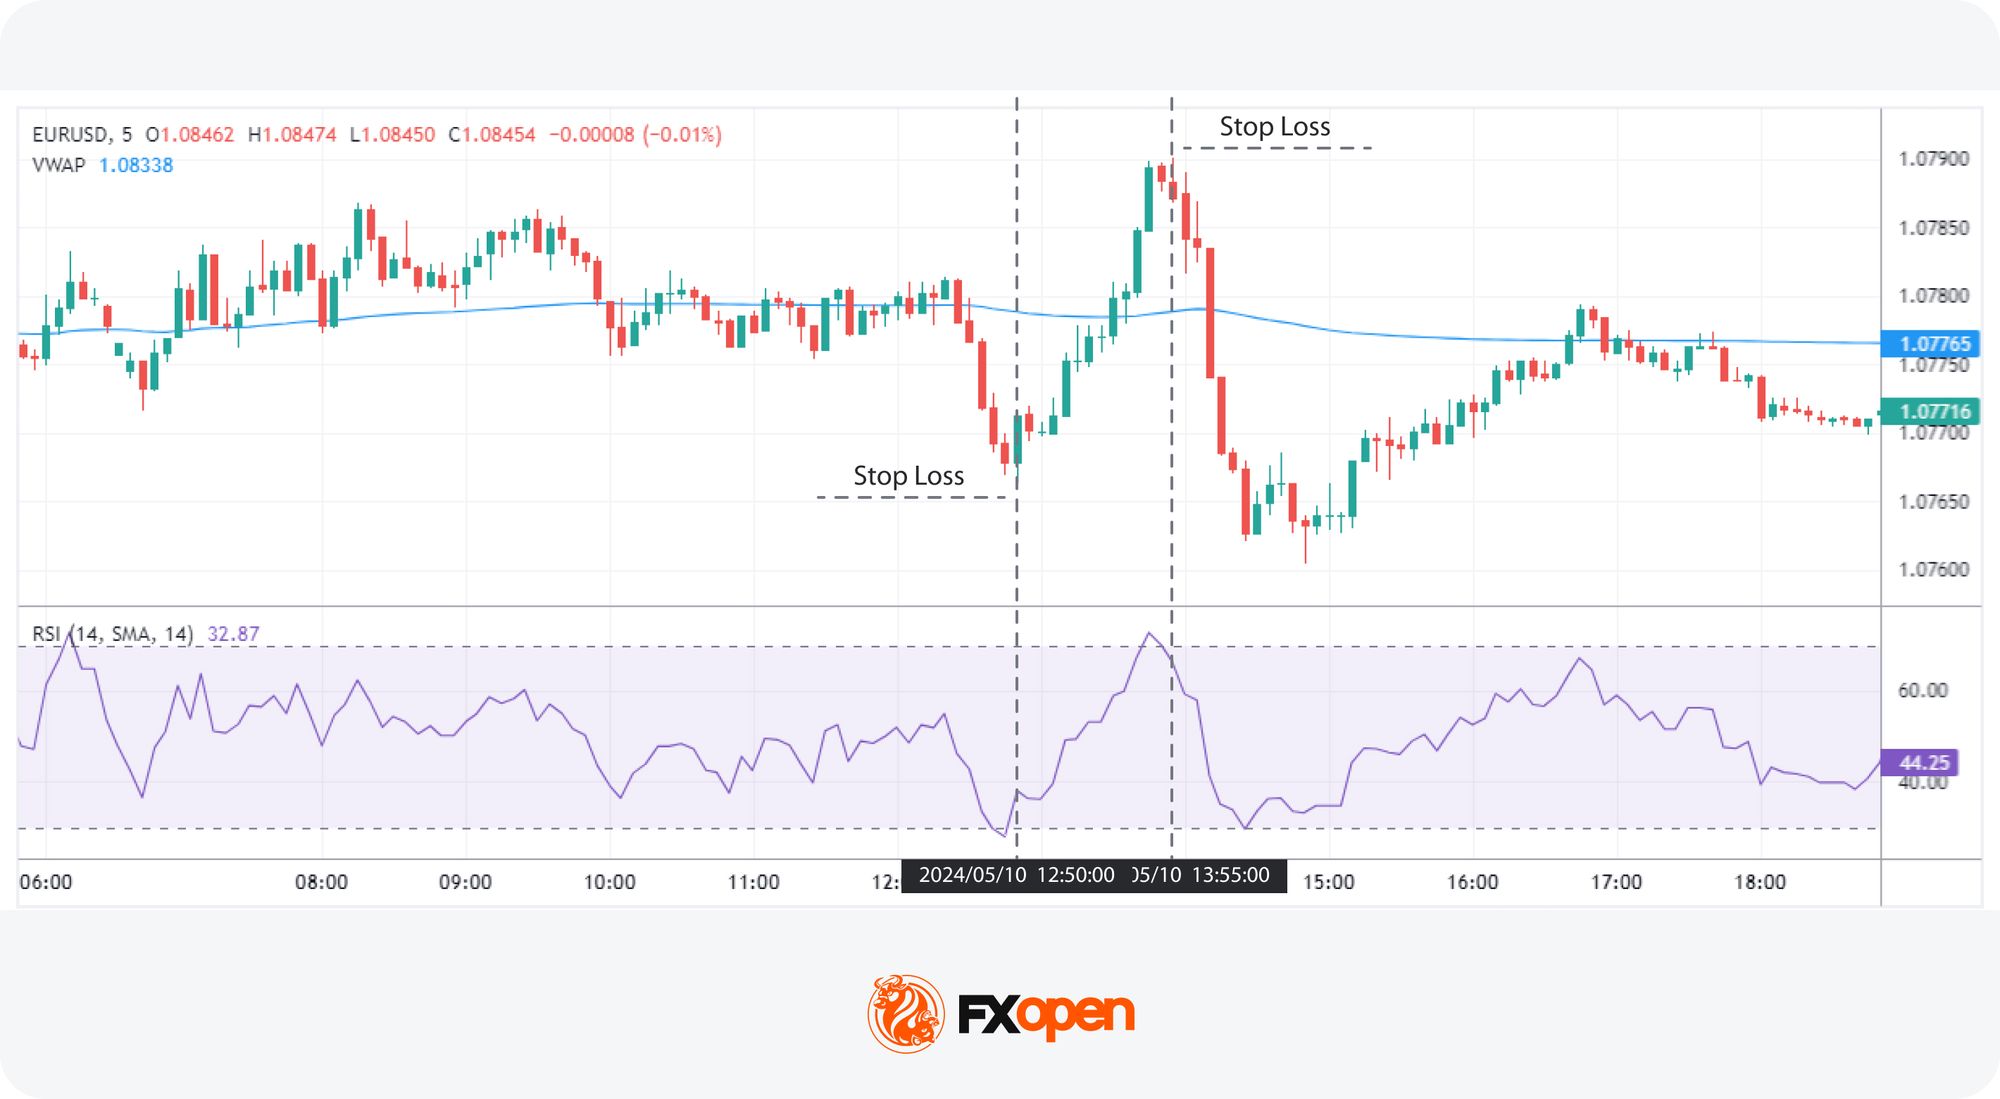
The VWAP and RSI trading method leverages mean reversion, which assumes that prices will revert to their mean value over time. This strategy combines VWAP’s price-volume insight with RSI’s momentum analysis, providing a clear picture of potential price reversals. According to theory, it’s usually used on intraday charts, typically the 5m or 15m, given the VWAP resets between trading days.
Entry
- Traders often look for RSI values above 70 (overbought) or below 30 (oversold) to indicate potential reversals.
- A short entry is typically considered when RSI crosses back below 70 and the price is above the VWAP.
- Conversely, a long entry is common when RSI crosses back above 30 and the price is below the VWAP.
- A divergence between RSI and the price can add confluence to the trade.
Stop Loss
- Stop losses might be set beyond the recent swing high for short positions or swing low for long positions.
Take Profit
- This approach is based on the mean reversion principle, aiming for prices to return to their average level. Therefore, traders could place take-profit levels at the VWAP.
- However, take profits might also be placed at a suitable support or resistance level.
Breakout and Retest
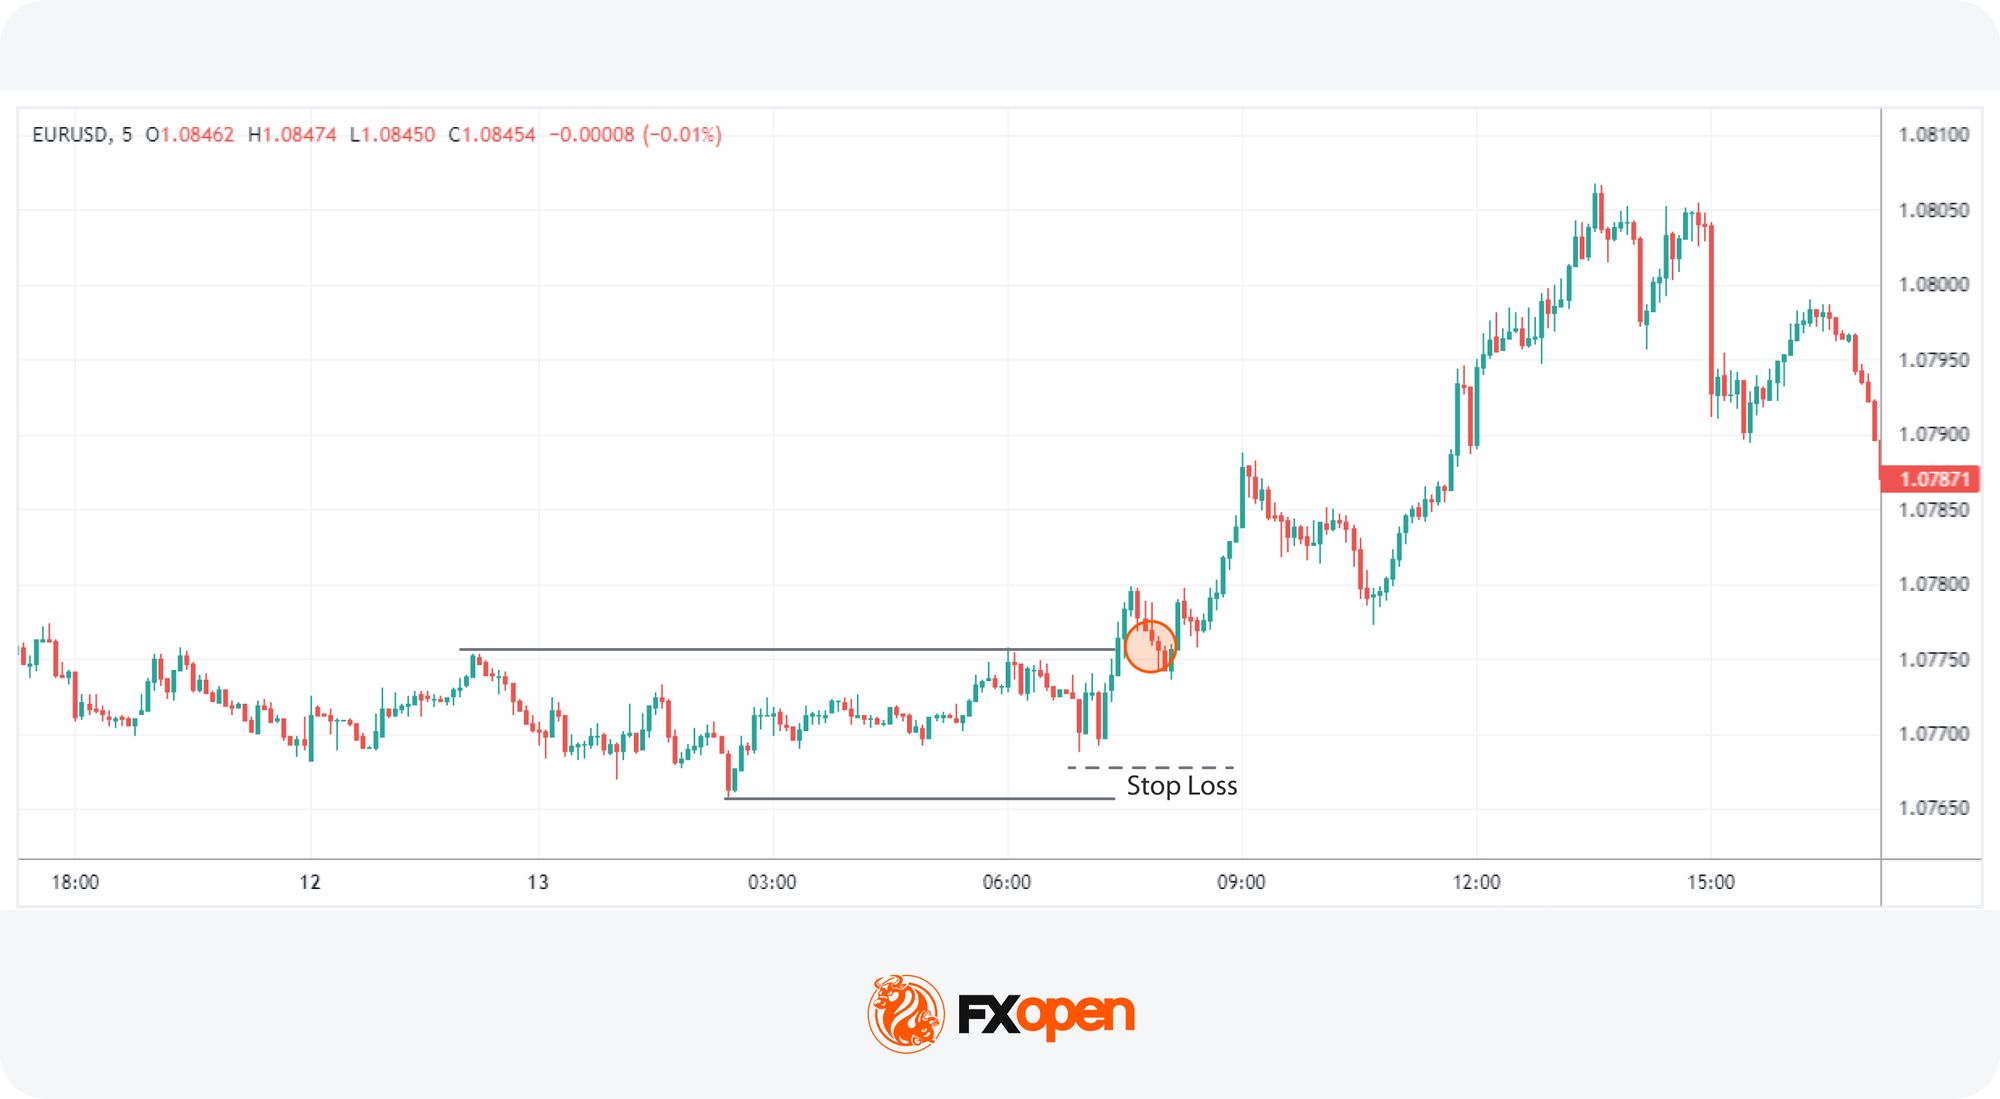
The Breakout and Retest trading technique focuses on identifying horizontal ranges or consolidation phases in the market. This strategy aims to take advantage of price movements that occur after the breakout of these ranges, leveraging the potential for substantial trend formation.
Entry
- Traders observe a horizontal range or consolidation period with a directional bias in mind.
- A strong movement or candle closing beyond the range signals a breakout.
- Traders typically set a limit order at the range's high (for a bullish breakout) or low (for a bearish breakout) after the breakout occurs.
Stop Loss
- Stop losses might be placed below the range's low for bullish breakouts or above the range's high for bearish breakouts. This risk management approach may help protect against false breakouts and reversals.
- However, a trader could also place a stop loss above or below the nearest swing point, which might provide a more favourable risk/reward ratio.
Take Profit
- Given that breakouts from consolidation ranges often lead to prolonged price moves, traders commonly set take-profit levels at key support or resistance levels.
Fibonacci and Stochastic
- Fibonacci Retracement: A tool used to identify potential support and resistance levels by measuring the distance between a significant high and low.
- Stochastic Oscillator: A momentum indicator comparing a security’s closing price to its price range over a specified period, typically used to identify overbought or oversold conditions.
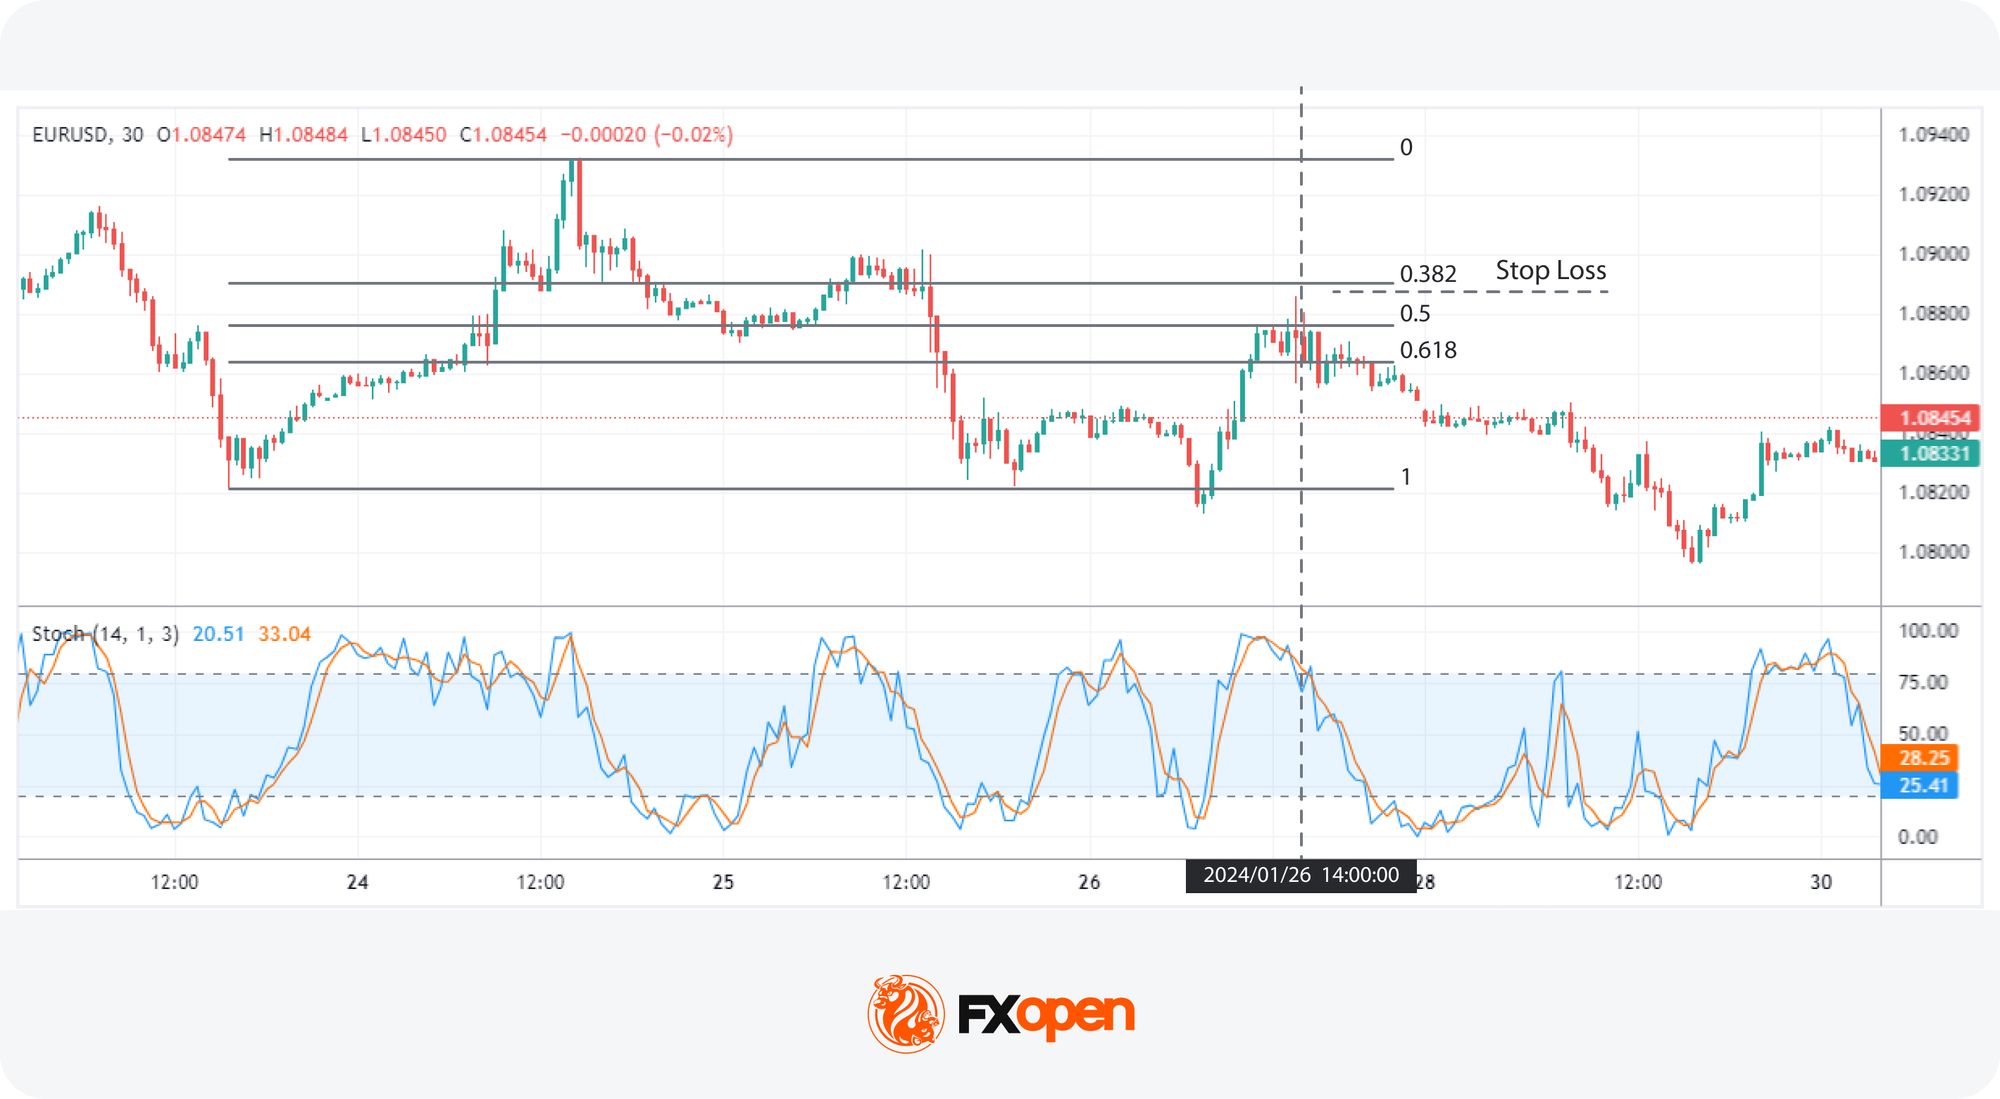
The Fibonacci and Stochastic strategy combines Fibonacci retracement levels with the Stochastic Oscillator to identify potential price reversals in trending markets. This approach leverages key retracement levels and momentum signals, offering traders a method for timing entries and exits.
Entry
- Traders typically observe a new low in a bear trend or a new high in a bull trend.
- A Fibonacci retracement is then applied between the prior high and low, focusing on the 0.382, 0.5, or 0.618 levels.
- As the price approaches these levels, traders look for signs of rejection, such as candlestick patterns like a shooting star or hammer.
- Additionally, traders watch for the Stochastic Oscillator to cross back below 80 (in a bear trend) or above 20 (in a bull trend).
- When the Stochastic moves beyond these levels, an entry is sought.
Stop Loss
- Stop losses might be set just beyond the entry swing point or the next Fibonacci level.
Take Profit
- Profit targets might be set at a valid support or resistance level.
Bollinger Band Squeeze and MACD
- Bollinger Bands: A volatility indicator consisting of a middle band (usually a simple moving average) and two outer bands set at standard deviations from the middle band.
- Moving Average Convergence Divergence (MACD): A momentum indicator valuable in trending markets, designed to measure the relationship between two moving averages.
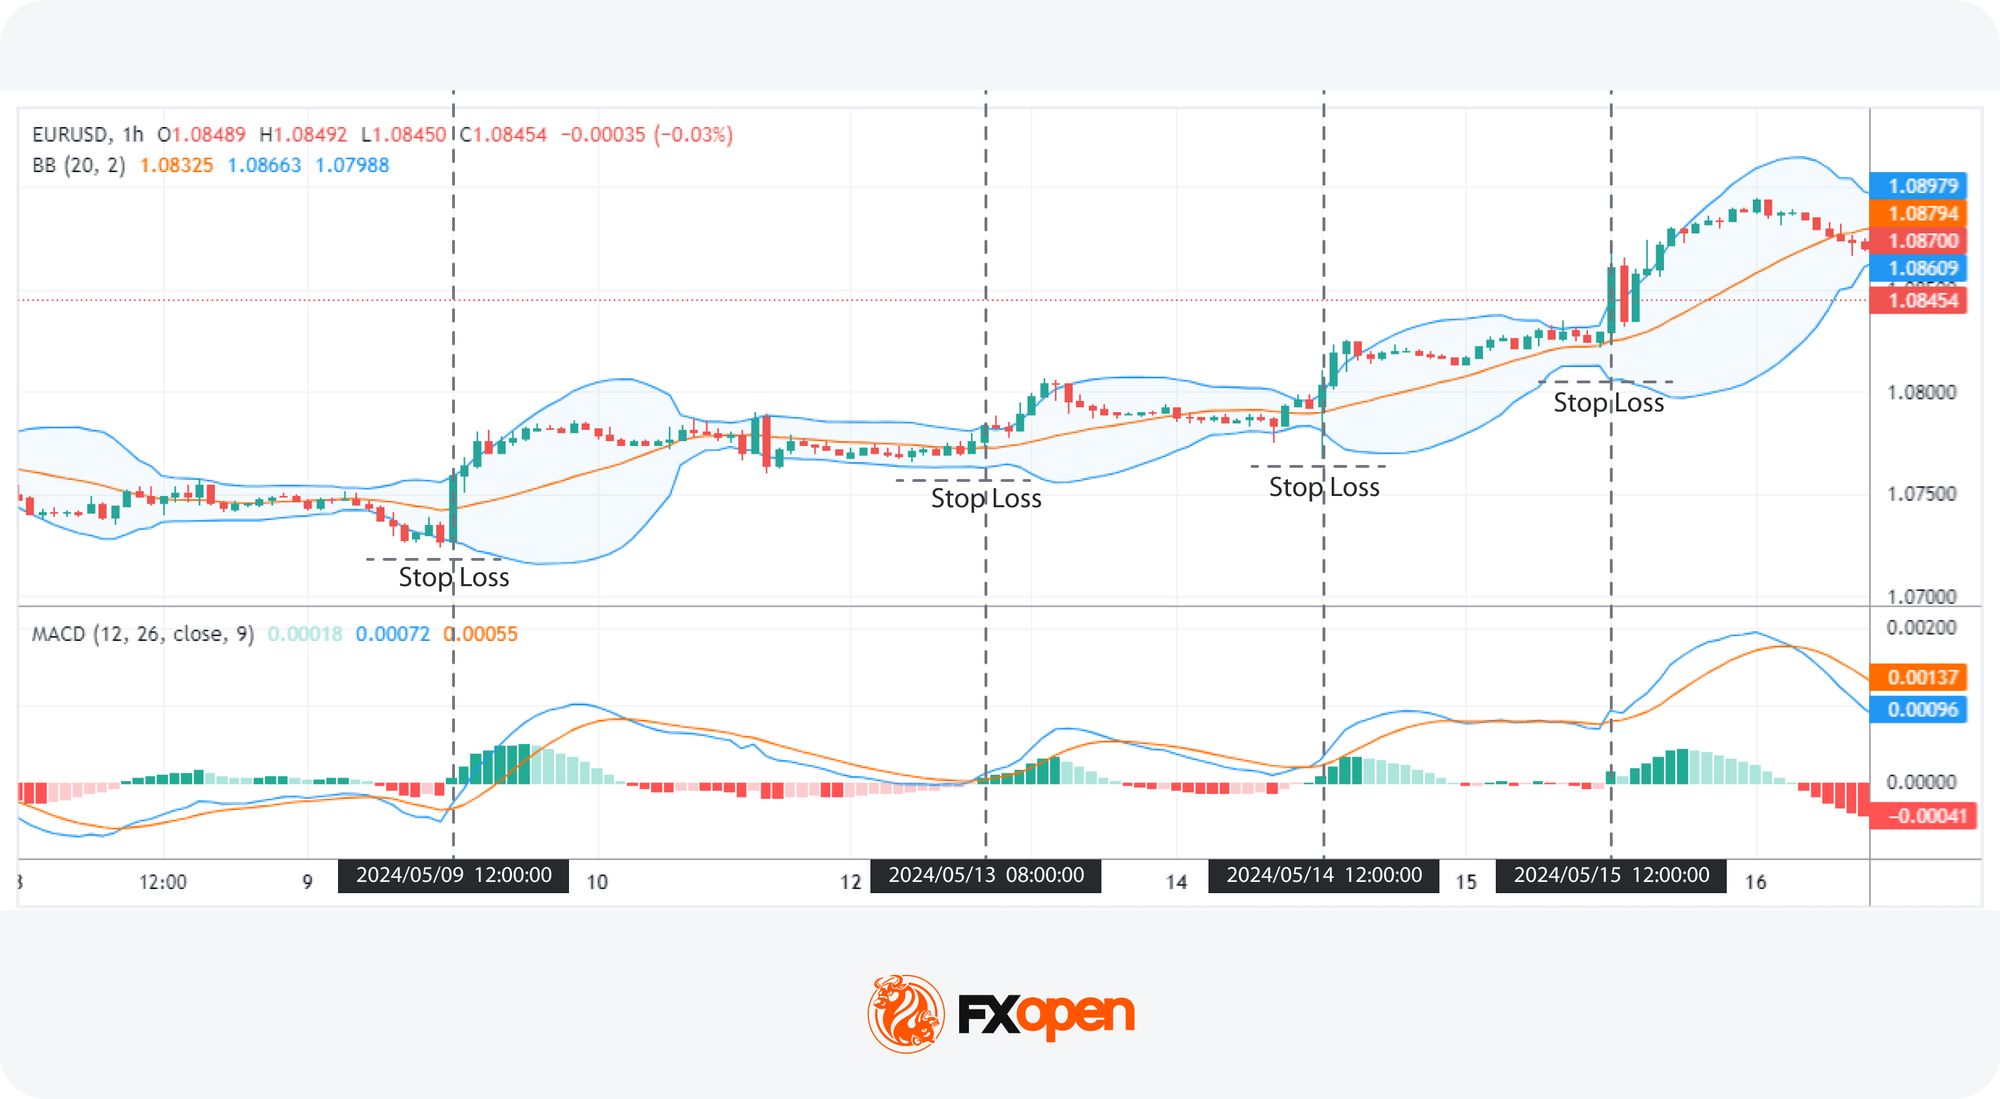
The Bollinger Band Squeeze and MACD strategy combines Bollinger Bands' volatility analysis with MACD's momentum confirmation. This approach identifies potential breakouts above/below the Bollinger band following periods of low volatility, providing a robust framework for trading such events. The strategy is used in a solid trend and in the direction of the trend.
Entry
- Traders look for Bollinger Bands to constrict, indicating reduced volatility.
- The MACD is used to confirm the breakout direction. Traders typically watch for the MACD signal line to cross above the MACD line for a bullish breakout or below for a bearish breakout.
- The breakout is generally confirmed by a strong price movement in the direction of the MACD crossover.
Stop Loss
- Stop losses might be set beyond the opposite edge of the Bollinger Bands.
Take Profit
- Profit targets might be placed when the price closes near or beyond the opposite edge of the Bollinger Bands. This method is used by traders to take advantage of the full extent of the breakout move.
Keltner Channel and RSI Momentum
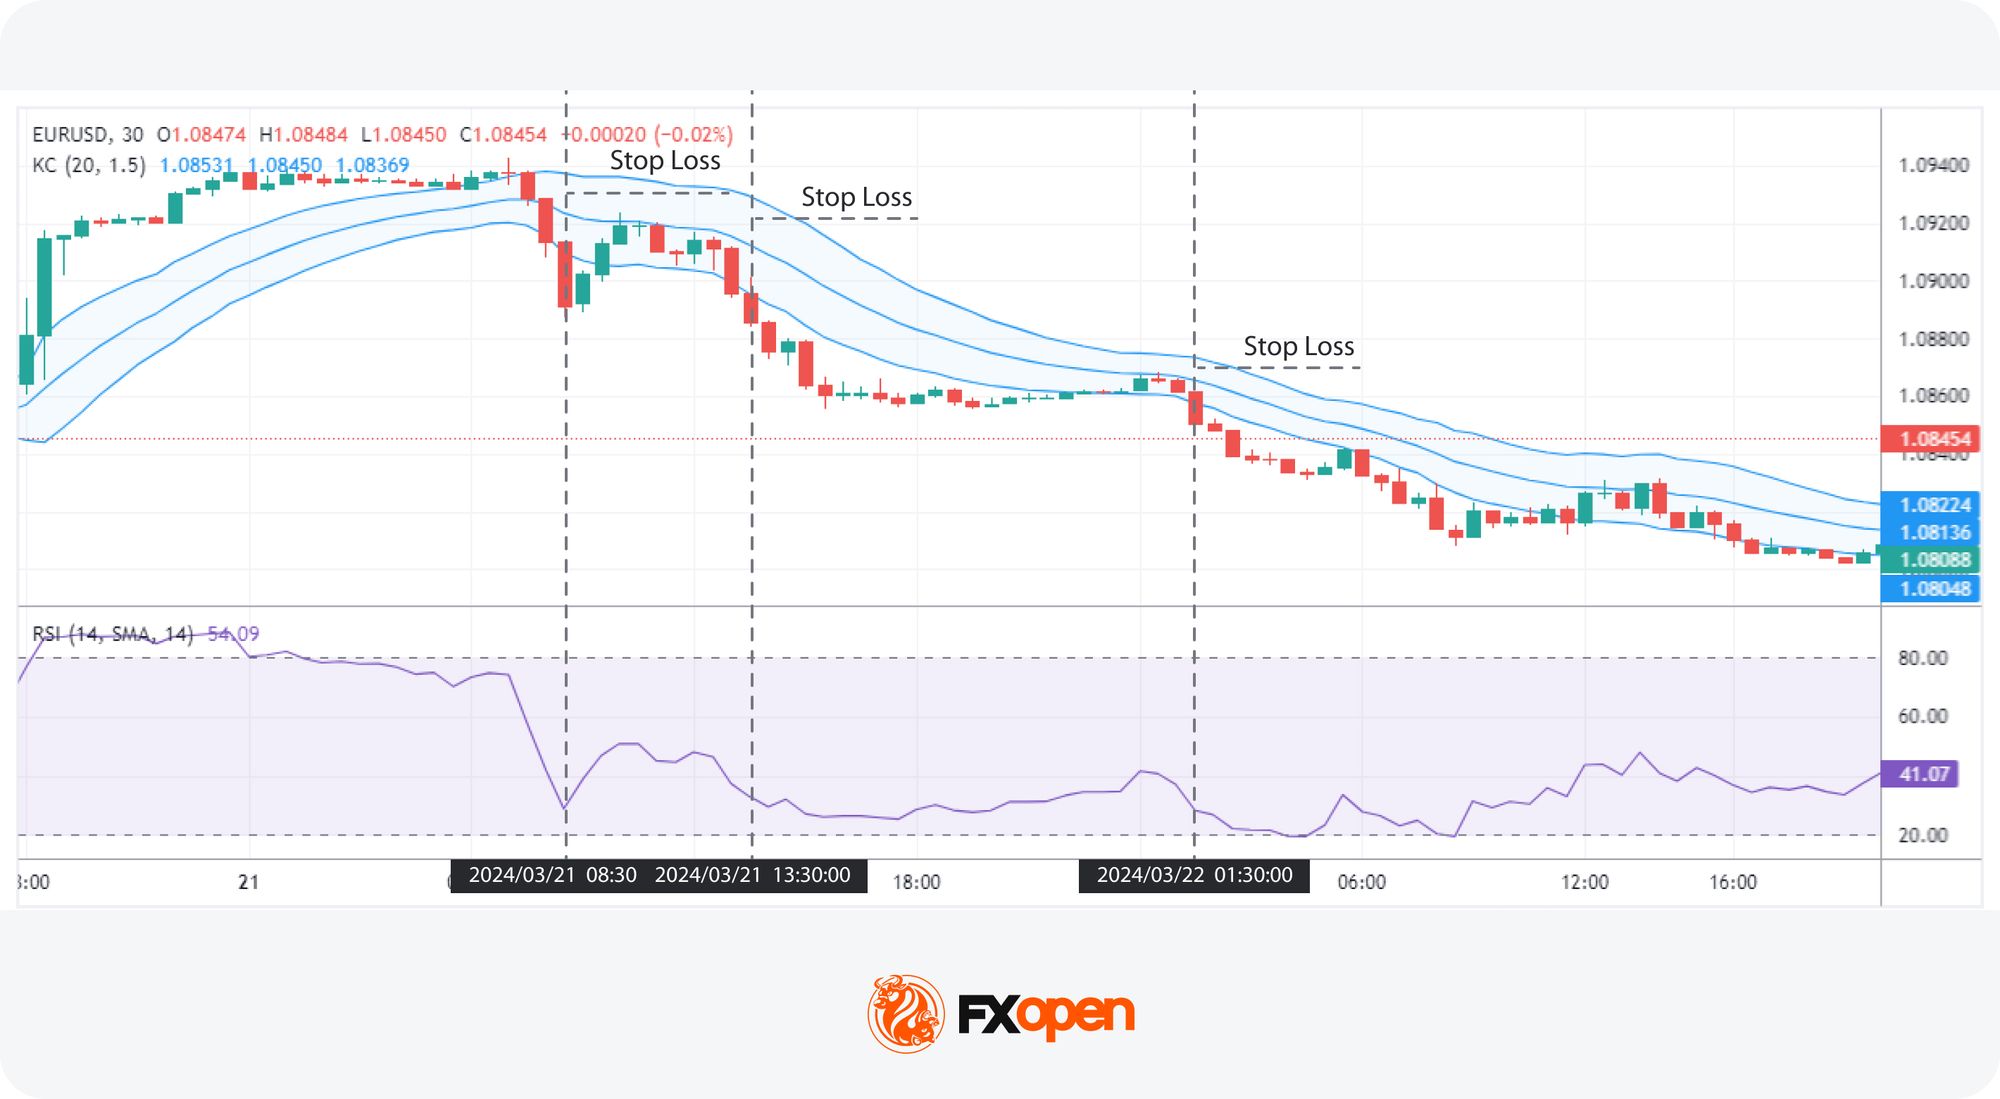
- Keltner Channels (KC): A volatility-based indicator consisting of bands set around an exponential moving average, typically using a multiplier of 1.5 times the Average True Range (ATR).
The Keltner Channel and RSI Momentum strategy leverages volatility and momentum to identify potential entry points. This approach focuses on price movements outside the Keltner Channel, confirmed by RSI. The strategy is applied within the strong trend.
Entry
- Traders observe RSI to be above 50 but below 80 for bullish setups, indicating upward momentum without being severely overbought. For bearish setups, RSI should be below 50 but above 20.
- A decisive close outside the Keltner Channel signals a potential trade. For a bullish entry, the price should close above the upper channel, with RSI confirming by staying within the bullish range. Conversely, for a bearish entry, the price should close below the lower channel, with RSI confirming by staying within the bearish range.
Stop Loss
- Stop losses might be set beyond the midpoint of the Keltner Channel.
- Alternatively, stop losses might be placed on the other side of the channel, depending on the trader's risk tolerance.
Take Profit
- Take-profit targets might be placed at key support or resistance levels, providing logical exit points based on market structure.
- Additionally, traders might exit when the price closes beyond the opposite side of the Keltner Channel.
- Another exit strategy is to close the trade when RSI reaches overbought (above 80) or oversold (below 20) levels, indicating potential exhaustion of the current move.
The Bottom Line
Understanding and applying different trading strategies allows traders to develop a more structured and consistent approach to market participation. Each strategy offers a different perspective on price behaviour and market dynamics, making it important to consider how they align with individual trading styles, time horizons, and risk preferences.
FXOpen provides access to over 1,200 tools and supports a range of trading approaches within a trading environment. You can consider opening an FXOpen account and gain access to 4 trading platforms, tight spreads*, and low commissions* (*additional fees may apply).
FAQs
What Is the Most Basic Trading Strategy?
The most basic trading strategy is the moving average golden and death cross strategy. This approach involves using two moving averages, typically 50-day and 200-day, to identify buy and sell signals. A golden cross occurs when the short-term 50-day moving average crosses above the long-term 200-day moving average, signalling a bullish market trend. Conversely, a death cross happens when the 50-day moving average crosses below the 200-day moving average, indicating a bearish trend.
What Strategy Do Most Day Traders Use?
According to theory, day traders use momentum trading. This strategy involves identifying assets that are moving significantly in one direction on high volume. In a stock trading strategy, for instance, a day trader might buy a stock climbing strongly backed by higher-than-average volume. They might rely on technical indicators like Moving Average Convergence Divergence (MACD) and Relative Strength Index (RSI) to make decisions.
How Do Traders Backtest a Trading Strategy?
To backtest a trading strategy, traders use historical data to simulate the performance of a strategy over a specified period. This involves applying the strategy's rules to past data to see how it would have performed. Traders typically use backtesting software or platforms that allow for detailed analysis and visualisation of results.
How Can I Create My Own Trading Strategy?
Creating a trading strategy involves several steps. First, traders identify their trading goals and risk tolerance. Then, they choose the market and timeframe they want to trade. After that, they develop specific entry and exit rules using technical indicators and patterns. Finally, traders test their strategy using historical data to ensure it works more often than it fails before applying it to live trading. Also, ChatGPT is widely used by traders to create trading strategies. You can read our article ‘How to Use ChatGPT to Make Trading Strategies.’
*Important: At FXOpen UK, Cryptocurrency trading via CFDs is only available to our Professional clients. They are not available for trading by Retail clients. To find out more information about how this may affect you, please get in touch with our team.
This article represents the opinion of the Companies operating under the FXOpen brand only. It is not to be construed as an offer, solicitation, or recommendation with respect to products and services provided by the Companies operating under the FXOpen brand, nor is it to be considered financial advice.
Stay ahead of the market!
Subscribe now to our mailing list and receive the latest market news and insights delivered directly to your inbox.


Latest articles

Weekly Market Insights with Gary Thomson: The Week of Central Banks and Earnings
In this video, we’ll explore the key economic events and market trends, shaping the financial landscape. Get ready for insights into financial markets to help you navigate the week ahead. Let’s dive in!
In this episode of Market

Intel at a Crossroads: Earnings Beat Meets Technical Resistance
Intel has just delivered its strongest quarter in over fifteen years, and the market reaction says it all. Q2 2026 revenue surged 25% year-over-year to $16.1 billion, crushing the consensus estimate of $14.42 billion, while adjusted EPS of

Tesla: Complex Range Structure Breaks Down Following Quarterly Earnings
Tesla released its Q2 2026 results after the market closed on 22 July. Revenue increased 26% year-on-year to $28.24 billion, while vehicle deliveries reached a record 480,126 units. However, operating margin fell sharply to 1.4%, down from